Search Results for: bigquery

Announcing The Television News Ngram 2.0 Dataset
Last year we unveiled the television news ngram dataset, a compilation of 30-minute word frequency histogram tables of unigrams and…
Trump's Tweets Capture Media Attention Again After Fading From Prominence
Last fall we looked at how often Donald Trump's tweets had been cited in the world's news media from 2016…
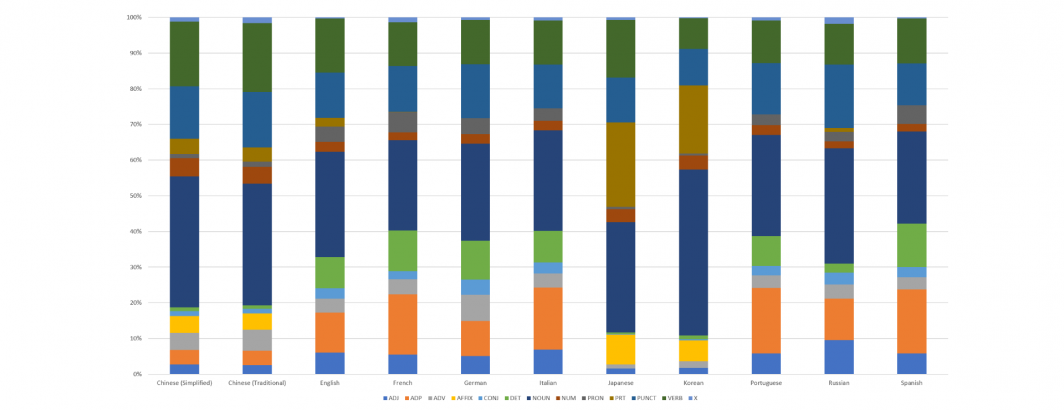
A Four-Month Look At Part Of Speech Distribution In A Multilingual World
In January, we visualized one week's worth of the part of speech distribution of the 11 languages annotated by Google's…
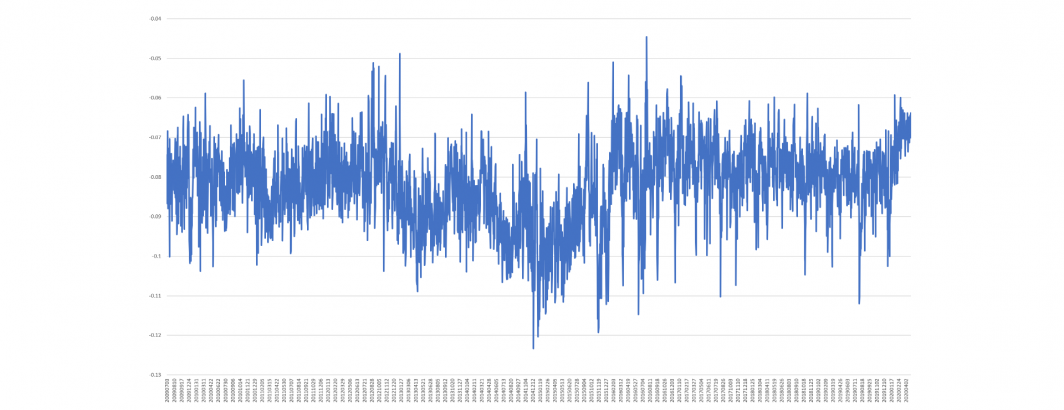
A Decade Of Extended Moral Foundations Dictionary (eMFD) Scores For Television News
With a single SQL query and the Television News Ngram Dataset, its possible to run large-scale macro emotional assessments of…

Using The Global Quotation Graph To Track Statements About Hydroxychloroquine
Using the new Global Quotation Graph it requires just a single line of SQL to compile a list of public…
Announcing The Global Quotation Graph
We are tremendously excited to announce today the debut of the GDELT Global Quotation Graph, which compiles quoted statements in…
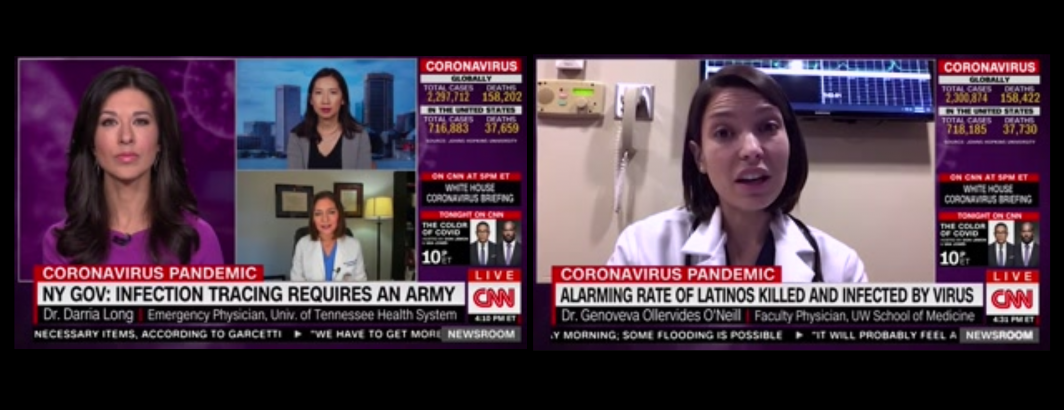
Updated Dr.'s Chronology From Television News OCR
We've updated our chronology of Dr.'s from the onscreen OCR'd text of television news that we first released last week….

Global Geographic Graph Now Updating Daily
The Global Geographic Graph is now updating each morning 3-4AM UTC, allowing you to create continually updated geographic analyses. The…
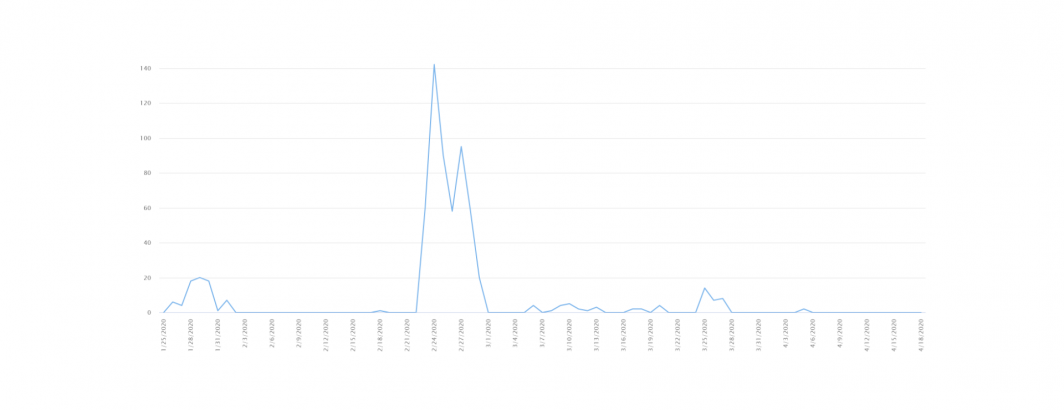
How Trend Detection Can Flag Bursty Advertising Campaigns
One of the metrics we track in the Visual Global Entity Graph (VGEG) 2.0 using Google's Cloud Video API to analyze…
Greater Variety Of Objects And Activities Depicted On CNN In Covid-19 Era
One of the metrics we track in the Visual Global Entity Graph (VGEG) 2.0 using Google's Cloud Video API to analyze…
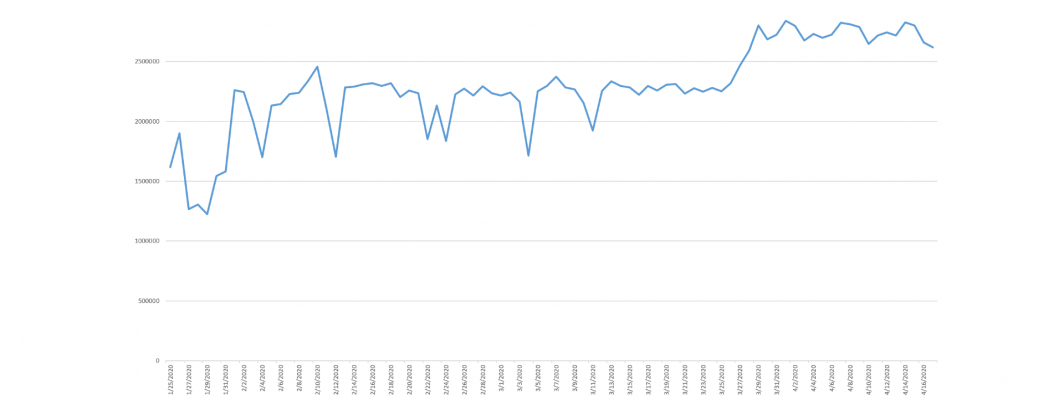
Little Change In Total Daily Words Spoken On CNN During Covid-19
One of the metrics we track in the Visual Global Entity Graph (VGEG) 2.0 using Google's Cloud Video API to analyze…
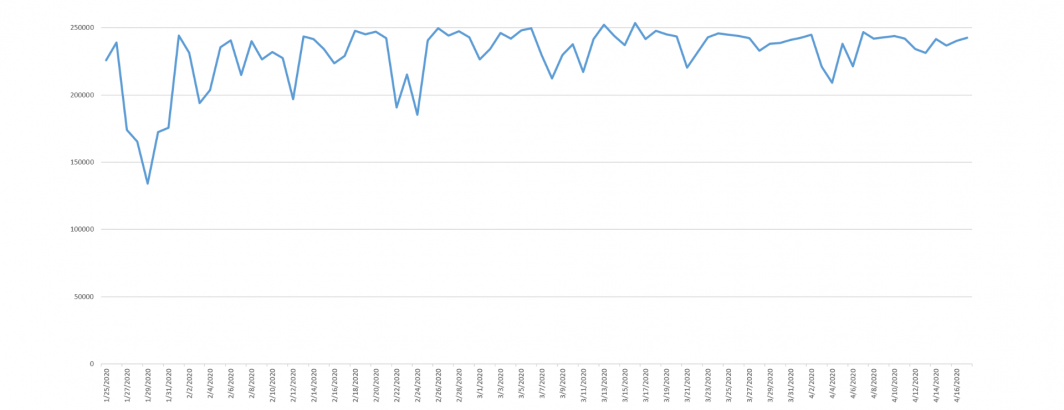
Fewer Speaker Changes On CNN During Covid-19
One of the metrics we track in the Visual Global Entity Graph (VGEG) 2.0 using Google's Cloud Video API to analyze…
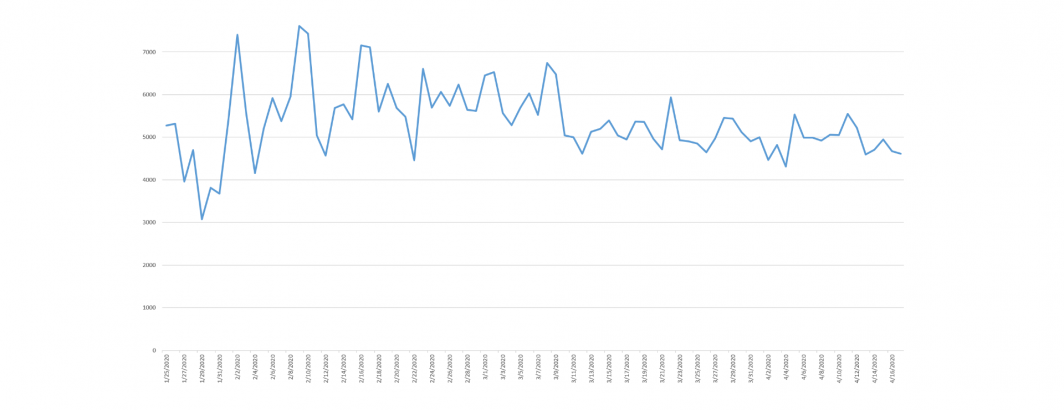
Shot Changes Stabilize On CNN In Covid-19 Era
One of the metrics we track in the Visual Global Entity Graph (VGEG) 2.0 using Google's Cloud Video API to…
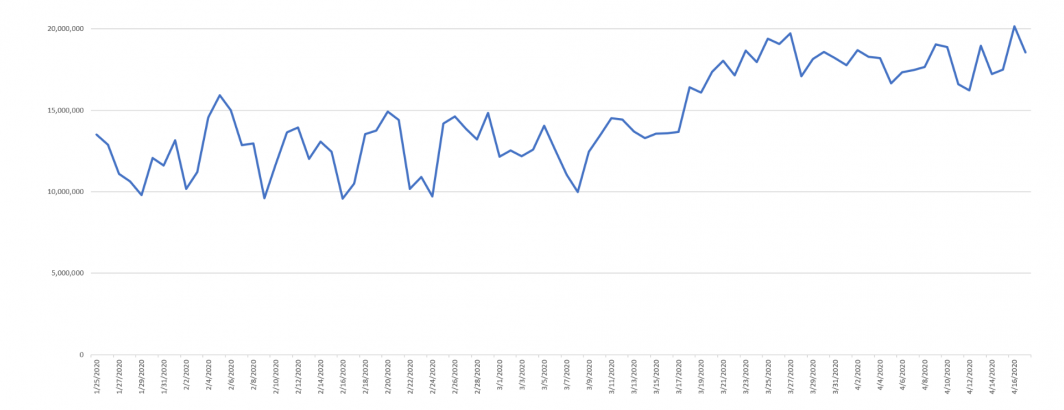
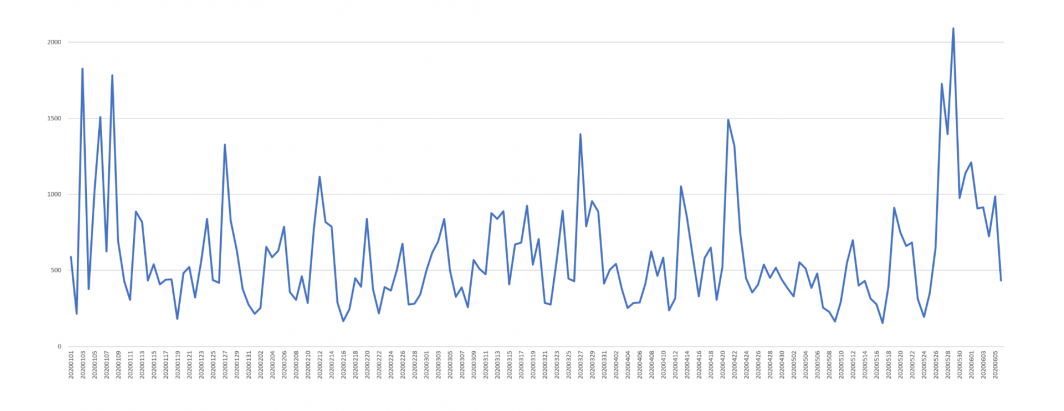
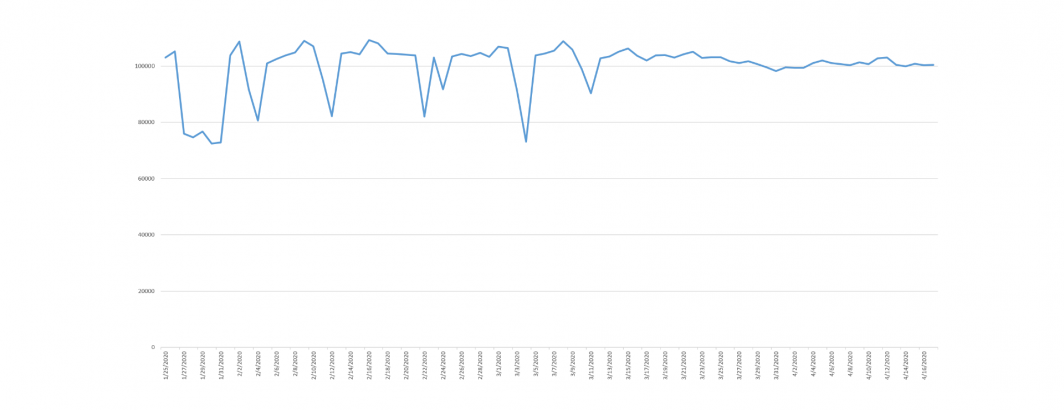
Daily Onscreen Text Increasing In Covid-19 Era
Since January 25th, we've used Google's Cloud Video API to nonconsumptively analyze CNN's daily airtime in collaboration with the Internet…
Tracing "I/Me" Versus "Us/We" Pronoun Use On Television News
Has the election of Donald Trump or the Covid-19 pandemic changed the very pronouns that television news uses? Last year…
Changes In How Television Networks Use The Word "The"
A BBC News article earlier this year noted the power of the word "the" in the English language. This got…
Anxiety-Related Language In Global Online News Continues At High Levels
Two weeks ago we showed that anxiety-related language in global English online news coverage had soared since early February and…
Mapping The Geography Of Angela Merkel Through The Global Geographic Graph
In 2018 we explored the idea of mapping the geography of language by showing the locations most closely associated with…
Announcing The Global Geographic Graph
We are tremendously excited to announce today the debut of the GDELT Global Geographic Graph, the underlying dataset powering the…
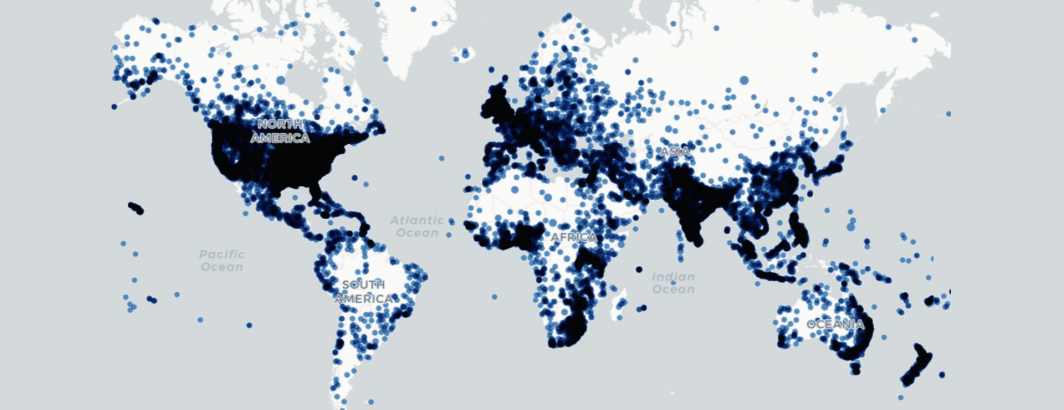
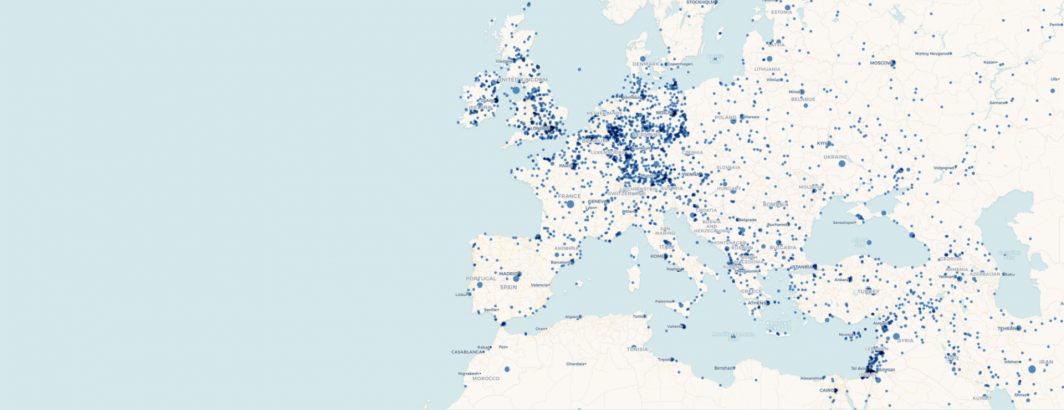
Announcing A Massive New Geographic News Database Of The Locations Mentioned In Covid-19 News Coverage
Last month we created a map of the top locations on earth most commonly mentioned in worldwide online news coverage…
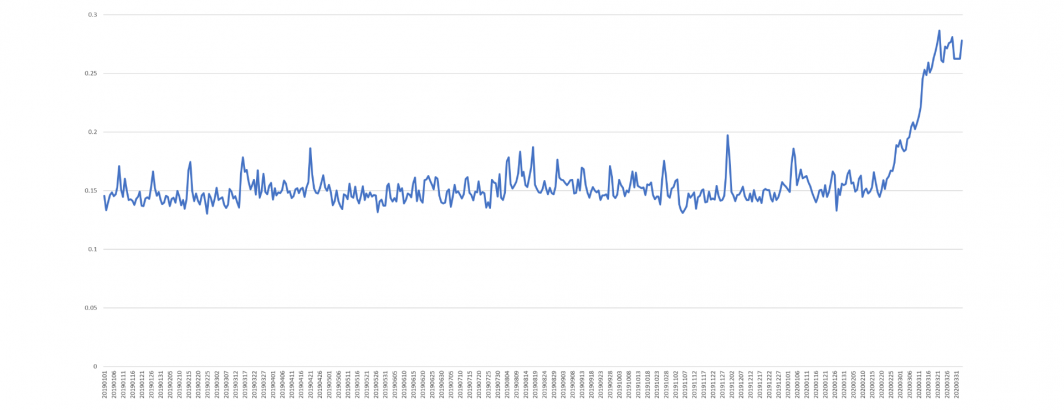
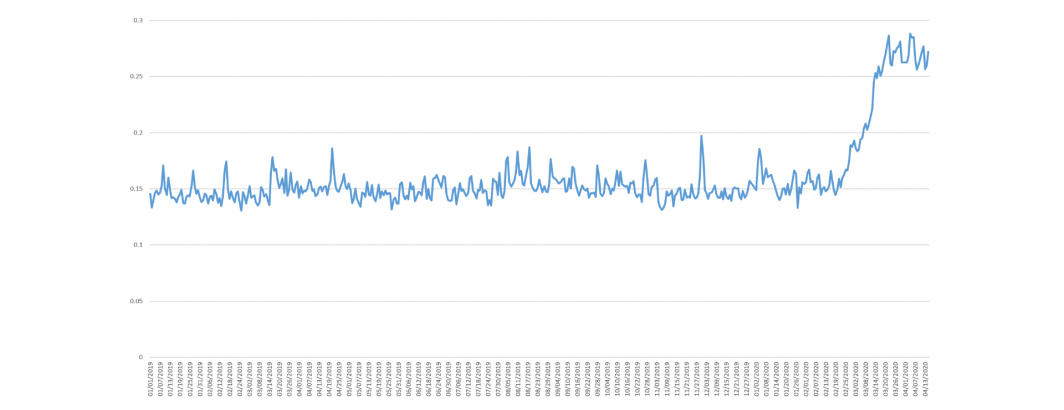
Anxiety-Related Language Soars In Global Online News Since Late February
This past October we showcased using the Web News Ngrams dataset to measure global anxiety using a single BigQuery query…
Visualizing The Entity Graph Around 'Shortages' And Covid-19
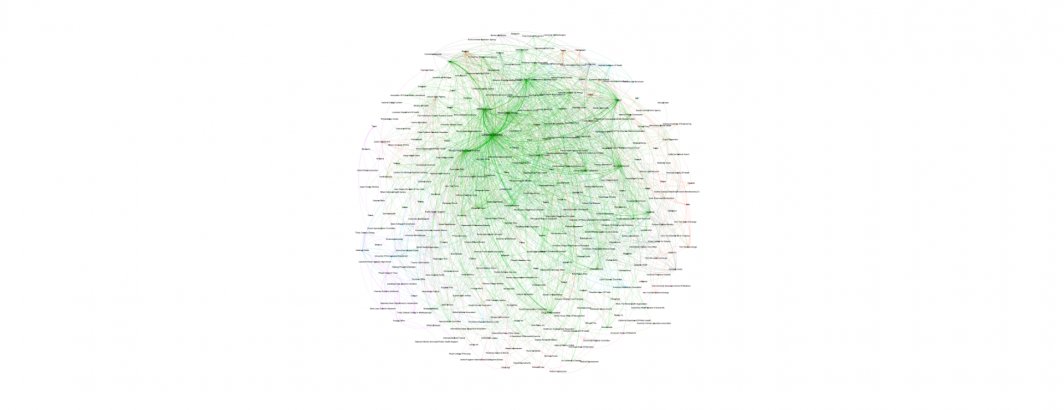
Following the incredible graph BBVA created of co-occurring organization names in Covid-19 coverage, we've constructed the graph below of co-occurring…
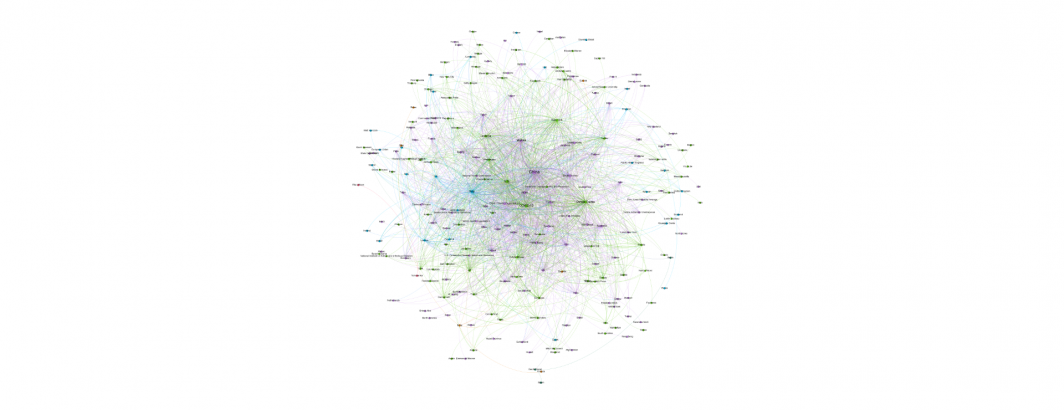
Visualizing Entity Co-Occurrences In Covid-19 Coverage Using The Natural Language API
What might the Global Entity Graph tell us about the co-occurrence network of entities mentioned in coverage of Covid-19, as…
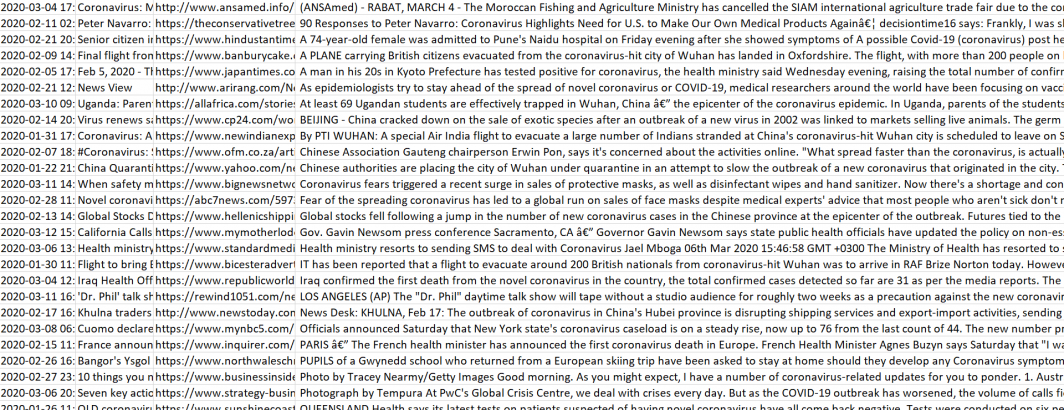
Now Live Updating & Expanded: A New Dataset For Exploring The Coronavirus Narrative In Global Online News
Two weeks ago we released a compilation of URLs and brief snippets of worldwide English language news coverage mentioning Covid-19….