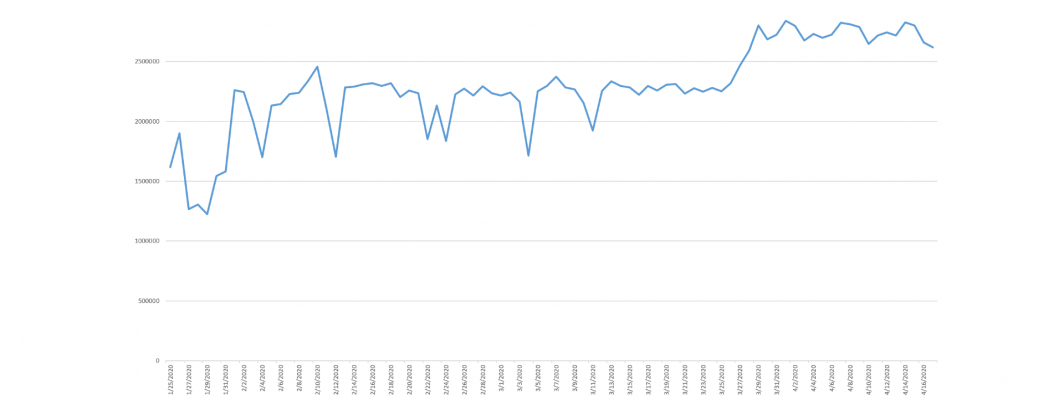
One of the metrics we track in the Visual Global Entity Graph (VGEG) 2.0 using Google's Cloud Video API to analyze CNN's television news programming in collaboration with the Internet Archive's Television News Archive is the list of distinct visual entities (objects and activities) depicted onscreen throughout the day. The timeline below displays the total number of distinct labels-seconds on CNN by day since Jan. 25. In short, it breaks each broadcast into seconds of airtime and for each second of airtime compiles a list of the distinct entities visible during that second and then sums that total per day. Thus, if the same 4 entities are visible each second for 10 seconds of airtime they will be recorded as 40 labels-seconds below.
March 27th appears to be the moment that there is a sharp increase in distinct daily labels-seconds stabilizing on the 29th and continuing at that level since.
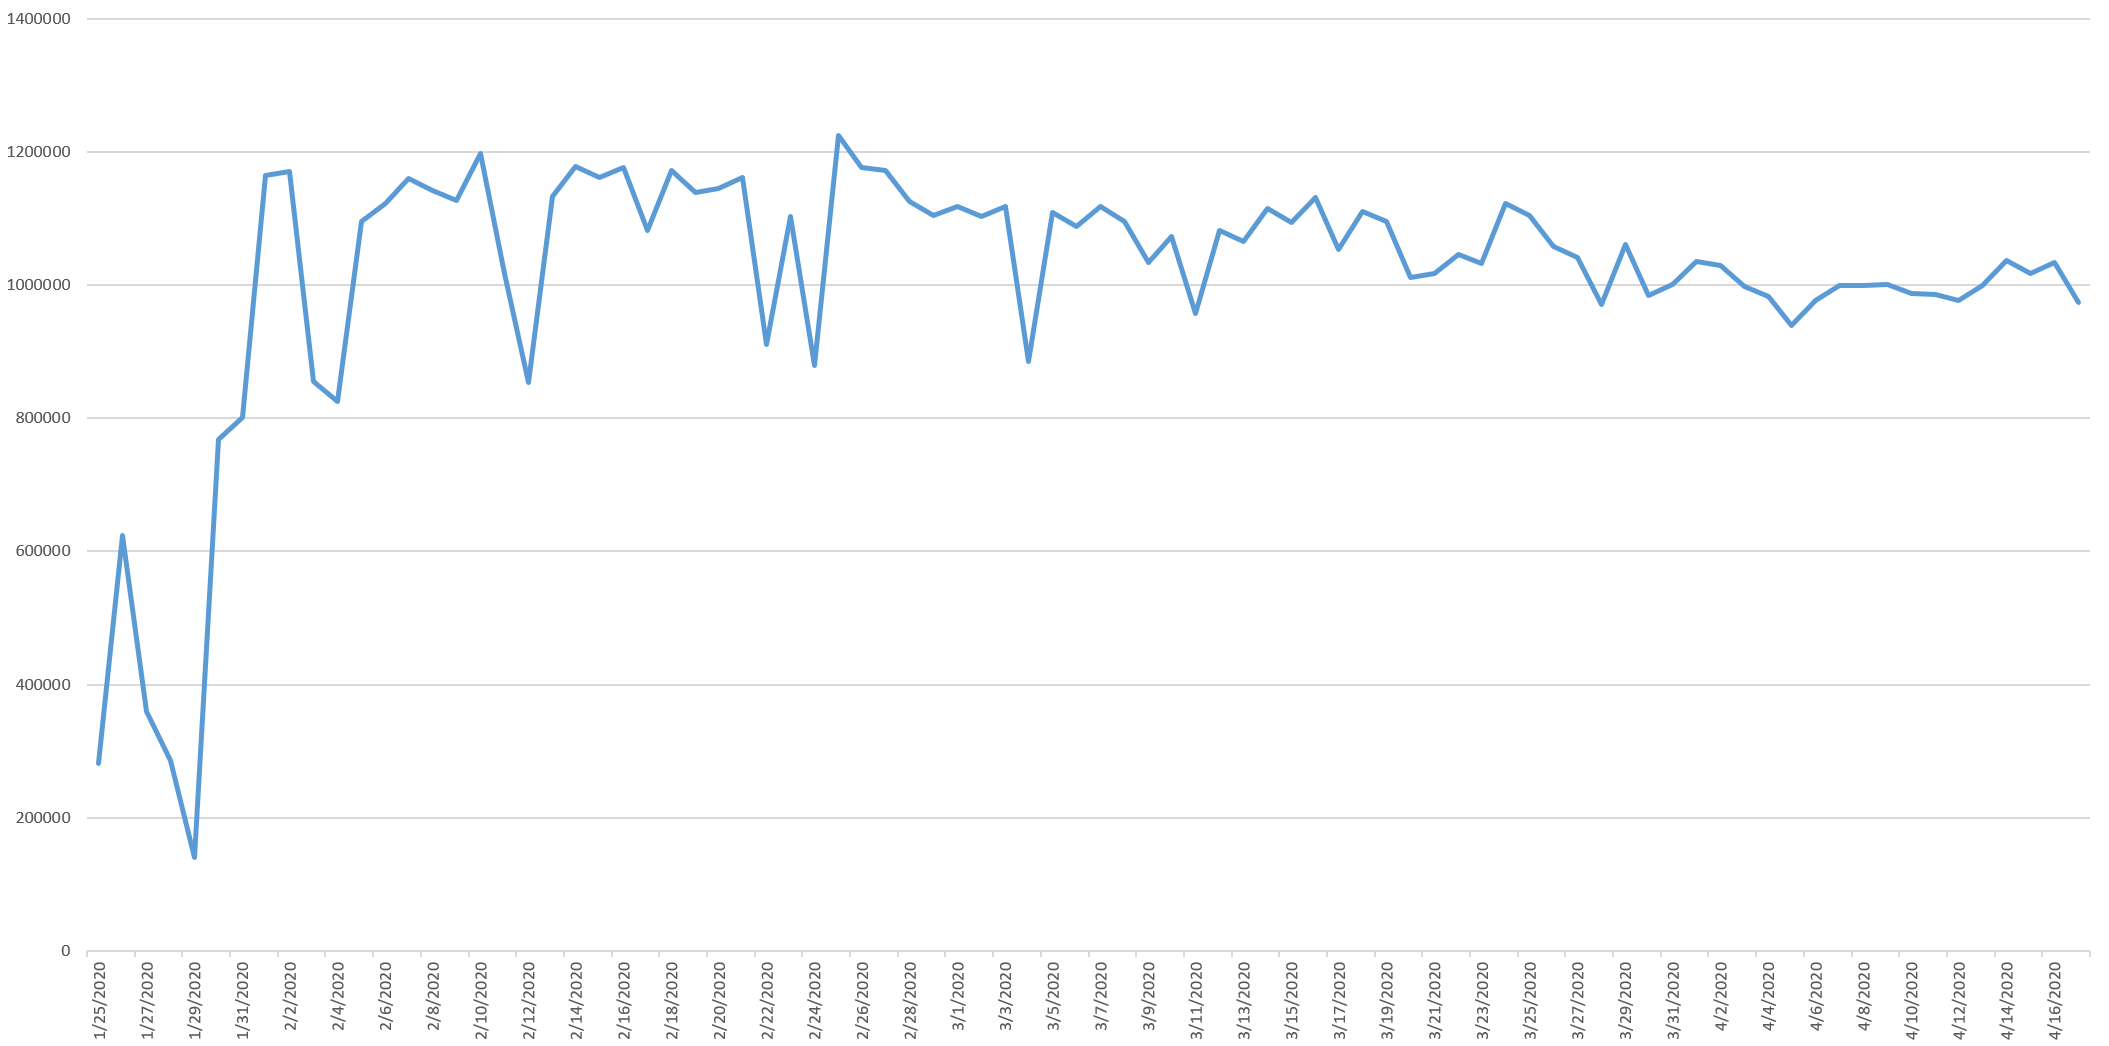
Interestingly, fine-grain labels known as "presence label annotations" that capture "more fine-grained, segment-level labels detected in video content" actually decrease slightly.
TECHNICAL DETAILS
Computing the timeline above took just a single SQL query in BigQuery:
SELECT DATE(date) day, sum( numOCRChars ) ocrcount, sum( numSpeakerChanges ) speakercount, sum( numSpokenWords) totalwords, sum( numDistinctEntities) totalentities, sum( numDistinctPresenceEntities) totalpresenceentities FROM `gdelt-bq.gdeltv2.vgegv2_iatv` WHERE station='CNN' and DATE(date) >= "2020-01-25" group by day order by day asc