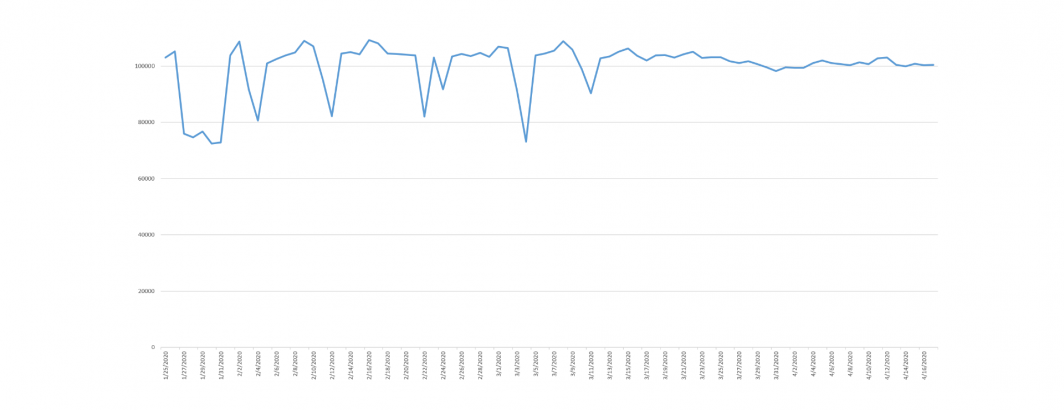
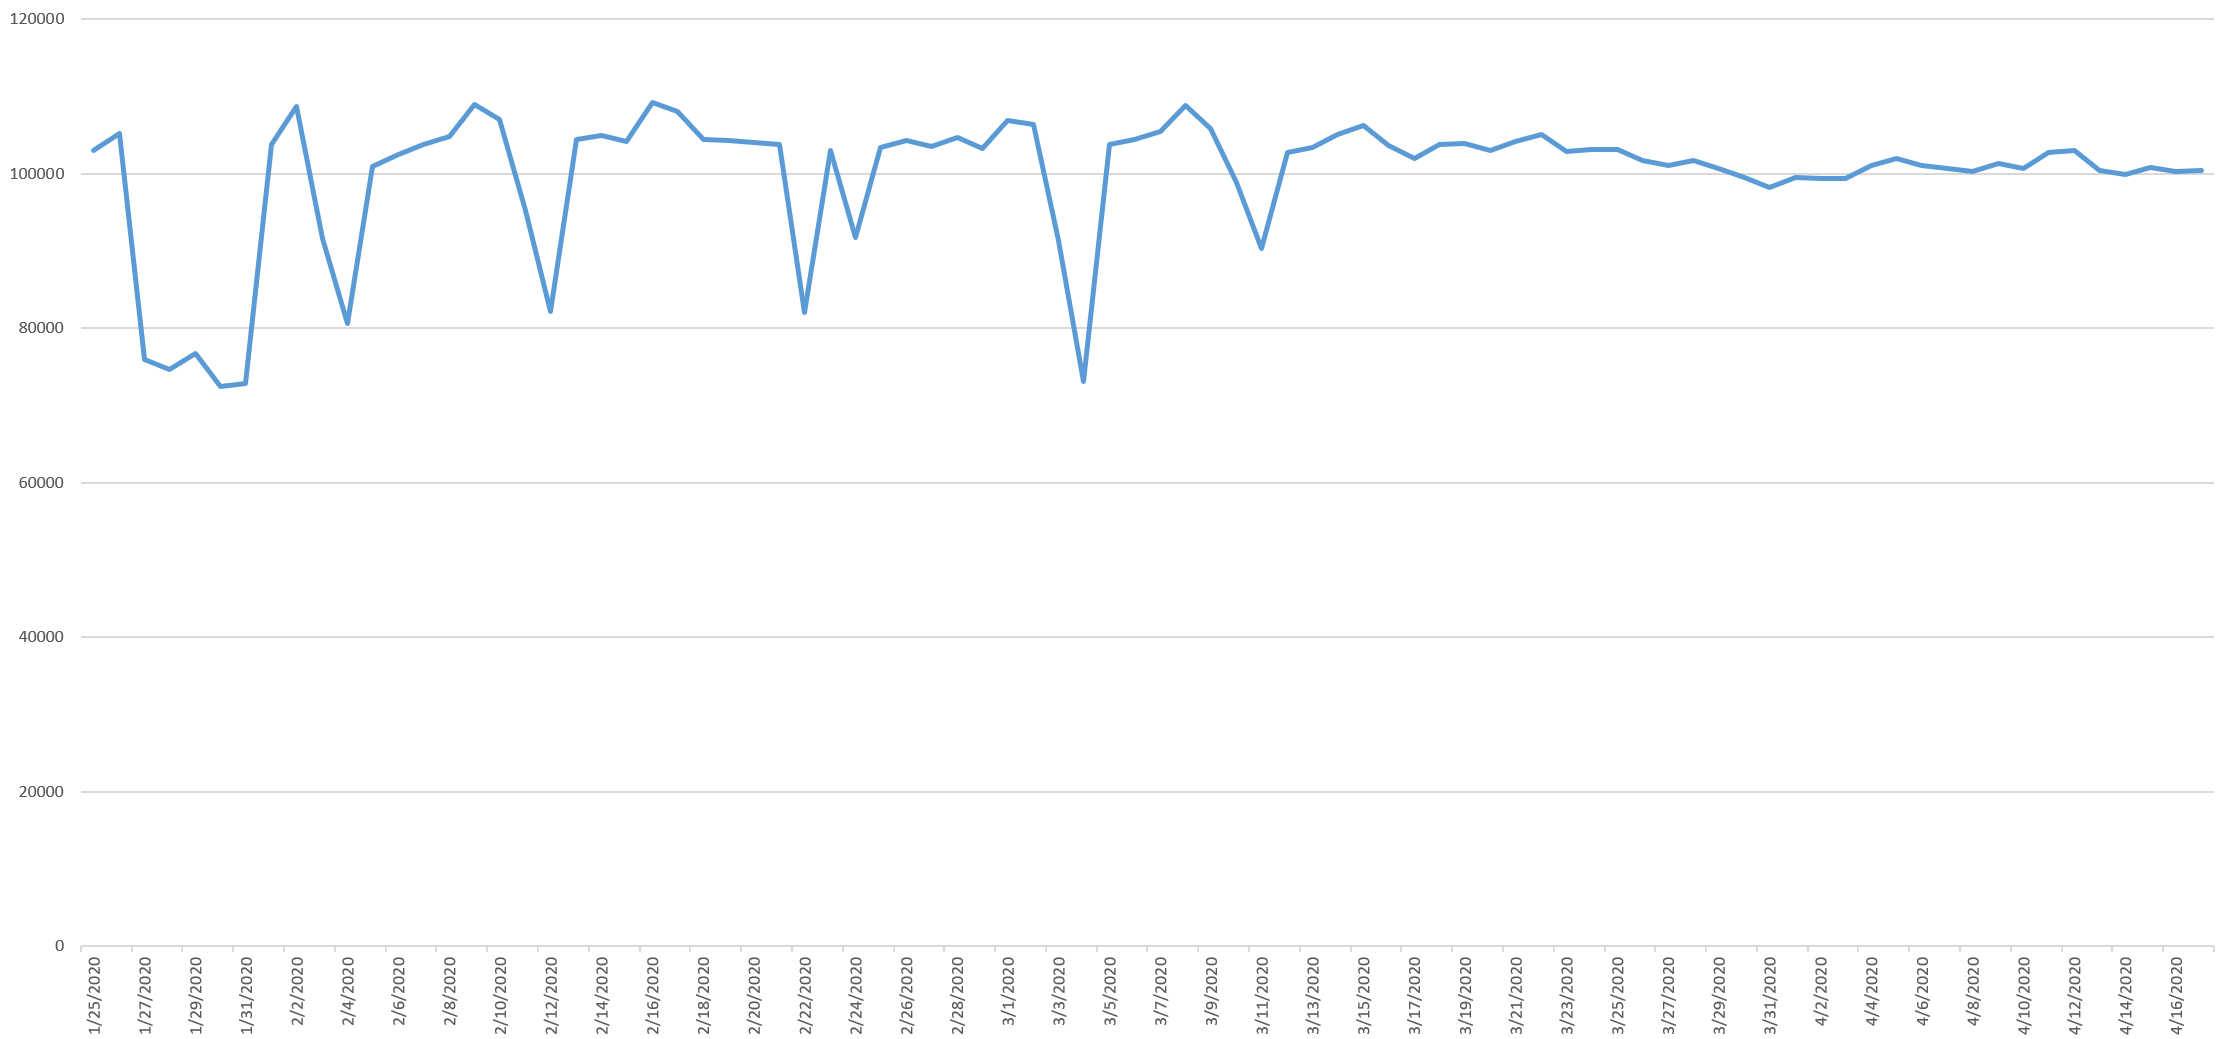
One of the metrics we track in the Visual Global Entity Graph (VGEG) 2.0 using Google's Cloud Video API to analyze CNN's television news programming in collaboration with the Internet Archive's Television News Archive is the number of camera or "shot" changes throughout the day. Since we started analyzing CNN on January 25th, the station tends to ebb and flow, with an average (ignoring the dips) of around 103K camera changes per day. Since March 12th, however, there have been no days with reduced numbers of camera changes and remarkable stability, decreasing from around 103K changes per day 100K per day on March 30th where it has largely remained through present. In all, since March 12th there have been no days of reduced camera change counts.
TECHNICAL DETAILS
Constructing the timeline above took just a single line of SQL in BigQuery:
SELECT DATE(date) day, sum( numShotChanges ) count FROM `gdelt-bq.gdeltv2.vgegv2_iatv` WHERE station='CNN' and DATE(date) >= "2020-01-25" group by day order by day asc