Since January 25th, we've used Google's Cloud Video API to nonconsumptively analyze CNN's daily airtime in collaboration with the Internet Archive's Television News Archive, creating the Visual Global Entity Graph (VGEG) 2.0. One of the measures we analyze is the total amount of onscreen text during each second of airtime. In an era of onscreen infographics and hours and hours of onscreen statistics, how has the total amount of onscreen text changed?
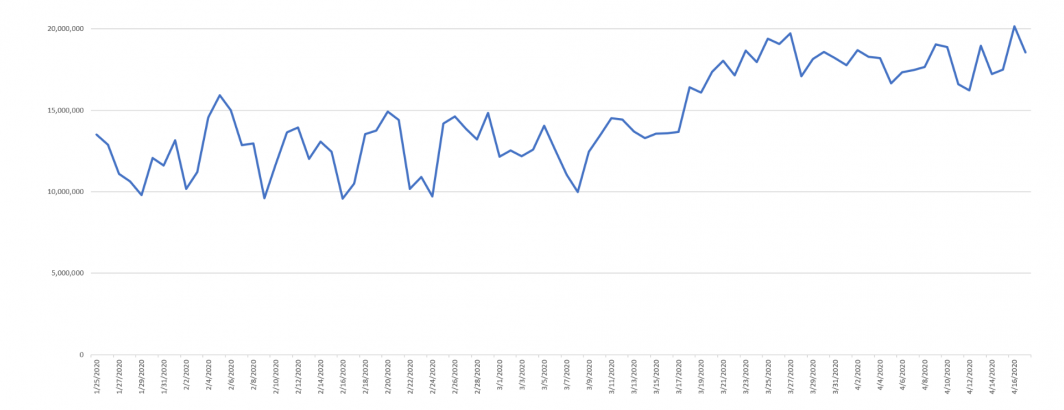
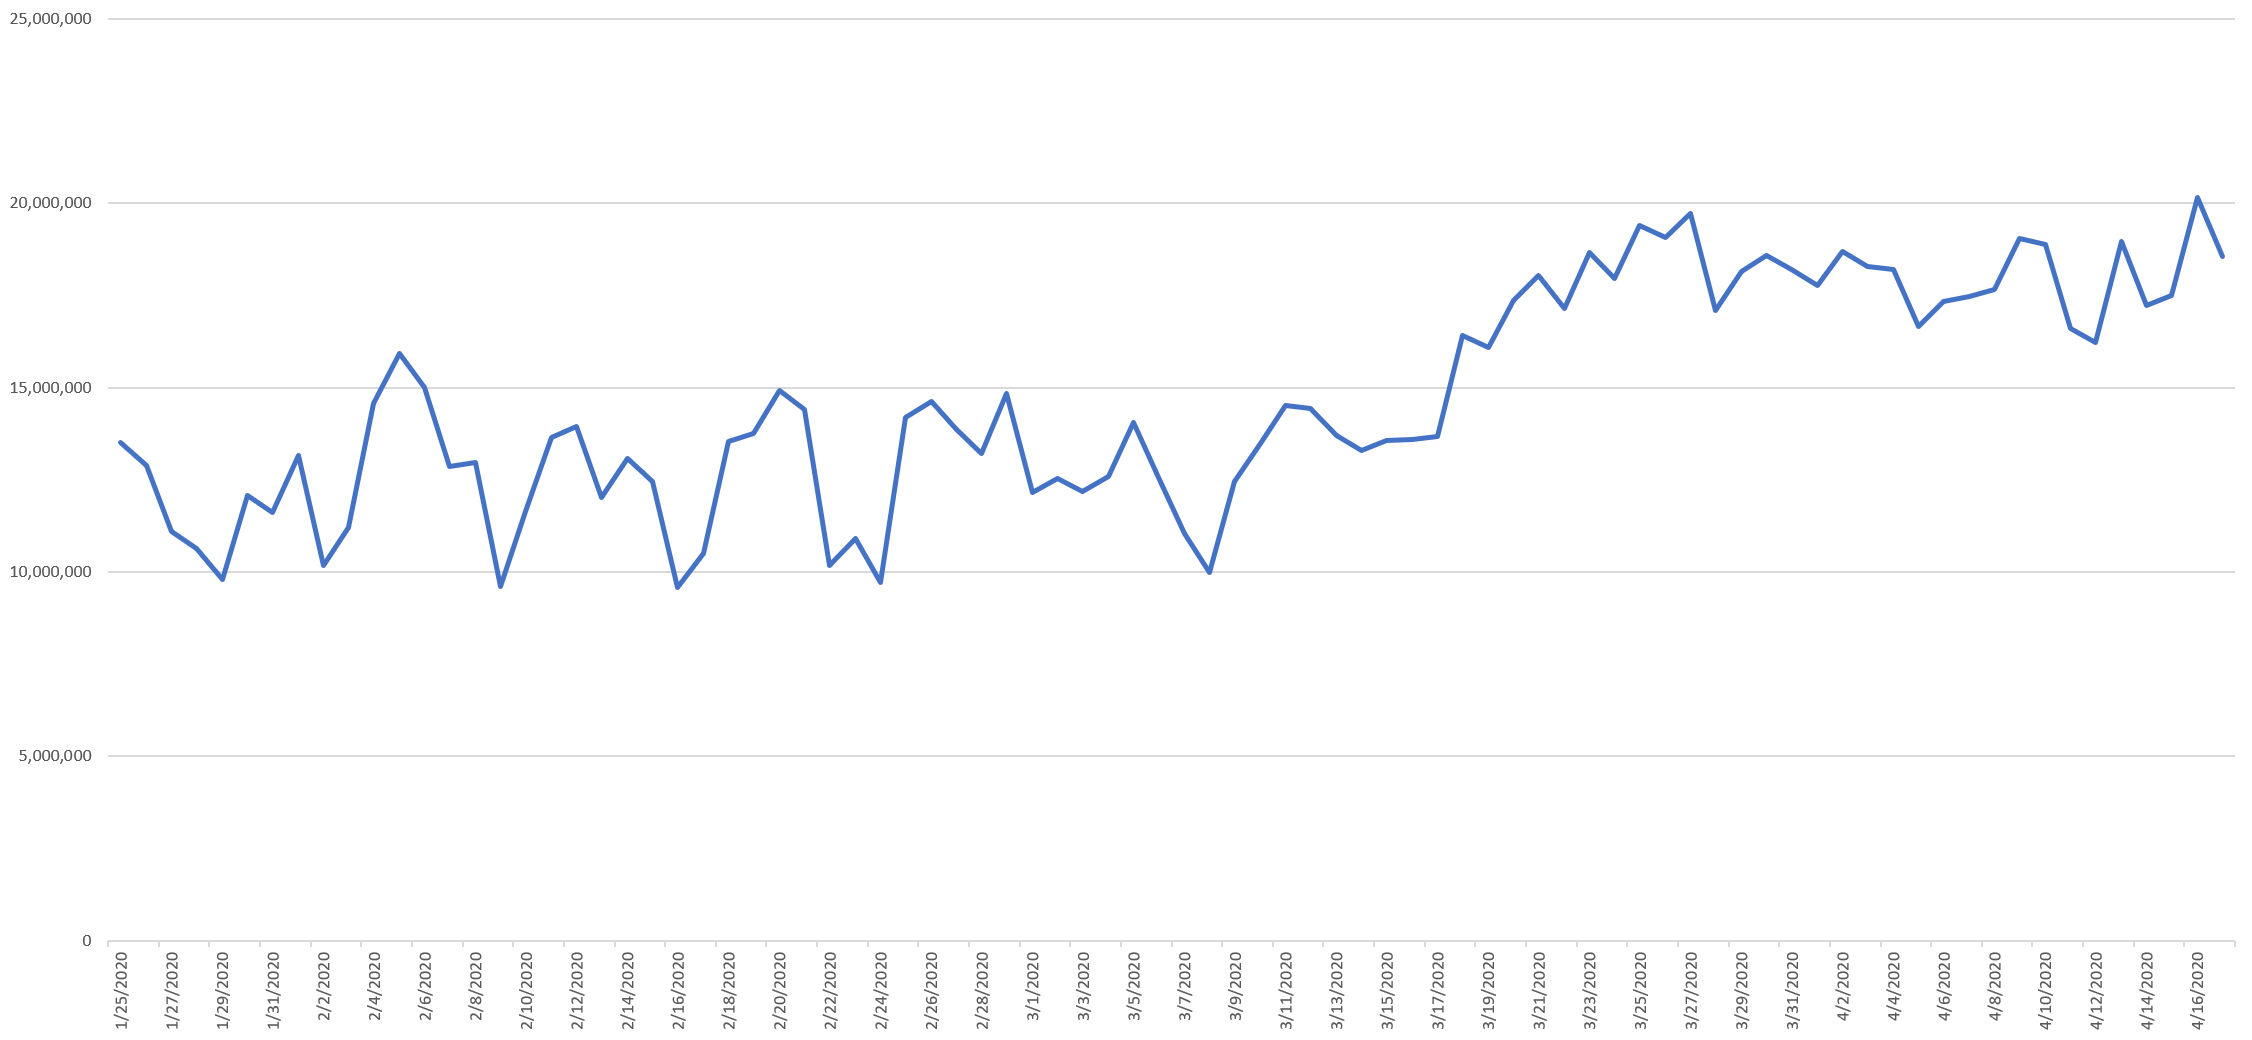
The timeline below shows the total number of characters of onscreen text per day on CNN since Jan. 25th of this year. March 13th marks the inflection point at which text volume starts to increase, with March 18th representing a huge surge in onscreen text through March 27th and continuing through present. On a typical day in late January there were around 12 million characters onscreen every day, compared with around 18.6 million since late March.
TECHNICAL DETAILS
Computing the graph above took just a single line in SQL in BigQuery:
SELECT DATE(date) day, sum(length(OCRText)) ocrlen FROM `gdelt-bq.gdeltv2.vgegv2_iatv` WHERE station='CNN' and DATE(date) >= "2020-01-25" group by day order by day asc