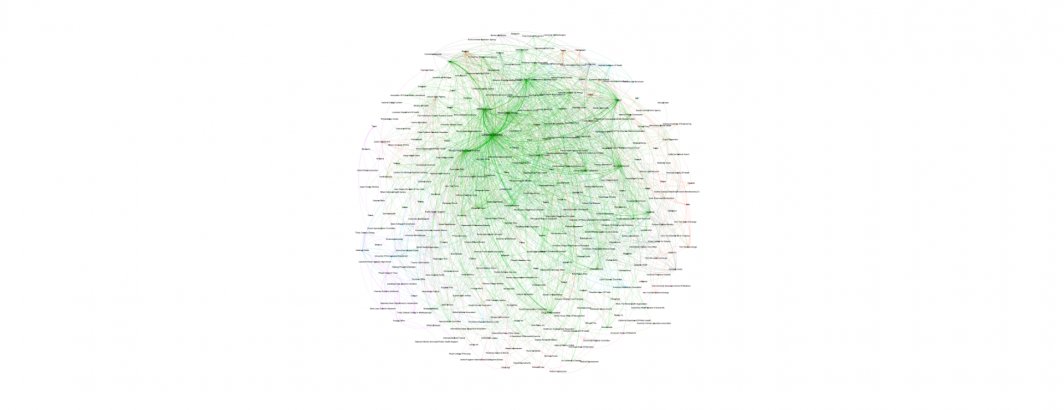
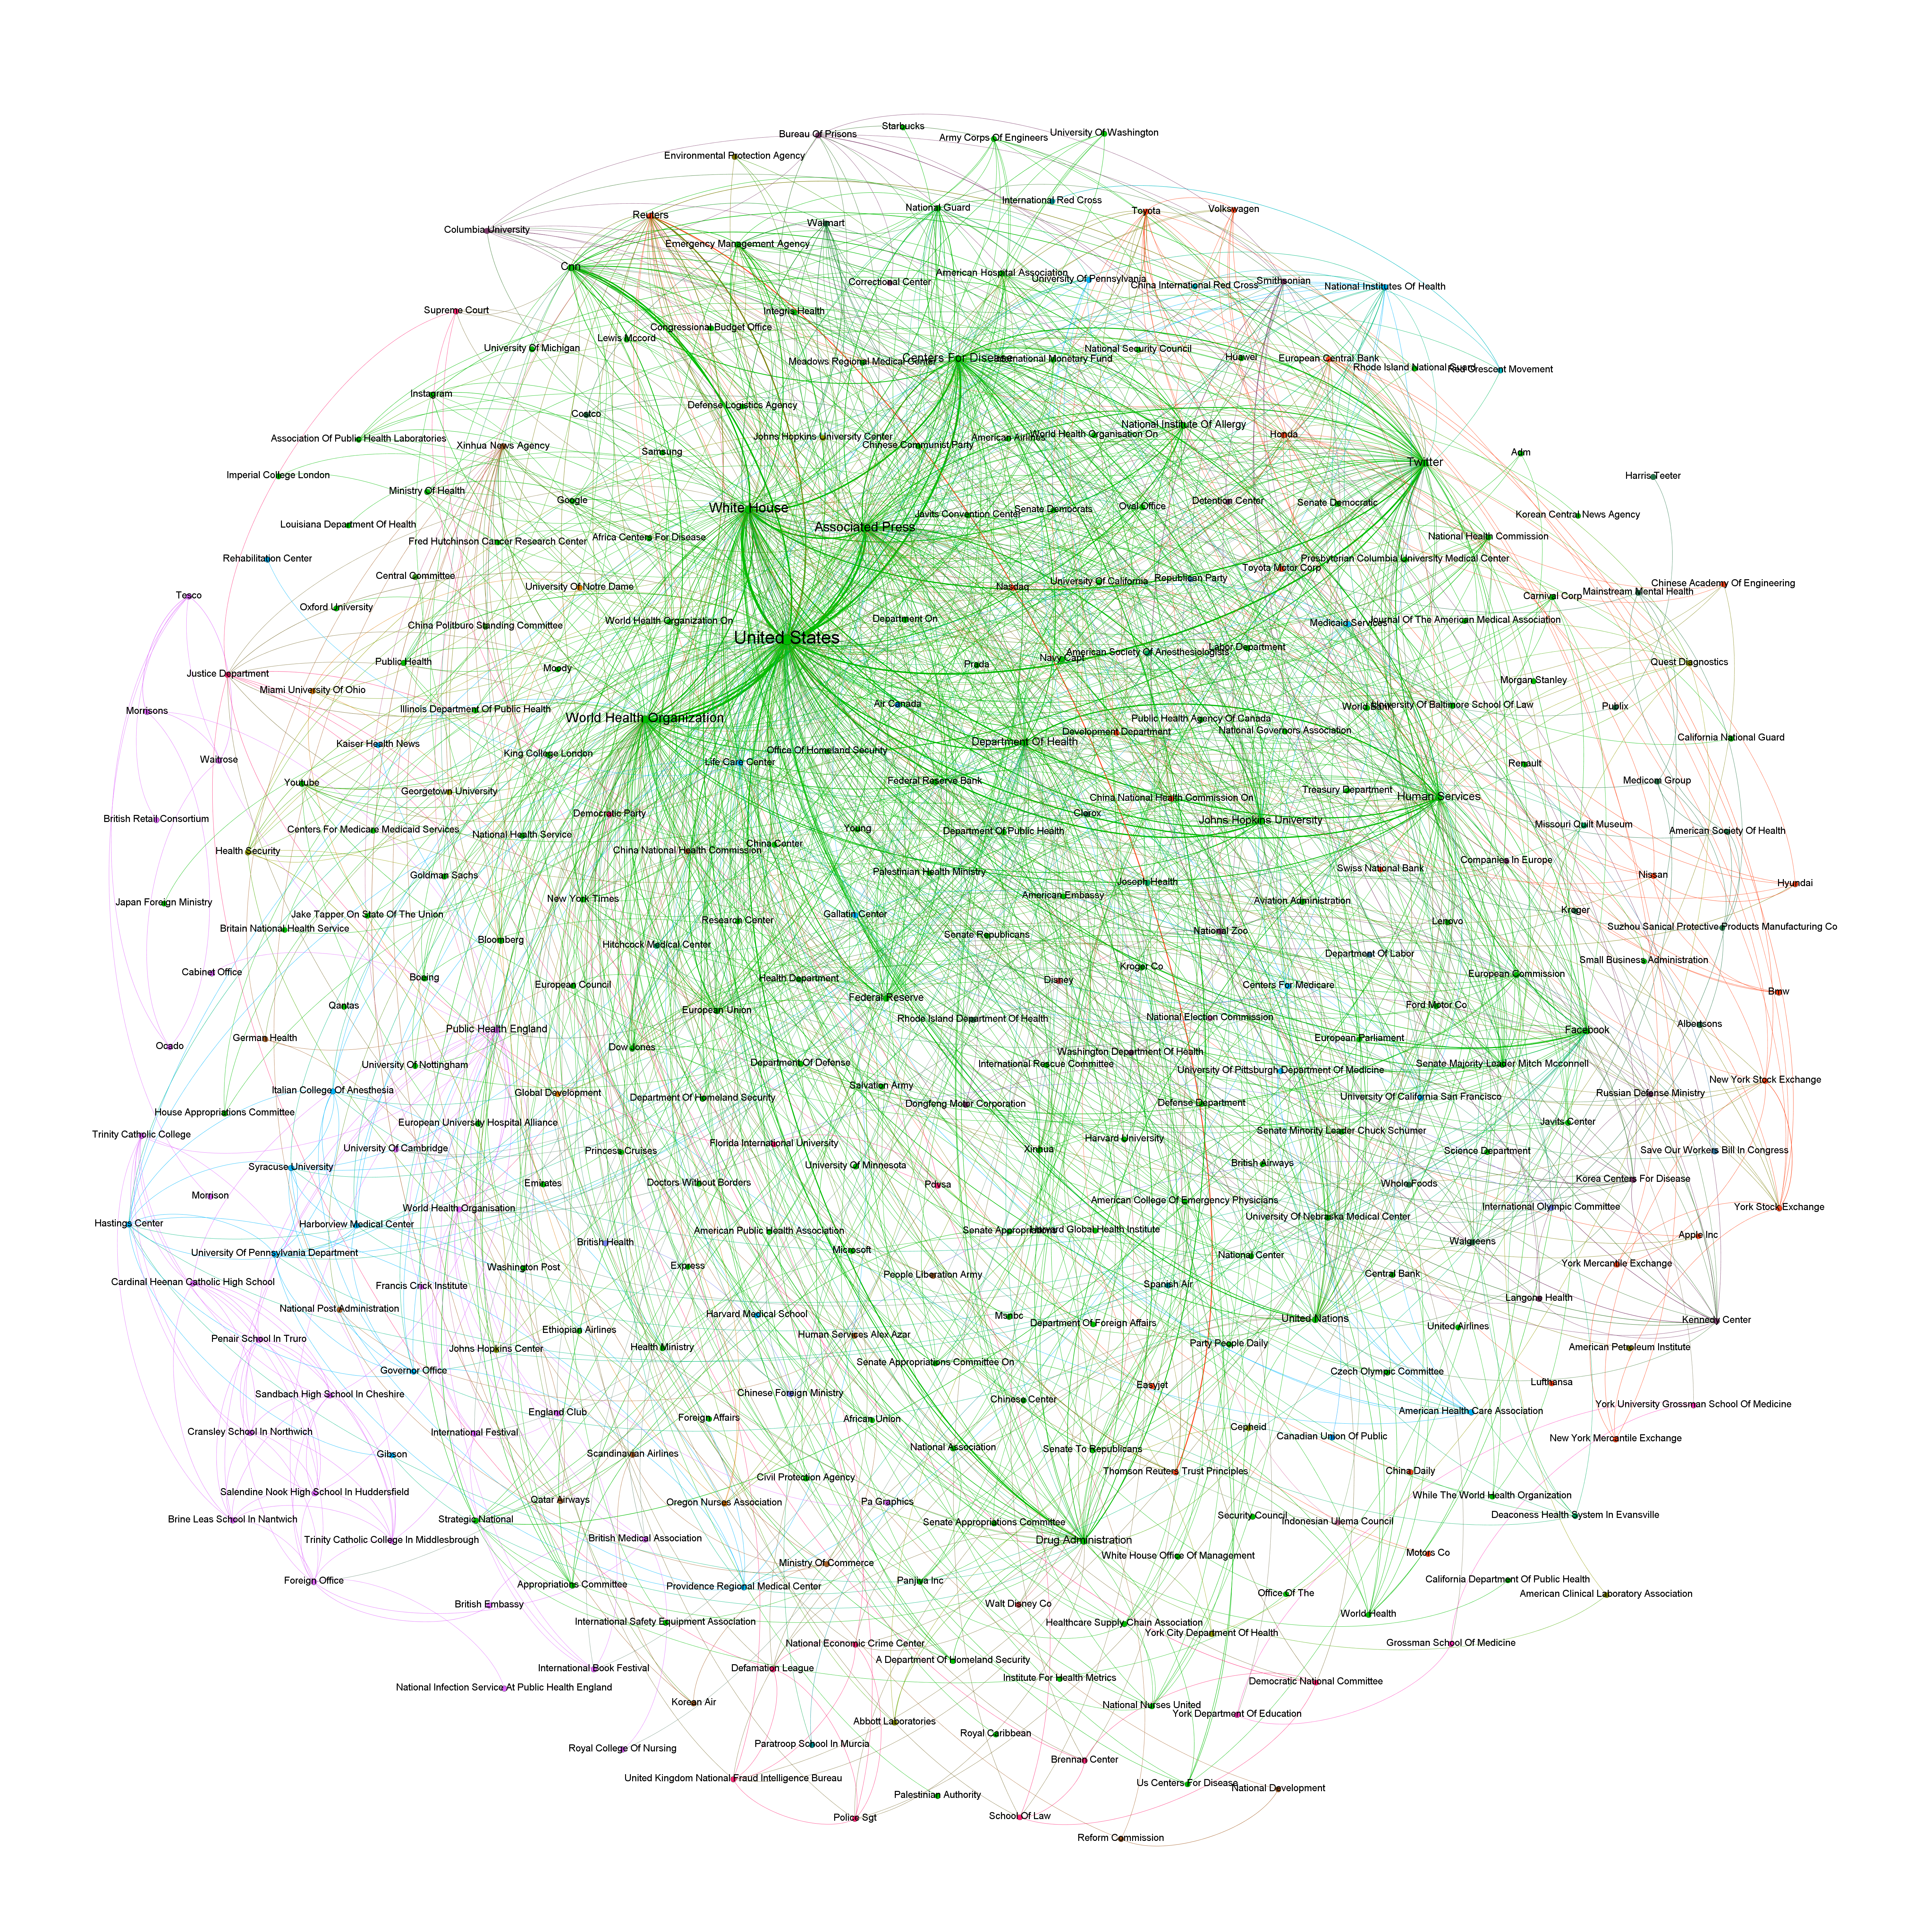
Following the incredible graph BBVA created of co-occurring organization names in Covid-19 coverage, we've constructed the graph below of co-occurring organizations mentioned in Covid-19 coverage that also mentioned the V2Theme of "SHORTAGES."
TECHNICAL DETAILS
Constructing this graph required just the single query in BigQuery and was visualized using Gephi.
SELECT Source, Target, Count RawCount, "Undirected" Type, ( Count/SUM(Count) OVER () ) Weight FROM (
SELECT a.entity Source, b.entity Target, COUNT(*) as Count
FROM (
 (SELECT DocumentIdentifier url, entity FROM `gdelt-bq.gdeltv2.gkg_partitioned`, UNNEST(SPLIT(REGEXP_REPLACE(V2Organizations, r',\d+', ''),';')) AS entity WHERE V2Themes like '%VIRUS%' and V2Themes like '%SHORTAG%' and DATE(_PARTITIONTIME) >= "2020-01-01" group by url,entity)
) a
JOIN (
 (SELECT DocumentIdentifier url, entity FROM `gdelt-bq.gdeltv2.gkg_partitioned`, UNNEST(SPLIT(REGEXP_REPLACE(V2Organizations, r',\d+', ''),';')) AS entity WHERE V2Themes like '%VIRUS%' and V2Themes like '%SHORTAG%' and DATE(_PARTITIONTIME) >= "2020-01-01" group by url,entity)
) b
ON a.url=b.url
WHERE a.entity<b.entity
GROUP BY 1,2
ORDER BY 3 DESC
LIMIT 1500
)
order by Count Desc