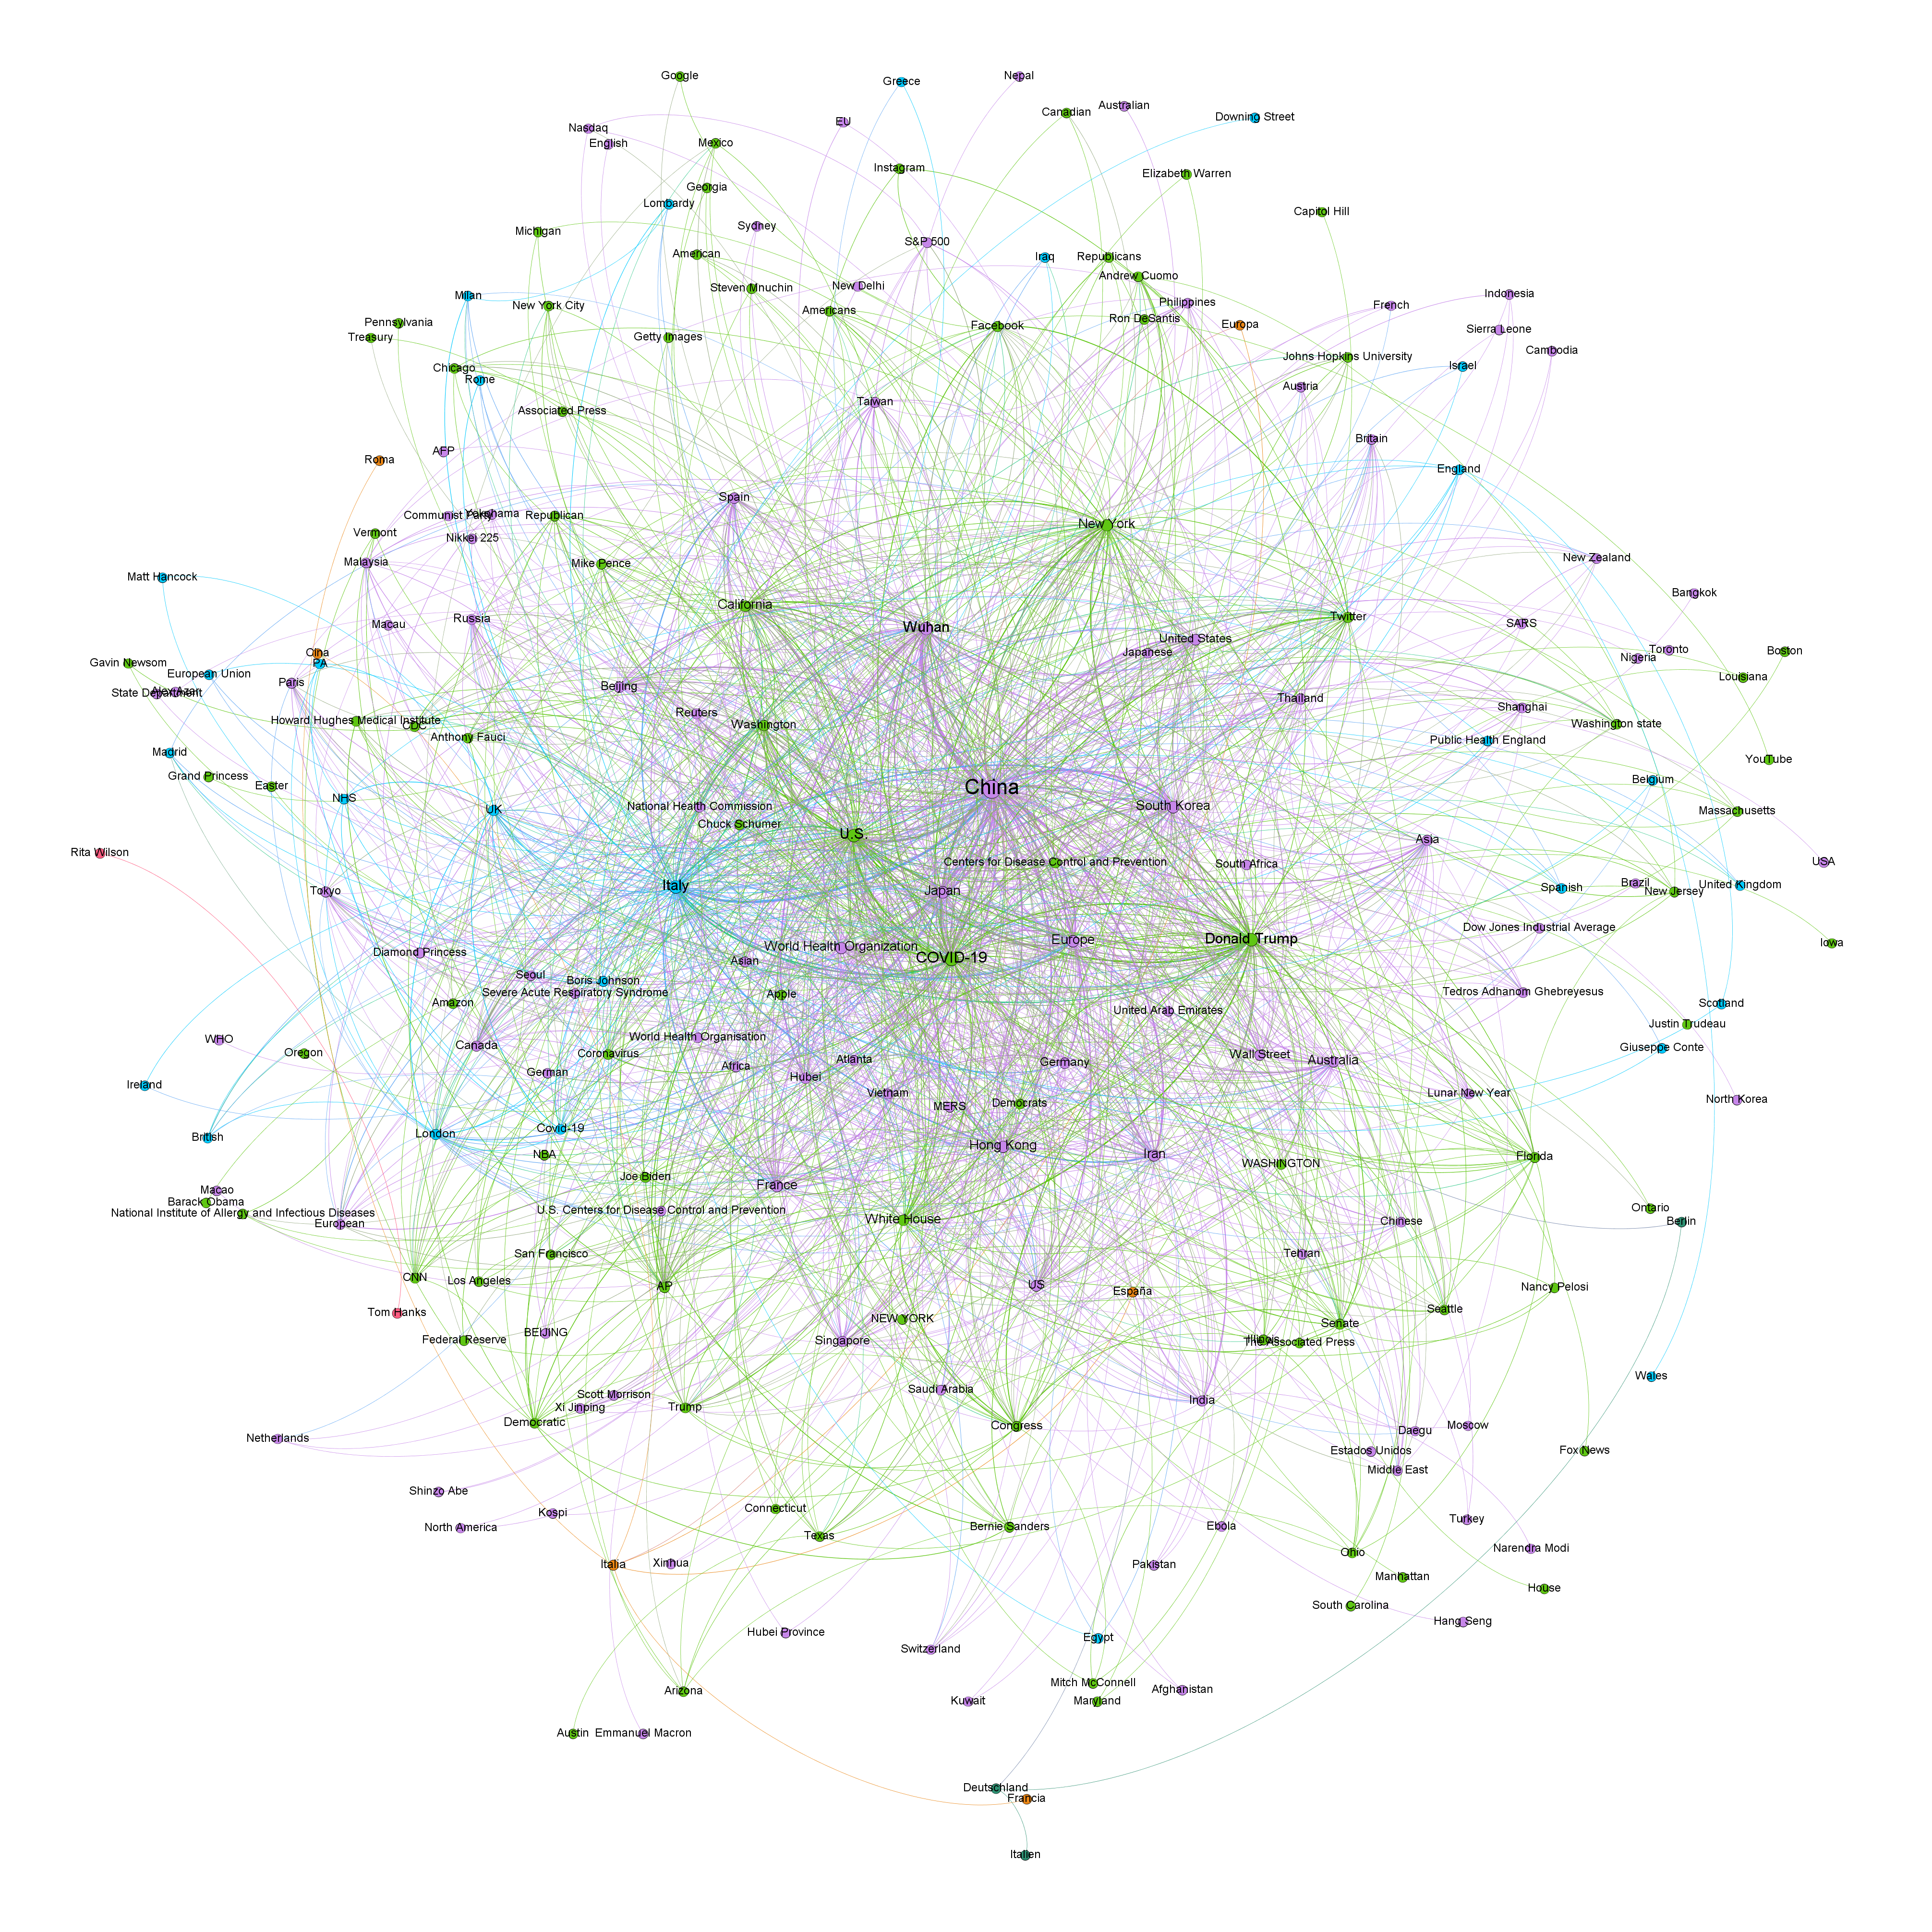
What might the Global Entity Graph tell us about the co-occurrence network of entities mentioned in coverage of Covid-19, as extracted by the Cloud Natural Language API? To explore this, we queried for all entities mentioning "virus" or "infect*" or "Covid*" and then compiled the list of the top 1,500 co-occurring entities from those documents and rendered in Gephi, as seen in the final image below. In this case we limited only to entities with assigned MID codes.
TECHNICAL DETAILS
The final BigQuery query can be seen below.
SELECT Source, Target, Count RawCount, "Undirected" Type, ( Count/SUM(Count) OVER () ) Weight FROM (
SELECT a.entity Source, b.entity Target, COUNT(*) as Count
FROM (
 (SELECT url, entities.name entity FROM `gdelt-bq.gdeltv2.geg_gcnlapi`, unnest(entities) entities where entities.mid is not null and url in
   (SELECT url FROM `gdelt-bq.gdeltv2.geg_gcnlapi`, unnest(entities) entity WHERE (entity.name like '%virus%' OR entity.name like '%infect%'  OR entity.name like '%covid%') and DATE(date) >= "2020-01-01")
 )
) a
JOIN (
 (SELECT url, entities.name entity FROM `gdelt-bq.gdeltv2.geg_gcnlapi`, unnest(entities) entities where entities.mid is not null and url in
   (SELECT url FROM `gdelt-bq.gdeltv2.geg_gcnlapi`, unnest(entities) entity WHERE (entity.name like '%virus%' OR entity.name like '%infect%'  OR entity.name like '%covid%') and DATE(date) >= "2020-01-01")
 )
) b
ON a.url=b.url
WHERE a.entity<b.entity
GROUP BY 1,2
ORDER BY 3 DESC
LIMIT 1500
)
order by Count Desc