Search Results for: bigquery
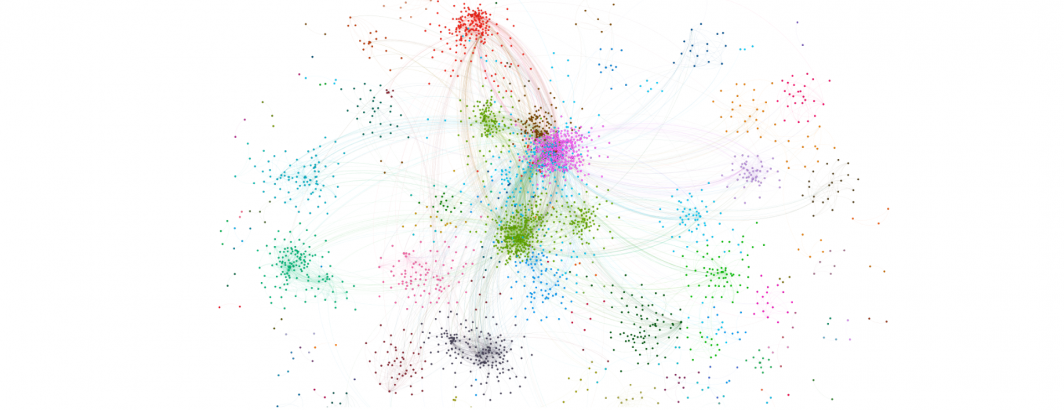
Visualizing The Network Of Image Sharing Across The Global News Landscape
Each image in the Visual Global Knowledge Graph (VGKG) is analyzed by Google Cloud Vision API's "WebEntities" that performs the…

A Compilation Of All EXIF Tags In The Visual Global Knowledge Graph In 2020
Since its launch in December 2015, the Visual Global Knowledge Graph (VGKG) has analyzed more than 600 million images from…

Global Relationship Graph: Realtime Verb-Centered NGram Pilot
This past July we debuted the Global Relationship Graph (GRG), an experimental new initiative in codifying the factual claims and relationships made…
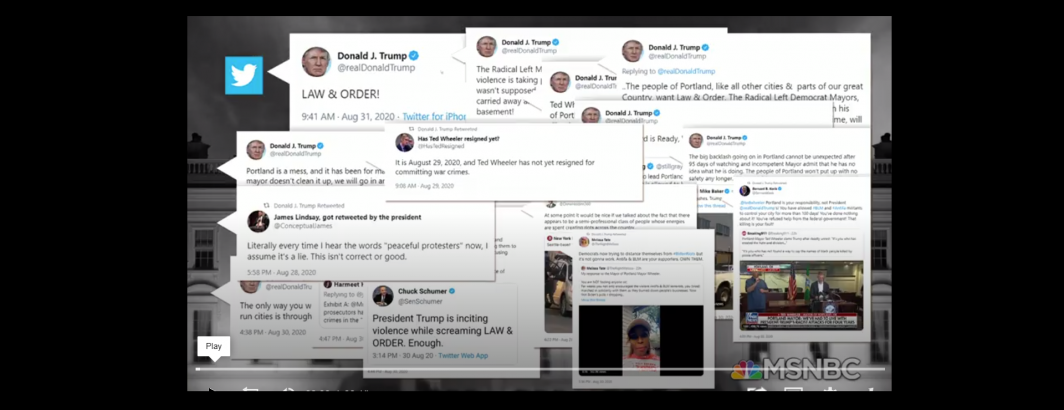
Keyword Searching Television News Trump Tweet Appearances
Last week we released an aligned dataset of Trump tweets appearing on television news using the Visual Global Entity Graph 2.0…
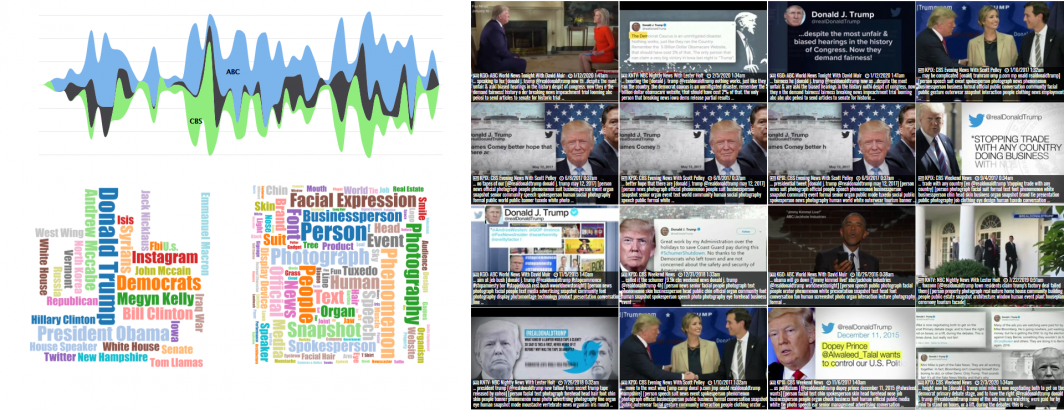
Visualizing A Year Of Trump's Television Tweets
What would it look like to take all 139,450 seconds of airtime across from Jan. 1 of this year through…

Announcing The Radio News Ngram Dataset
UPDATE (9/26/2020): The Radio News NGram dataset has been massively expanded! This past June we unveiled the Television News Ngram 2.0…

EWA2020: Reimagining Web Archiving As A Realtime Global Open Research Platform: The GDELT Project
Kalev will be speaking at the inaugural Engaging With Web Archives (EWA) 2020 conference, held at the National University of…
Compiling A List Of Social Media Handles On Television News
What are the most common social media handles that have appeared on television news this year? Using a simple regular…
Quantifying The COVID-19 Public Health Media Narrative Through TV & Radio News Analysis
We are tremendously excited to announce that the Media-Data Research Consortium (M-DRC), whom GDELT has been working closely with to…
Announcing The Global Relationship Graph
One of the great "grand challenges" of the field of natural language understanding lies in teaching machines to truly understand…
Using The Global Frontpage Graph To Trace Homepage Links Mentioning "Masks"
Using a single query in BigQuery it is trivial to process the complete 208-billion-link Global Frontpage Graph to examine how…
Compiling A Massive Multilingual News-Based Stopword List
UPDATE (7/10/2020): Covid-19 has so dominated news coverage of the past half-year that "coronavirus" and "Covid-19" appear in some of…
Building Your Own Home Video Recording & Production Studio: Behind The Scenes Of Our New GDELT Tutorials!
With the third video in our new GDELT Tutorial series launching this past weekend, we now have tutorials for Television…
Starting Points For Using GDELT To Understand Environmental & Wildlife Issues From Climate Change To Poaching
GDELT has long been used to understand environmental issues, from early work around climatic change to our well-known 2015 map…
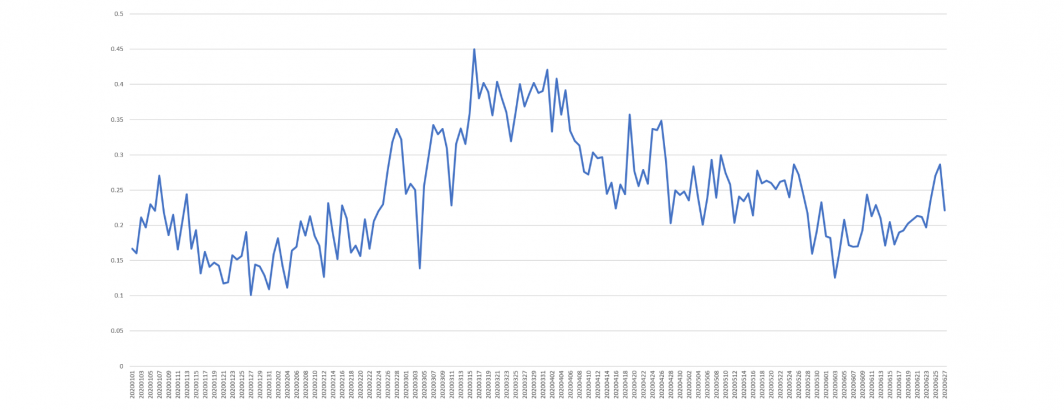
Anxiety On The Rise Again On Television News
The timeline below uses Colin Martindale's Regressive Imagery Dictionary (RID) "anxiety" measure to assess the intensity of anxiety on CNN…
Running The 'Trump Is' Analysis At Scale Using The TV News Ngrams 2.0
This past November we unveiled a fascinating look at how Donald Trump has been framed in the media since he…

A 3.5 Year 634-Million Article Historical Backfile For The Extended Moral Foundation Dictionary
We announced yesterday that the Extended Moral Foundation Dictionary was now a part of GCAM and being applied to all…
Using Television News Ngrams To Expand Query Search Terms & Catch Misspellings
This past April, Tara Reade's name surged into the media as she accused presidential candidate Joe Biden of sexual assault….
Announcing The Television News Ngram 2.0 Dataset
Last year we unveiled the television news ngram dataset, a compilation of 30-minute word frequency histogram tables of unigrams and…
Trump's Tweets Capture Media Attention Again After Fading From Prominence
Last fall we looked at how often Donald Trump's tweets had been cited in the world's news media from 2016…
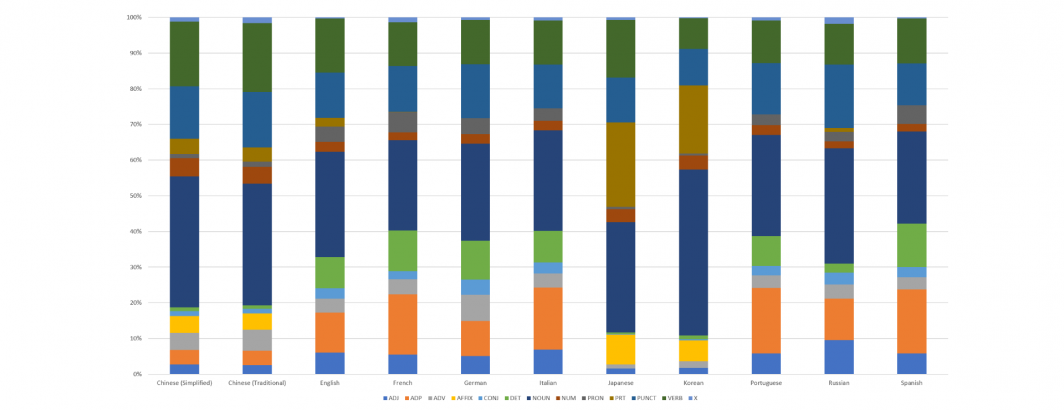
A Four-Month Look At Part Of Speech Distribution In A Multilingual World
In January, we visualized one week's worth of the part of speech distribution of the 11 languages annotated by Google's…
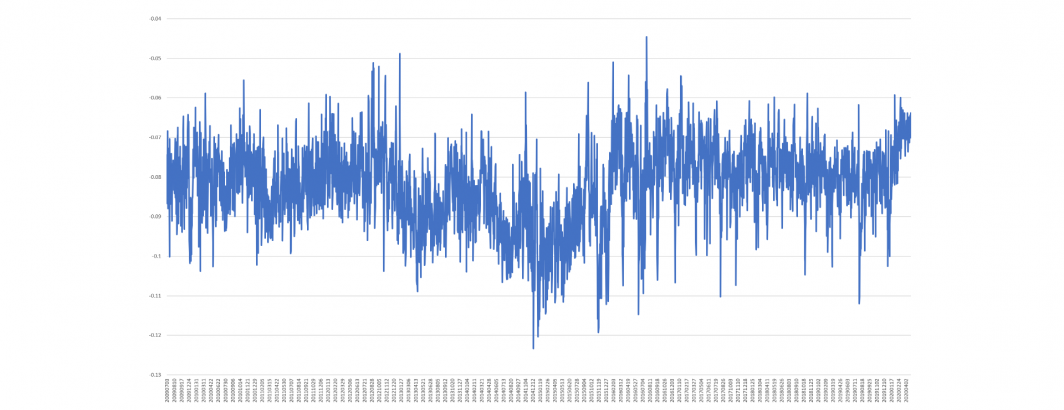
A Decade Of Extended Moral Foundations Dictionary (eMFD) Scores For Television News
With a single SQL query and the Television News Ngram Dataset, its possible to run large-scale macro emotional assessments of…
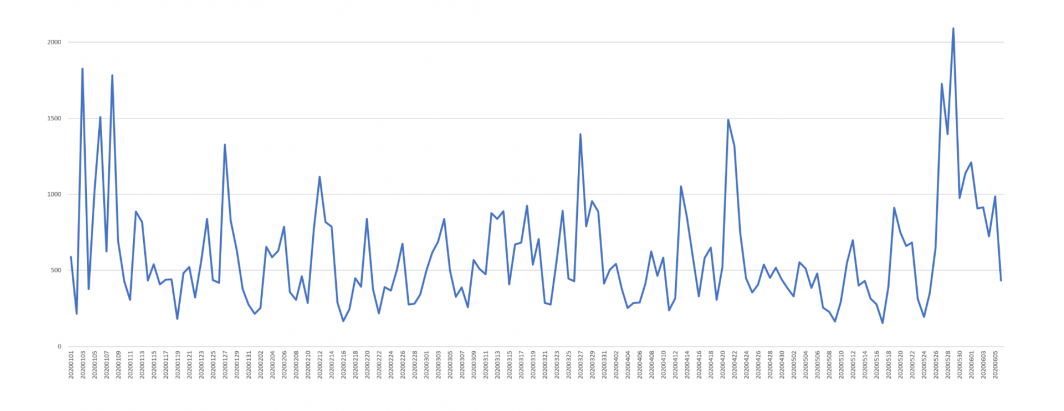
Using The Global Quotation Graph To Track Statements About Hydroxychloroquine
Using the new Global Quotation Graph it requires just a single line of SQL to compile a list of public…
Announcing The Global Quotation Graph
We are tremendously excited to announce today the debut of the GDELT Global Quotation Graph, which compiles quoted statements in…