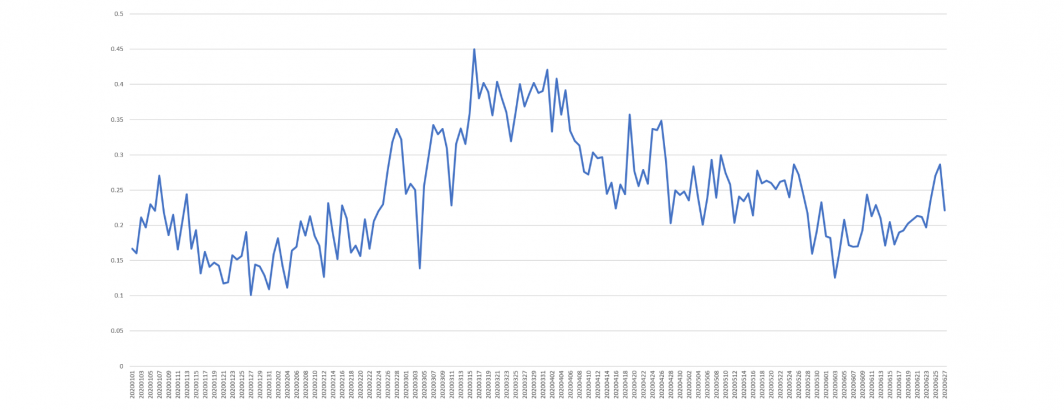
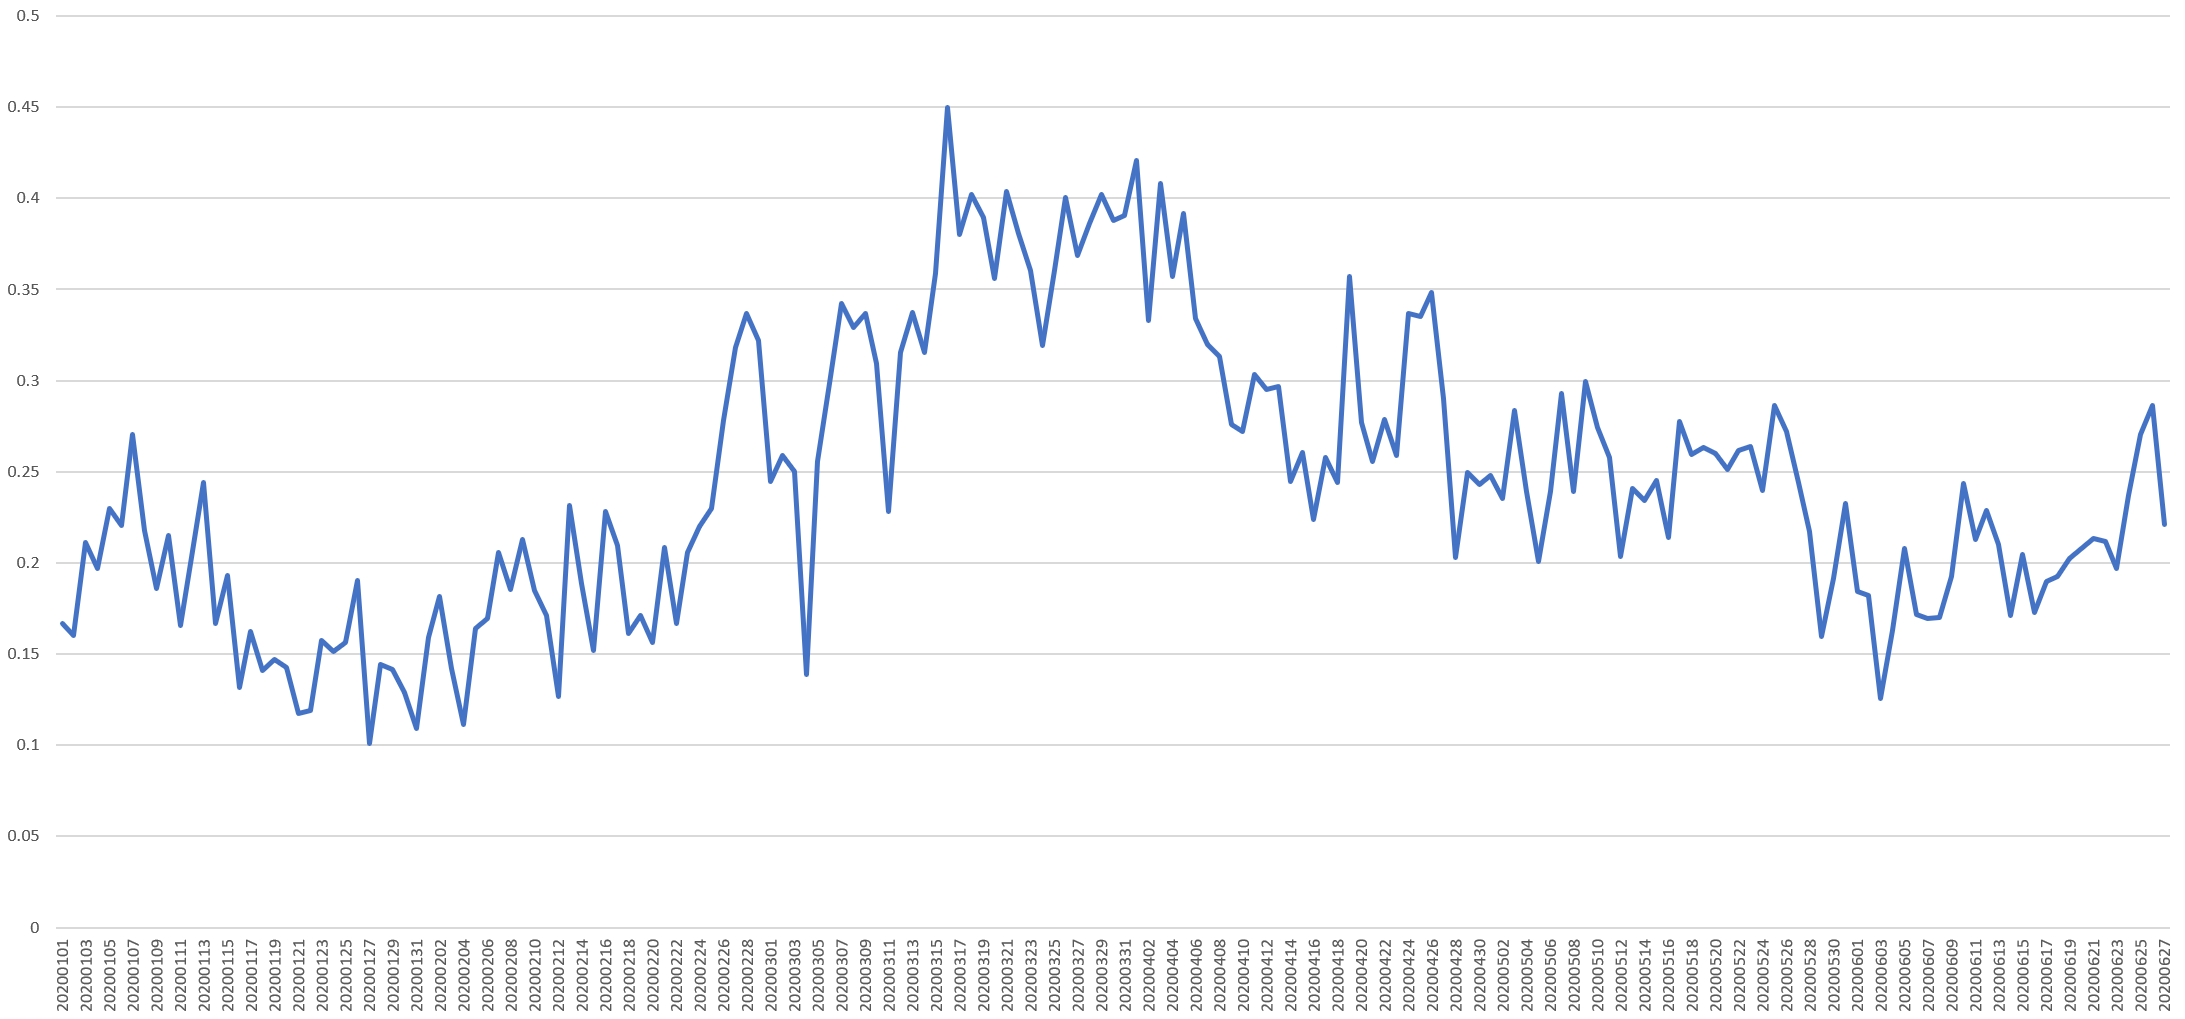
The timeline below uses Colin Martindale's Regressive Imagery Dictionary (RID) "anxiety" measure to assess the intensity of anxiety on CNN by day over the course of this year. The Y axis is the percent of words spoken each day on CNN that were found in the RID anxiety dictionary. The year entered with a degree of anxiousness characteristic of a brave new unknown year to come. It sharply decreased as the month began but then surged from Jan. 22 as the Covid-19 pandemic story reached the news media. Anxiety peaked on March 16 and remained level through April 5, dropping through April 15 to a new steady state. It then dropped again through June 3 and has steadily increased since as nationwide protests and the Covid-19 pandemic have dominated the channel's reporting.
TECHNICAL DETAILS
Creating the timeline above took just a single SQL query:
SELECT DATE, SUM(TOTMENTIONS) TOTWORDS, SUM(TONECOUNT) TOTTONEWORDS, SUM(TONECOUNT) / SUM(TOTMENTIONS) * 100 perc_anxiety from (
SELECT SUBSTR(CAST(DATE AS STRING), 0, 8) DATE, SUM(COUNT) TOTMENTIONS, SUM(COUNT) TONECOUNT FROM `gdelt-bq.gdeltv2.iatv_1gramsv2` where DATE(TIMESTAMP) >= "2020-01-01" AND STATION='CNN' and NGRAM in (SELECT WORD FROM `gdelt-bq.bqtemp.tone_rid_anxiety`) group by DATE, NGRAM
UNION ALL
SELECT SUBSTR(CAST(DATE AS STRING), 0, 8) DATE, SUM(COUNT) TOTMENTIONS, 0 TONECOUNT FROM `gdelt-bq.gdeltv2.iatv_1gramsv2` where DATE(TIMESTAMP) >= "2020-01-01" AND STATION='CNN' group by DATE, NGRAM
) group by DATE order by DATE asc
This query demonstrates the power of BigQuery's partitioning. With the date restrictors above it consumes just 7.1GB of data, while without them it requires 88.3GB.