To what degree does the view we see of the world around us vary based on the media outlets we consume? This fundamental question lies at the heart of our understanding of the role media plays in our increasingly divided nation. To date we've explored this question primarily through the medium of text, comparing spoken words, mentioned entities and even chyrons. What about the visual narratives that distinguish television news from other mediums?
The Visual Global Entity Graph 2.0 offers a unique dataset for exploring such questions, covering the ABC, CBS and NBC evening news broadcasts over the past decade. Google's Cloud Video API watched all 9,615 broadcasts totaling more than 18 million seconds of airtime and described second by second what it saw, annotating the objects and activities seen by viewers 2009-2020. In total, more than 477 million annotations covering 11,215 distinct labels were identified across the dataset.
Using this enormous dataset and the power of Google BigQuery, just a single SQL query is all that's required to compile a ranked histogram of all of the labels seen in each station's broadcast for each day and compute their pairwise Pearson correlations by day, generating a timeline of their visual similarity over the past decade. Unlike simplistic color or texture-based visual comparisons, the use of semantic labels means that two reports of a protest in which the stations use very different footage would still both yield the label of "protest" indicating that they both covered a protest even if the footage itself looks very different between them.
The final timeline can be seen below. Interestingly, the three stations were fairly well correlated up until mid 2012, when ABC and CBS diverged, before returning to similarity in late 2017.
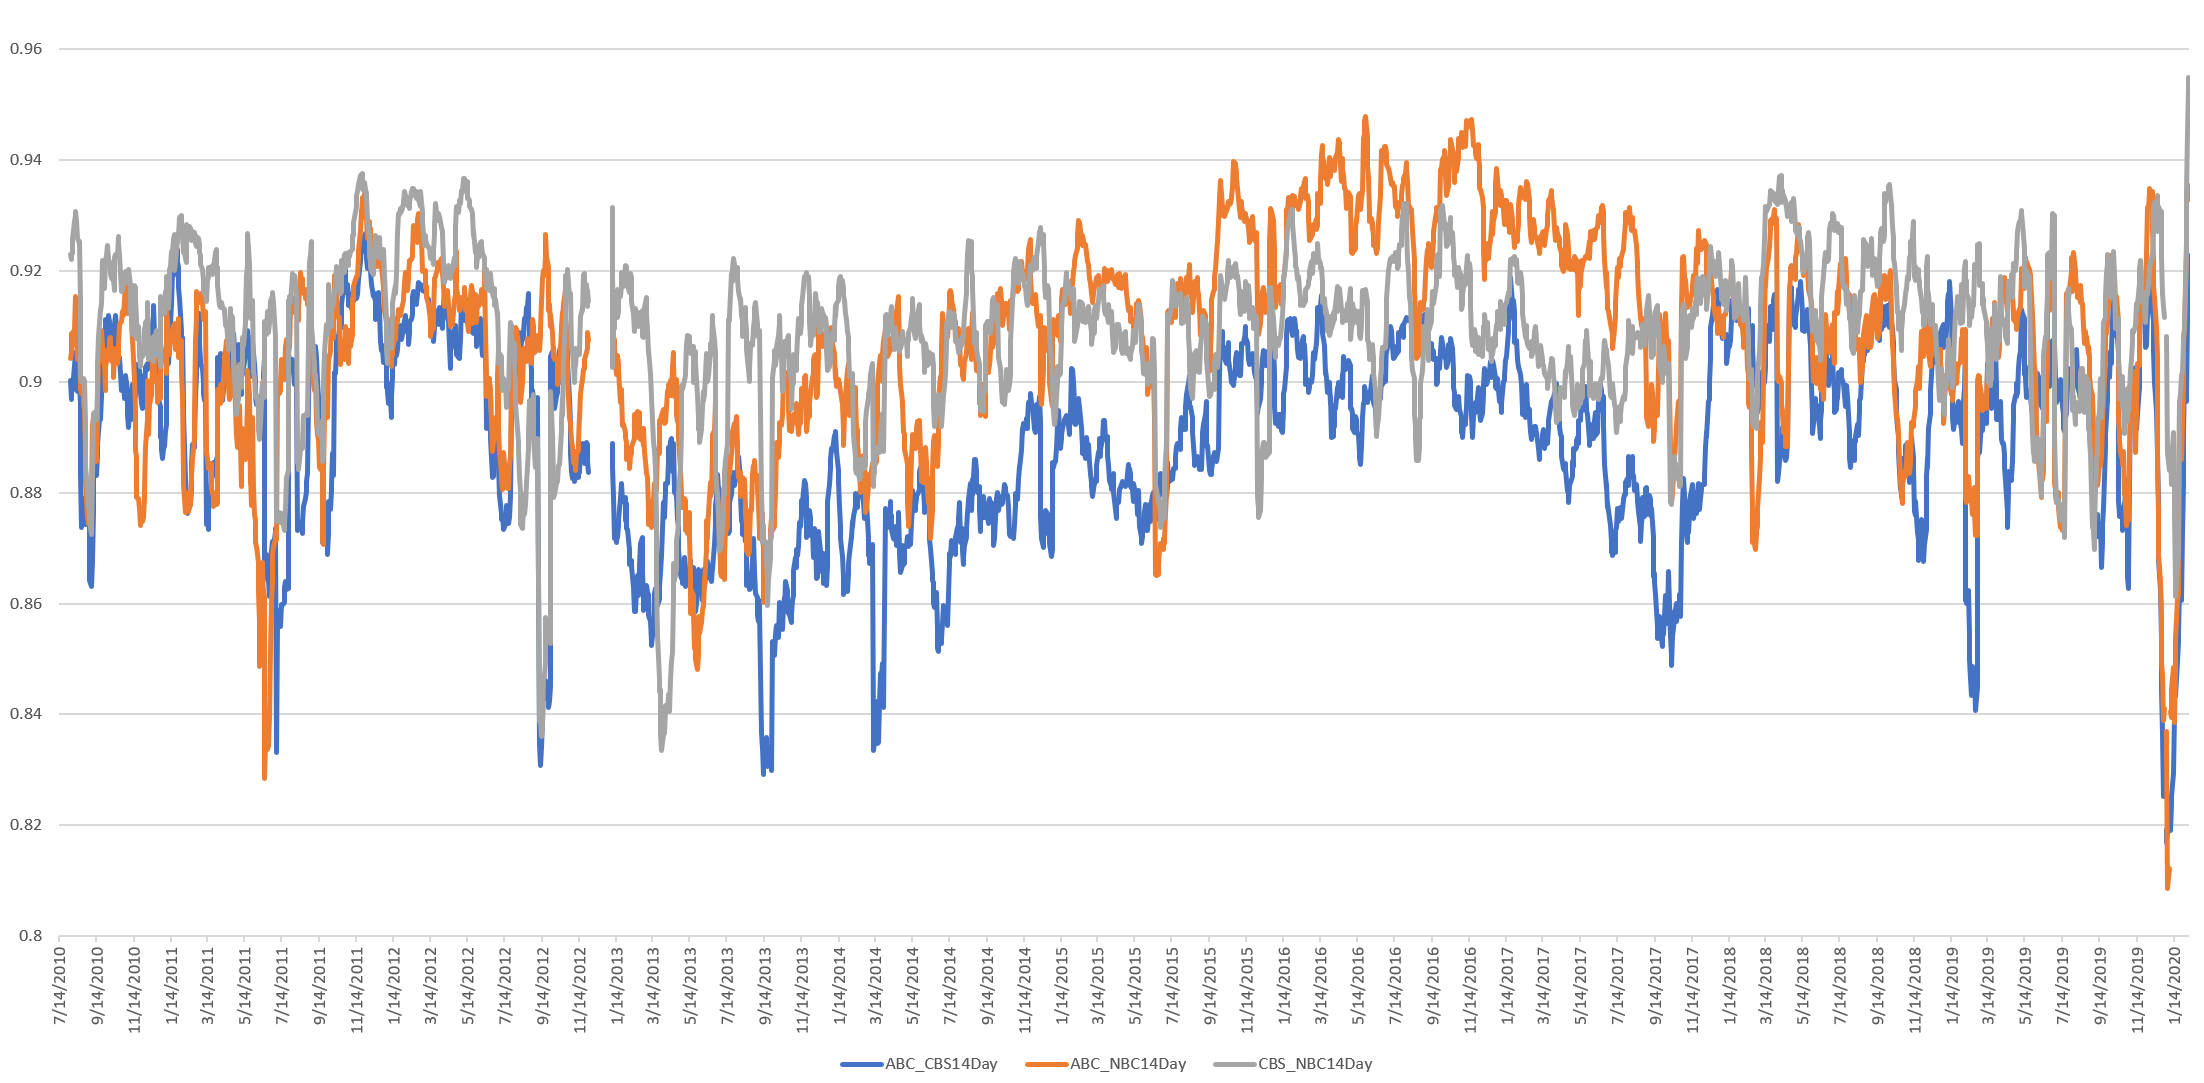
Perhaps most striking of all, however, is the tremendous drop in similarity in late 2019. Unlike a similar drop in 2012 that ultimately turned out to be show mislabeling (that period is excluded from the timeline above), the shows during this period are all their respective evening news broadcasts.
What might explain this sharp divergence after a decade of similarity?
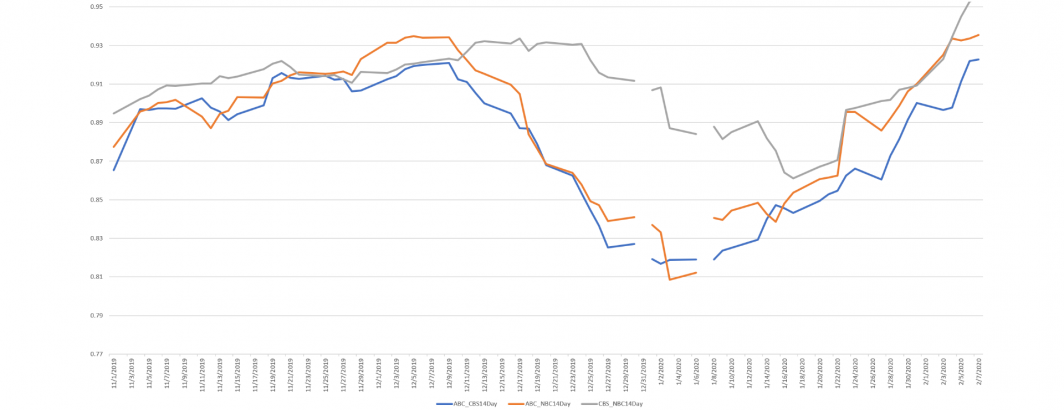
The timeline below zooms into this period, showing that the separation begins around December 12th, as the House debated the articles of impeachment. It reached its lowest point on January 9th, the day after Iranian missiles hit an Iraqi airbase housing US personnel in retaliation for the US killing of Qasem Soleimani. By the time of Trump's acquittal in the Senate, the three networks were back to their previous similarity levels.

Looking at the lowest point of similarity, January 9, 2020, ABC's World News Tonight With David Muir focused heavily on the Iranian downing of the Ukrainian jetliner, the Soleimani killing, "Mexit", Epstein's death and the Australian wildfires. That same evening, CBS Evening News With Norah O'Donnell similarly opened with the Iranian downing of the Ukrainian jetliner and the Soleimani killing, impeachment, "Mexit", RSV, Amazon's Ring camera privacy and ended on a lighthearted segment about two retirement home musicians. Similarly, NBC Nightly News With Lester Holt that night opened with Iranian downing of the Ukrainian jetliner and the Soleimani killing, focusing on the 63 Canadian nationals onboard, interviewing friends and relatives, moving on to "Mexit" and then ending on the Australian wildfires.
While all three opened with the Iranian jetliner shootdown and the broader US-Iranian hostilities, each emphasized slightly different aspects of the story. All three afforded differing levels of attention to "Mexit" and both ABC and NBC ended on segments about the Australian wildfires, while CBS opted for lighter fare. In turn, CBS focused on RSV and digital privacy. Thus, while viewers of all three networks would have come away with similar basic details about the US-Iranian hostilities and the "Mexit" drama, the specifics of those stories and the rest of the stories they heard varied quite a bit by network, reinforcing that there is quite a bit of difference even in the imagery we see on the news each evening.
Similarly, on January 3, 2020, ABC's World News Tonight With David Muir opened with the US airstrike on Soleimani and its potential impact around the world, Australian wildfires and a deeper look at the stories of the Cleveland kidnapping victims. CBS Evening News With Norah O'Donnell opened with the airstrike and focused on US justifications for the attack before moving on to its potential impact, a stabbing attack in Texas, a divide in the Protestant Church, warnings about the flu season and a lighthearted look at a cat rescue. NBC Nightly News With Lester Holt opened with the airstrike and focused on Iranian threats of revenge, transitioned to the Australian wildfires, then to Carlos Ghosn's escape from Japan.
TECHNICAL DETAILS
Despite performing pairwise correlations over 18 million entries across 3,484 distinct days over three stations, the correlation above took just a single SQL query in BigQuery. The initial "WITH sheet" block summarizes and reformats the data into a simple spreadsheet, including translating the timestamps from UTC to PST timezone (the networks are monitored from their local San Francisco affiliates). Careful observers will note an interesting filter in each of the station selectors: "EXTRACT(DAYOFWEEK from DATE(date, "America/Los_Angeles")) >= 2 and EXTRACT(DAYOFWEEK from DATE(date, "America/Los_Angeles")) <= 6". This bit of code converts the timestamp to PST and then computes the day of week it represents (ranging from 1 for Sunday through 7 for Saturday). All three affiliates air broadcasts during weeknights Monday through Friday, but differ on whether they also include Saturday and Sunday evening news broadcasts. Limiting the analysis to only weeknights ensures only days where all three stations broadcast are included.
WITH sheet AS (
select DATE, entity, SUM(KGO) KGO, SUM(KPIX) KPIX, SUM(KNTV) KNTV from (
 (SELECT DATE(date, "America/Los_Angeles") DATE, entity.name entity, count(1) KGO, 0 KPIX, 0 KNTV FROM `gdelt-bq.gdeltv2.vgegv2_iatv`, UNNEST(entities) AS entity WHERE station='KGO' and EXTRACT(DAYOFWEEK from DATE(date, "America/Los_Angeles")) >= 2 and EXTRACT(DAYOFWEEK from DATE(date, "America/Los_Angeles")) <= 6 group by DATE, entity having count(1) > 10)
UNION ALL
 (SELECT DATE(date, "America/Los_Angeles") DATE, entity.name entity, 0 KGO, count(1) KPIX, 0 KNTV FROM `gdelt-bq.gdeltv2.vgegv2_iatv`, UNNEST(entities) AS entity WHERE station='KPIX' and EXTRACT(DAYOFWEEK from DATE(date, "America/Los_Angeles")) >= 2 and EXTRACT(DAYOFWEEK from DATE(date, "America/Los_Angeles")) <= 6 group by DATE, entity having count(1) > 10)
UNION ALL
 (SELECT DATE(date, "America/Los_Angeles") DATE, entity.name entity, 0 KGO, 0 KPIX, count(1) KNTV FROM `gdelt-bq.gdeltv2.vgegv2_iatv`, UNNEST(entities) AS entity WHERE station='KNTV' and EXTRACT(DAYOFWEEK from DATE(date, "America/Los_Angeles")) >= 2 and EXTRACT(DAYOFWEEK from DATE(date, "America/Los_Angeles")) <= 6 group by DATE, entity having count(1) > 10)
) GROUP BY entity, DATE
)
SELECT a.DATE,
CORR(a.KGO, b.KPIX) KGO_KPIX,
CORR(a.KGO, b.KNTV) KGO_KNTV,
CORR(a.KPIX, b.KNTV) KPIX_KNTV
FROM sheet a
JOIN sheet b
ON a.entity=b.entity
WHERE a.DATE=b.DATE AND (a.KGO > 10 OR a.KPIX > 10 OR a.KNTV > 10)
GROUP BY a.DATE, b.DATE order by DATE
To convert the dates to months rather than days, simply use "DATE_TRUNC":
WITH sheet AS (
select DATE, entity, SUM(KGO) KGO, SUM(KPIX) KPIX, SUM(KNTV) KNTV from (
 (SELECT DATE_TRUNC(DATE(date, "America/Los_Angeles"), MONTH) DATE, entity.name entity, count(1) KGO, 0 KPIX, 0 KNTV FROM `gdelt-bq.gdeltv2.vgegv2_iatv`, UNNEST(entities) AS entity WHERE station='KGO' and EXTRACT(DAYOFWEEK from DATE(date, "America/Los_Angeles")) >= 2 and EXTRACT(DAYOFWEEK from DATE(date, "America/Los_Angeles")) <= 6 group by DATE, entity having count(1) > 10)
UNION ALL
 (SELECT DATE_TRUNC(DATE(date, "America/Los_Angeles"), MONTH) DATE, entity.name entity, 0 KGO, count(1) KPIX, 0 KNTV FROM `gdelt-bq.gdeltv2.vgegv2_iatv`, UNNEST(entities) AS entity WHERE station='KPIX' and EXTRACT(DAYOFWEEK from DATE(date, "America/Los_Angeles")) >= 2 and EXTRACT(DAYOFWEEK from DATE(date, "America/Los_Angeles")) <= 6 group by DATE, entity having count(1) > 10)
UNION ALL
 (SELECT DATE_TRUNC(DATE(date, "America/Los_Angeles"), MONTH) DATE, entity.name entity, 0 KGO, 0 KPIX, count(1) KNTV FROM `gdelt-bq.gdeltv2.vgegv2_iatv`, UNNEST(entities) AS entity WHERE station='KNTV' and EXTRACT(DAYOFWEEK from DATE(date, "America/Los_Angeles")) >= 2 and EXTRACT(DAYOFWEEK from DATE(date, "America/Los_Angeles")) <= 6 group by DATE, entity having count(1) > 10)
) GROUP BY entity, DATE
)
SELECT a.DATE,
CORR(a.KGO, b.KPIX) KGO_KPIX,
CORR(a.KGO, b.KNTV) KGO_KNTV,
CORR(a.KPIX, b.KNTV) KPIX_KNTV
FROM sheet a
JOIN sheet b
ON a.entity=b.entity
WHERE a.DATE=b.DATE AND (a.KGO > 10 OR a.KPIX > 10 OR a.KNTV > 10)
GROUP BY a.DATE, b.DATE order by DATE
To count total airtime by day:
select DAY,
SUM(KGOAllSeconds) KGOTotAllSeconds,
SUM(KPIXAllSeconds) KPIXTotAllSeconds,
SUM(KNTVAllSeconds) KNTVTotAllSeconds,
SUM(KGOAllSeconds)+SUM(KPIXAllSeconds)+SUM(KNTVAllSeconds) TotAllSeconds
 from (
SELECT DATE(date, "America/Los_Angeles") DAY, count(1) KGOAllSeconds, 0 KPIXAllSeconds, 0 KNTVAllSeconds FROM `gdelt-bq.gdeltv2.vgegv2_iatv` where station='KGO' and EXTRACT(DAYOFWEEK from DATE(date, "America/Los_Angeles")) >= 2 and EXTRACT(DAYOFWEEK from DATE(date, "America/Los_Angeles")) <= 6 group by DAY
UNION ALL
SELECT DATE(date, "America/Los_Angeles") DAY, 0 KGOAllSeconds, count(1) KPIXAllSeconds, 0 KNTVAllSeconds FROM `gdelt-bq.gdeltv2.vgegv2_iatv` where station='KPIX' and EXTRACT(DAYOFWEEK from DATE(date, "America/Los_Angeles")) >= 2 and EXTRACT(DAYOFWEEK from DATE(date, "America/Los_Angeles")) <= 6 group by DAY
UNION ALL
SELECT DATE(date, "America/Los_Angeles") DAY, 0 KGOAllSeconds, 0 KPIXAllSeconds, count(1) KNTVAllSeconds FROM `gdelt-bq.gdeltv2.vgegv2_iatv` where station='KNTV' and EXTRACT(DAYOFWEEK from DATE(date, "America/Los_Angeles")) >= 2 and EXTRACT(DAYOFWEEK from DATE(date, "America/Los_Angeles")) <= 6 group by DAY
) group by DAY order by DAY asc
To count the total number of entity annotations:
SELECT count(1) FROM `gdelt-bq.gdeltv2.vgegv2_iatv`, UNNEST(entities) entity
Or to count the total number of unique entities in all of those annotations:
SELECT count(distinct(entity.name)) FROM `gdelt-bq.gdeltv2.vgegv2_iatv`, UNNEST(entities) entity
Or to view a list of the shows that aired on a specific date:
SELECT distinct(iaShowId) FROM `gdelt-bq.gdeltv2.vgegv2_iatv` WHERE DATE(date, "America/Los_Angeles") = "2011-6-17" LIMIT 1000
Each of these queries above takes just seconds to examine the visual trends of a decade of television news!