Earlier today we used the Television News Entity Graph, which tracks the primary things and topics discussed on television news by using deep learning NLP to read through their transcripts, to report the overall correlation of the well known entities mentioned on CNN, MSNBC and Fox News and ABC, CBS and NBC evening news broadcasts over the past decade.
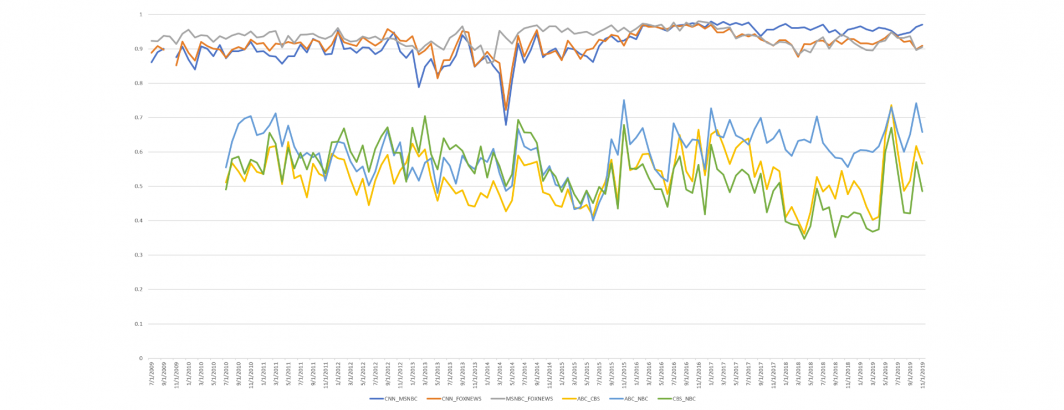
How have those correlations changed over time? The timeline below shows the monthly correlations of the six stations over time, showing that their correlations have been remarkably stable over time, though with a few notable deviations.
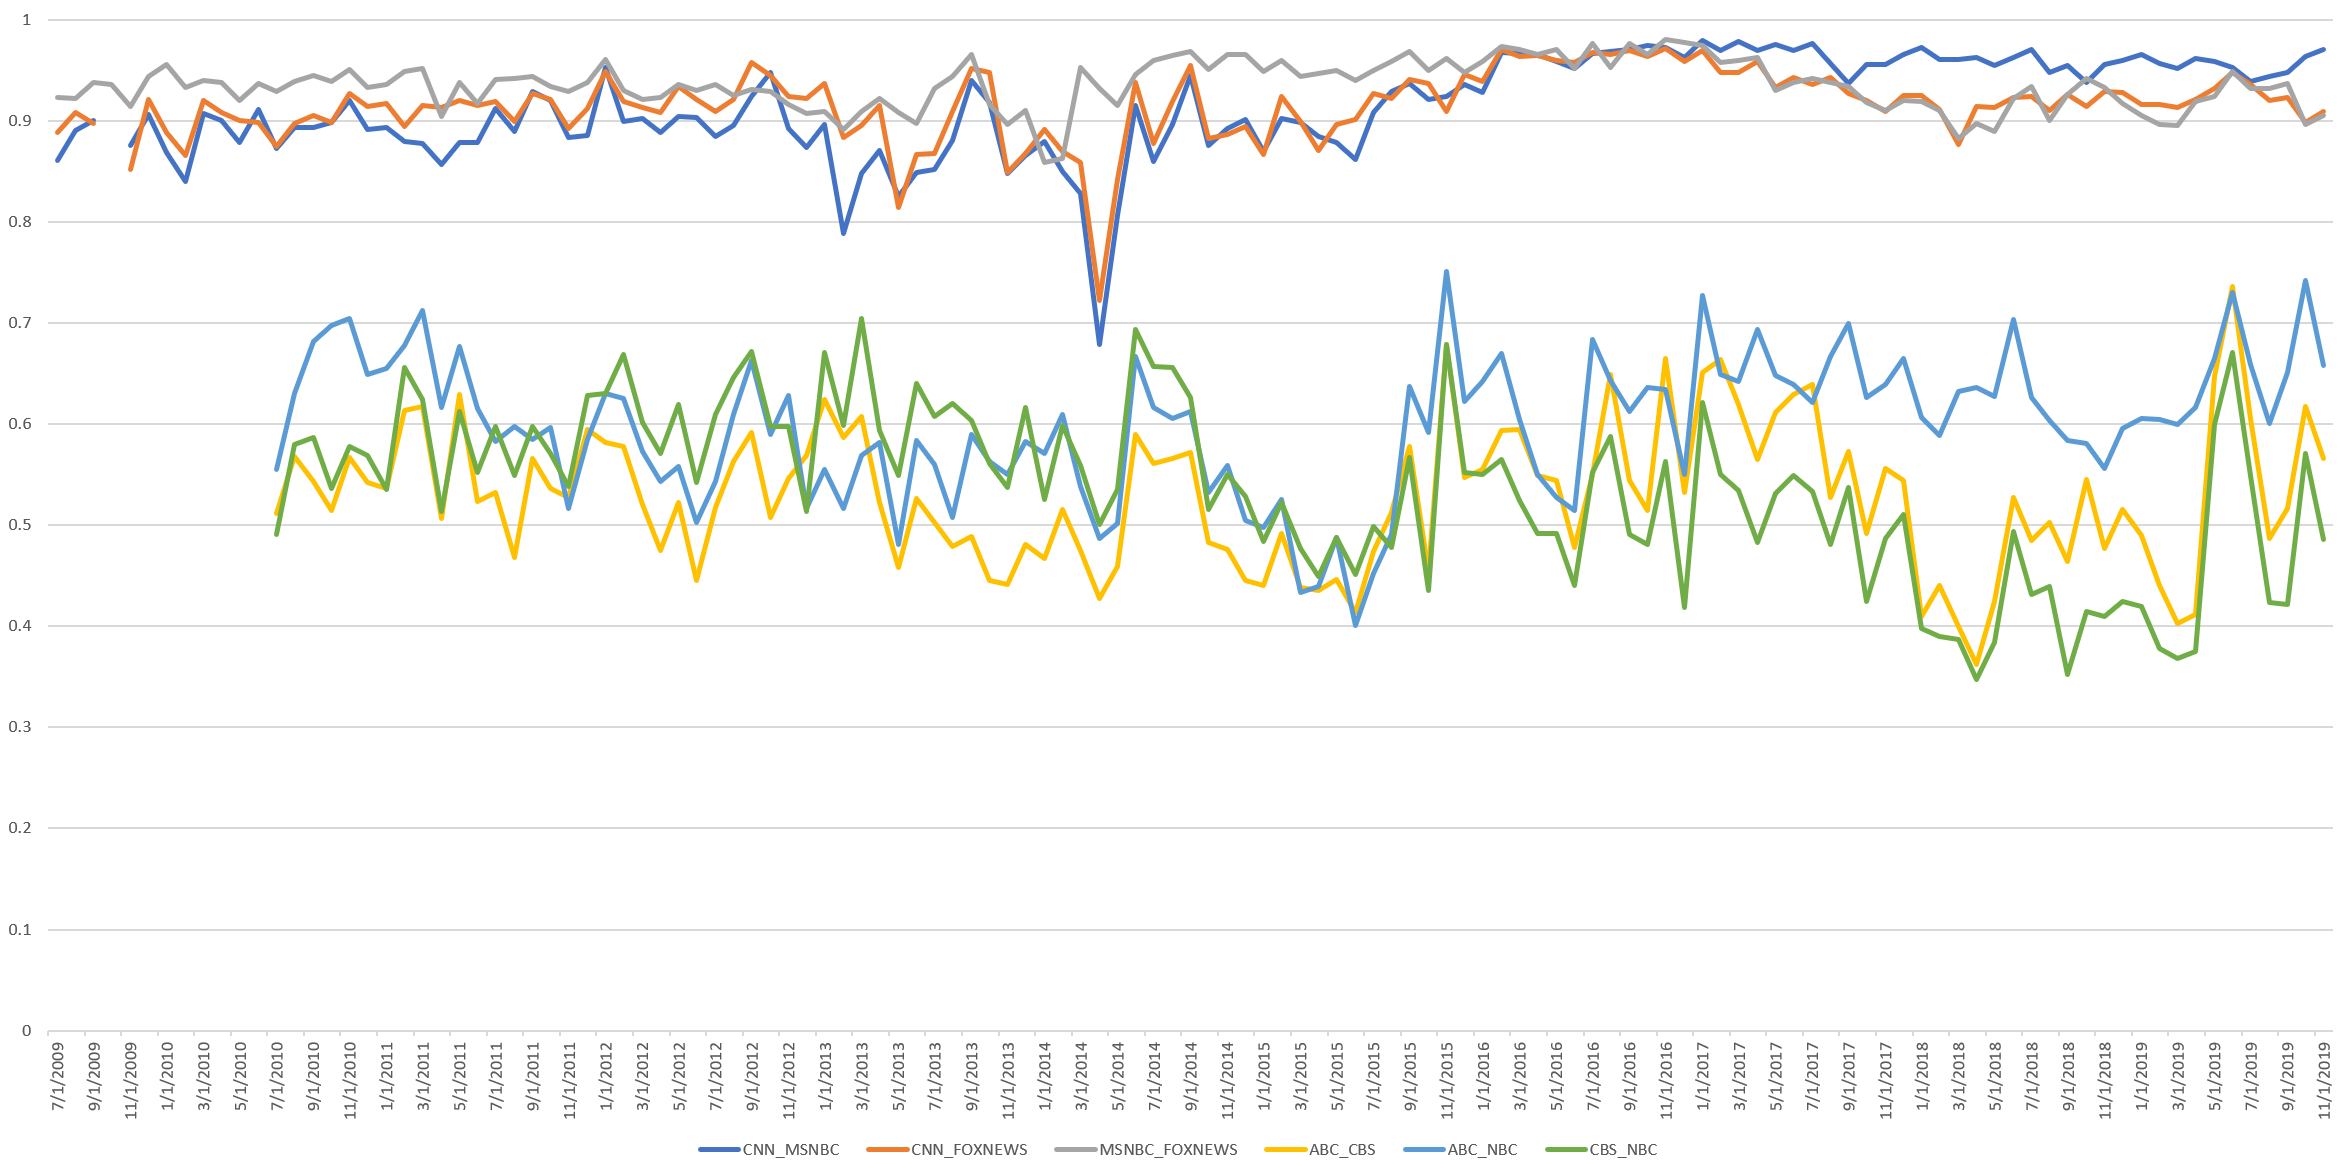
Of particular interest, from February 2016 through January 2017, CNN, MSNBC and Fox News were all correlated around r=0.97 with one another, reflecting the absolute dominance of the 2016 presidential election and especially Donald Trump. CNN and MSNBC have remained highly correlated in the three years since, but both have drifted noticeably from Fox News. Moments that brought the three back together since January 2017 including October 2018 and June 2019.
Interestingly, January 2017 also marked the most stark deviation in evening news broadcasts of the past decade, in which ABC and NBC have remained highly correlated, but CBS has drifted dramatically from the other two. Given the total airtime represented in the graphs above, it is unlikely that differences in advertising alone (and noting that many advertisements are not captioned or include substantial amounts of non-speaking airtime) could account for this systematic shift, especially given that the majority of the entities mentioned in advertisements are not typically assigned their own Google MID codes and thus are excluded from this analysis.
TECHNICAL DETAILS
Creating this timeline took just a single SQL query and 13 seconds.
WITH sheet AS (
WITH data AS (
SELECT TIMESTAMP_TRUNC(date, MONTH) date, Station, entities.mid entity, count(1) count FROM `gdelt-bq.gdeltv2.geg_iatv`, unnest(entities) entities where entities.mid is not null group by date, Station, entities.mid
)
select date, entity, SUM(CNN) CNN, SUM(MSNBC) MSNBC, SUM(FOXNEWS) FOXNEWS, SUM(BBCNEWS) BBCNEWS, SUM(ABC) ABC, SUM(CBS) CBS, SUM(NBC) NBC from (
(SELECT date, entity, count CNN, 0 MSNBC, 0 FOXNEWS, 0 BBCNEWS, 0 ABC, 0 CBS, 0 NBC FROM data where count > 10 and Station='CNN')
UNION ALL
(SELECT date, entity, 0 CNN, count MSNBC, 0 FOXNEWS, 0 BBCNEWS, 0 ABC, 0 CBS, 0 NBC FROM data where count > 10 and Station='MSNBC')
UNION ALL
(SELECT date, entity, 0 CNN, 0 MSNBC, count FOXNEWS, 0 BBCNEWS, 0 ABC, 0 CBS, 0 NBC FROM data where count > 10 and Station='FOXNEWS')
UNION ALL
(SELECT date, entity, 0 CNN, 0 MSNBC, 0 FOXNEWS, count BBCNEWS, 0 ABC, 0 CBS, 0 NBC FROM data where count > 10 and Station='BBCNEWS')
UNION ALL
(SELECT date, entity, 0 CNN, 0 MSNBC, 0 FOXNEWS, 0 BBCNEWS, count ABC, 0 CBS, 0 NBC FROM data where count > 10 and Station='KGO')
UNION ALL
(SELECT date, entity, 0 CNN, 0 MSNBC, 0 FOXNEWS, 0 BBCNEWS, 0 ABC, count CBS, 0 NBC FROM data where count > 10 and Station='KPIX')
UNION ALL
(SELECT date, entity, 0 CNN, 0 MSNBC, 0 FOXNEWS, 0 BBCNEWS, 0 ABC, 0 CBS, count NBC FROM data where count > 10 and Station='KNTV')
) GROUP BY entity, date
)
SELECT DATE(a.date) date,
CORR(a.CNN, b.MSNBC) CNN_MSNBC,
CORR(a.CNN, b.FOXNEWS) CNN_FOXNEWS,
CORR(a.MSNBC, b.FOXNEWS) MSNBC_FOXNEWS,
CORR(a.ABC, b.CBS) ABC_CBS,
CORR(a.ABC, b.NBC) ABC_NBC,
CORR(a.CBS, b.NBC) CBS_NBC
FROM sheet a
JOIN sheet b
ON a.entity=b.entity
WHERE a.date=b.date
GROUP BY a.date, b.date order by date