The new Visual Global Entity Graph 2.0 covers more than 19 million seconds of airtime across four stations spanning ten years (3,484 total days). In turn, it is drawn from a dataset of almost two million broadcasts from more than 150 stations. Unlike online news articles that contain their titles embedded within the page itself, television news typically requires an external source of information that gives the name of the show being aired at each moment. Sometimes this information can be wrong, meaning that a half hour show airing in the usual evening news slot at 5:30PM and labeled as "Evening News" might actually in rare circumstances be something else. Such instances are quite rare, but when they occur in clusters can distort quantitative analyses.
How might we automatically detect this small collection of outliers?
Closed captioning correlation is certainly one approach, but a look back on its results from this past December suggest it may not be sensitive enough to accurately surface outliers, especially given the enormous freeform vocabulary of human speech.
Instead, semantic visual correlation offers an alternative signal that has the potential of being much more aligned with the needs of such outlier detection. What if we used Google Cloud Video API's visual annotations, describing what they saw in each broadcast second by second and compared those across ABC, CBS and NBC by day to identify days with sharp divergences? In short, what if we took the Visual Global Entity Graph 2.0 and ran a simple Pearson correlation of the three stations by day over the past decade?
Unlike the limitless vocabulary of the spoken word, deep learning video understanding systems like Google's Cloud Video API typically use closed vocabularies in which they identify a fixed set of around 30,000 objects and activities. The small number of identified entities means correlations are more sensitive to macro-level change since every frame is described using the same vocabulary.
Why not just use surface colors and textures instead of semantic labels? The reason is that two broadcasts about the same topic might use very different imagery to illustrate the story, but the objects and activities they depict will likely be the same. A climate protest might be shown from different angles and different areas of the protest might be shown, meaning the surface imagery might differ dramatically, but both broadcasts will feature protest-related imagery.
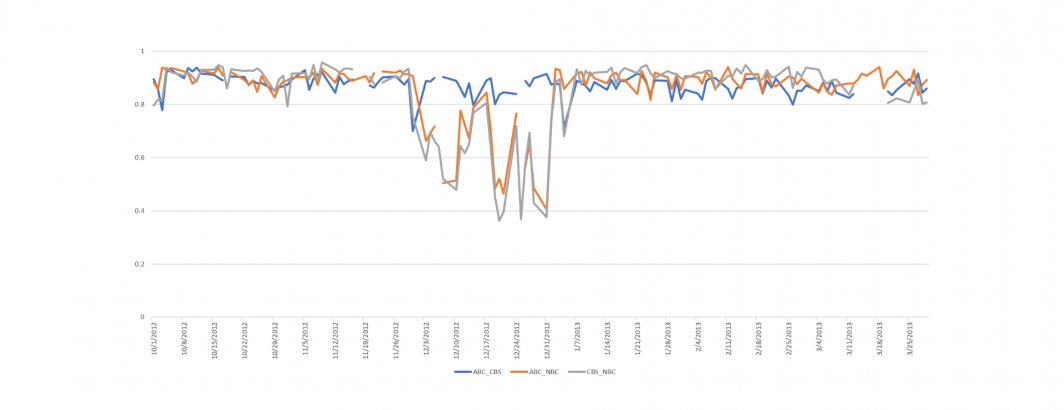
It turns out that a single SQL query in BigQuery is all that's required to measure the pairwise correlation of the visual entities identified by Cloud Video API for the three stations by day. The timeline below shows a zoomed portion of this timeline showing that from November 30, 2012 through January 4, 2013, NBC differs sharply from ABC and CBS in its visual imagery compared with the relative stability of the surrounding weeks.
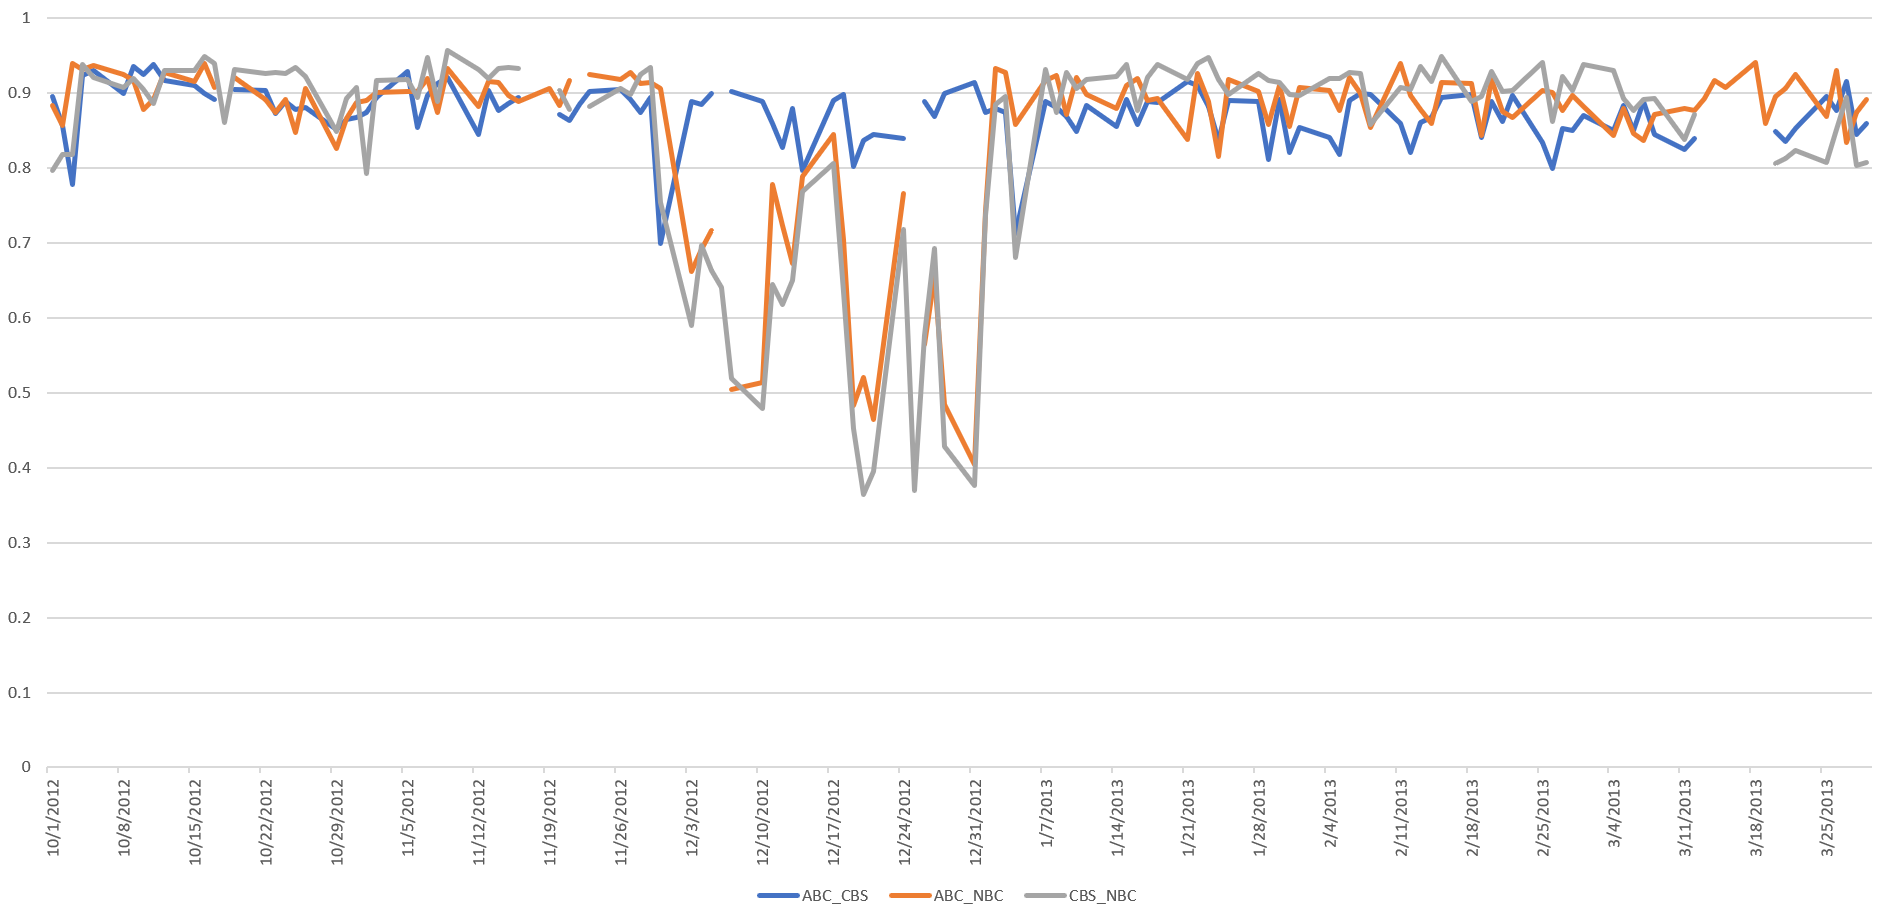
A closer look at at this period shows that the NBC broadcasts during this period during the usual 5:30-6PM slot were titled "NBC Nightly News" but actually featured other programming. While closed captioning correlation did not readily surface these outliers, semantic visual correlation makes them starkly apparent.
TECHNICAL DETAILS
Despite performing pairwise correlations over 18 million entries across 3,484 distinct days over three stations, the correlation above took just a single SQL query in BigQuery. The initial "WITH sheet" block summarizes and reformats the data into a simple spreadsheet, including translating the timestamps from UTC to PST timezone (the networks are monitored from their local San Francisco affiliates). Careful observers will note an interesting filter in each of the station selectors: "EXTRACT(DAYOFWEEK from DATE(date, "America/Los_Angeles")) >= 2 and EXTRACT(DAYOFWEEK from DATE(date, "America/Los_Angeles")) <= 6". This bit of code converts the timestamp to PST and then computes the day of week it represents (ranging from 1 for Sunday through 7 for Saturday). All three affiliates air broadcasts during weeknights Monday through Friday, but differ on whether they also include Saturday and Sunday evening news broadcasts. Limiting the analysis to only weeknights ensures only days where all three stations broadcast are included.
WITH sheet AS (
select DATE, entity, SUM(KGO) KGO, SUM(KPIX) KPIX, SUM(KNTV) KNTV from (
 (SELECT DATE(date, "America/Los_Angeles") DATE, entity.name entity, count(1) KGO, 0 KPIX, 0 KNTV FROM `gdelt-bq.gdeltv2.vgegv2_iatv`, UNNEST(entities) AS entity WHERE station='KGO' and EXTRACT(DAYOFWEEK from DATE(date, "America/Los_Angeles")) >= 2 and EXTRACT(DAYOFWEEK from DATE(date, "America/Los_Angeles")) <= 6 group by DATE, entity having count(1) > 10)
UNION ALL
 (SELECT DATE(date, "America/Los_Angeles") DATE, entity.name entity, 0 KGO, count(1) KPIX, 0 KNTV FROM `gdelt-bq.gdeltv2.vgegv2_iatv`, UNNEST(entities) AS entity WHERE station='KPIX' and EXTRACT(DAYOFWEEK from DATE(date, "America/Los_Angeles")) >= 2 and EXTRACT(DAYOFWEEK from DATE(date, "America/Los_Angeles")) <= 6 group by DATE, entity having count(1) > 10)
UNION ALL
 (SELECT DATE(date, "America/Los_Angeles") DATE, entity.name entity, 0 KGO, 0 KPIX, count(1) KNTV FROM `gdelt-bq.gdeltv2.vgegv2_iatv`, UNNEST(entities) AS entity WHERE station='KNTV' and EXTRACT(DAYOFWEEK from DATE(date, "America/Los_Angeles")) >= 2 and EXTRACT(DAYOFWEEK from DATE(date, "America/Los_Angeles")) <= 6 group by DATE, entity having count(1) > 10)
) GROUP BY entity, DATE
)
SELECT a.DATE,
CORR(a.KGO, b.KPIX) KGO_KPIX,
CORR(a.KGO, b.KNTV) KGO_KNTV,
CORR(a.KPIX, b.KNTV) KPIX_KNTV
FROM sheet a
JOIN sheet b
ON a.entity=b.entity
WHERE a.DATE=b.DATE AND (a.KGO > 10 OR a.KPIX > 10 OR a.KNTV > 10)
GROUP BY a.DATE, b.DATE order by DATE