In 2016 and 2017 we explored what it looked like to try and literally map "global happiness" through the eyes of the world's news media. As with television, however, often the most interesting stories are told through through how emotion changes day by day through the eyes of hundreds of millions of news articles from across the globe. Those stories tend to be lost when looking only at annual summaries.
Towards this end we are excited to present our first ever Animated Global Happiness Map, showing how "happy" or "sad" the average tone was of all worldwide news coverage monitored by GDELT each day that mentioned that location. The final animation covers nearly four years of world history through the eyes of more than 7.1 billion location mentions across 850 million news articles in 65 languages. Just a single line of SQL and 2 minutes 14 seconds was all it took for BigQuery to process all 7.1 billion location references (more than 400GB of geographic data in total) to generate the final output file of more than 70 million distinct location-day pairs that were rendered into the final maps.
The final animation can be seen below. It is available in the following formats:
- YouTube. You can watch the full animation on YouTube in its native 4K resolution or any desired lower resolution.
- Raw MPEG. You can also download the raw 4k MPEG movie file (H.264 / yuv420p).
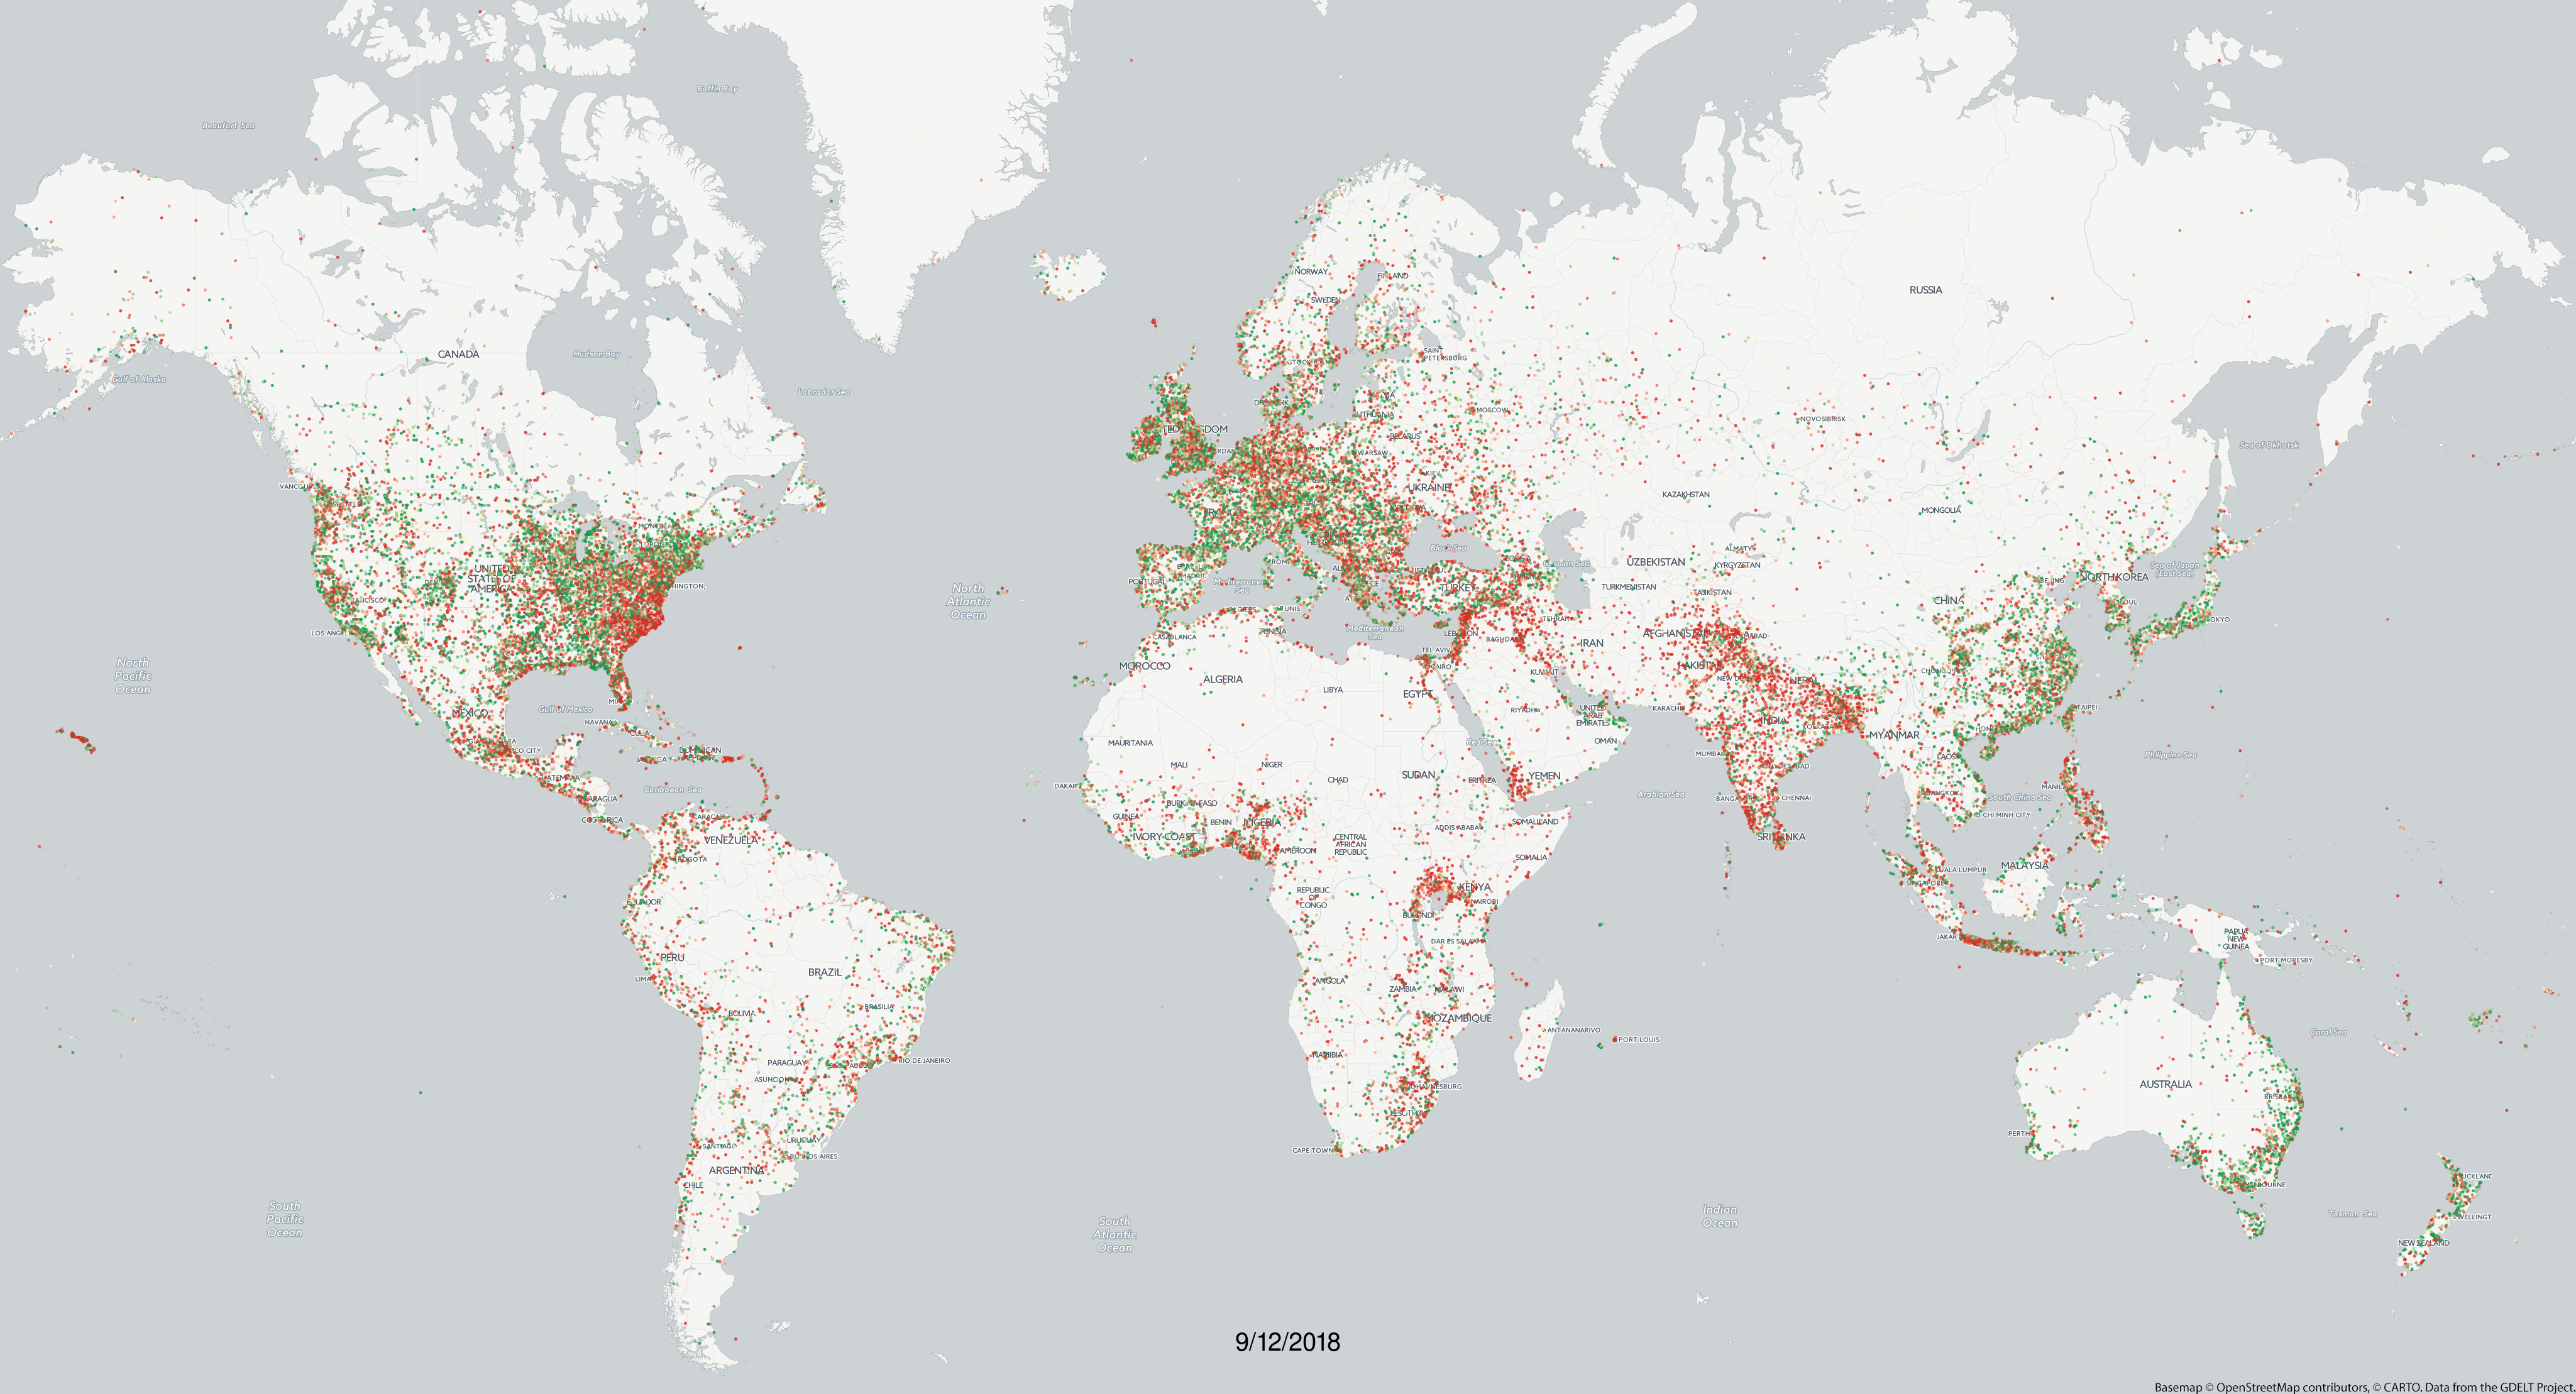
- Raw Video Frames. You can download the individual video frames (one per day) as PNG images using the URL format "http://data.gdeltproject.org/blog/2018-television-news-geography-2009-2018-movies/frames-cnn_msnbc_fox/YYYYMMDD.png" and replace "YYYYMMDD" with any date between 20150217 and 20181124. Thus, to download the frame for September 12, 2018 you would use the URL "http://data.gdeltproject.org/blog/2018-global-happiness-2015-2018-animation/frames/20180912.png".
- CSV Data File. You can also download the raw CSV output of the BigQuery query (see the bottom of this blog post) from which the maps were generated, to create your own maps or spatial analyses. NOTE that this file is 3.1GB compressed ().
TECHNICAL DETAILS
To create the map above, we simply used the following SQL statement with BigQuery and downloaded the results as a CSV file (see above to download the raw CSV file to make your own map). This was then imported into GDELT's powerful new mapping infrastructure that projected it into Web Mercator (EPSG:3857), styled the points, reprojected them into GraphViz space adjusted for the selected basemap, rendered them using GraphViz's rasterization pipeline, overlaid them on top of the selected basemap (in this case the Carto Positron basemap) and finally appended the date as a text layer overlay. Finally, the PNG sequence was converted into an MPEG movie using ffmpeg. GDELT's new mapping system automates this entire workflow, accepting as input the raw results of the BigQuery query below and automatically distributing the workload in this case across 32 cores and 200GB of RAM backed by Local SSD, outputting to GCS, allowing one-click mapping from BigQuery GDELT queries directly into a final polished animation, uniquely tailored for GDELT's geographic data.
For those interested in mapping only portions of the world, you can use the countrycode and ADM1 codes in the CSV files to filter to geographic subsets.
select DATE, max(latitude) latitude, max(longitude) longitude, max(countrycode) countrycode, max(adm1code) adm1code, featureid, max(featuretype) featuretype, count(1) cnt, avg(tone) tone from (
SELECT REGEXP_EXTRACT(SPLIT(V2Locations,';'),r'(^[0-5])#') as featuretype,
REGEXP_EXTRACT(SPLIT(V2Locations,';'),r'^[0-5]#.*?#(.*?)#') as countrycode,
REGEXP_EXTRACT(SPLIT(V2Locations,';'),r'^[0-5]#.*?#.*?#(.*?)#') as adm1code,
REGEXP_EXTRACT(SPLIT(V2Locations,';'),r'^[0-5]#.*?#.*?#.*?#.*?#(.*?)#') as latitude,
REGEXP_EXTRACT(SPLIT(V2Locations,';'),r'^[0-5]#.*?#.*?#.*?#.*?#.*?#(.*?)#') as longitude,
REGEXP_EXTRACT(SPLIT(V2Locations,';'),r'^[0-5]#.*?#.*?#.*?#.*?#.*?#.*?#(.*?)#') as featureid,
FLOAT(REGEXP_REPLACE(V2Tone, r',.*', "")) tone,
substr(string(DATE), 1, 8) DATE
FROM [gdeltv2.gkg]
) where featureid is not null group by DATE, featureid