Earlier this week we created a series of maps visualizing the geography of American and British television news through the eyes of BBC, CNN, MSNBC and Fox News over the past decade. These static maps yield incredible insights into where the stations' attention has been focused over the past decade, but sometimes the most interesting story is told through how that attention has changed over time.
Today we're releasing two powerful new animations that show day by day where the combined focus of American and British news has been centered geographically, using data from the Internet Archive's Television News Archive. The first animation maps all of the locations mentioned across CNN, MSNBC and Fox News combined each day 2009-2018. The second does the same for BBC News London 2017-2018.
Keep in mind that these animations were created through automated textual geocoding of the raw closed captioning streams of each station, meaning they reflect a certain degree of error from the captioning and geocoding processes inherent in all fully automated data mining. Raw television captioning data is especially difficult to work with, filled with typographical errors and rapid-fire contextual changes and lacking capitalization, punctuation and refined grammatical structure, meaning geocoding algorithms have less high-confidence contextualizing features to help guide their candidate selection and disambiguation processes. In short, these maps will contain a certain level of error, but they offer a powerful glimpse into the geography and attention of television news over the past decade!
These animations were generated by our brand-new GDELT mapping infrastructure that will be debuting with the launch of the new GDELT Analysis Service either at the end of December or early January, so stay tuned!
CNN + Fox News + MSNBC 2009-2018
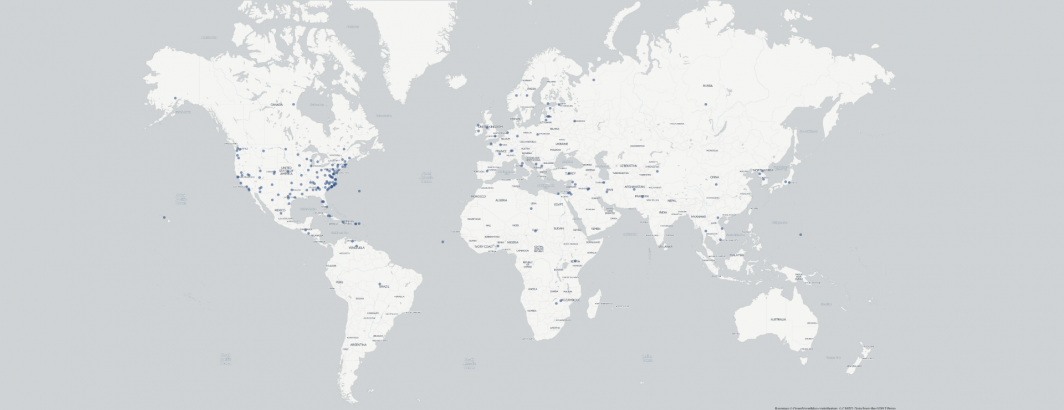
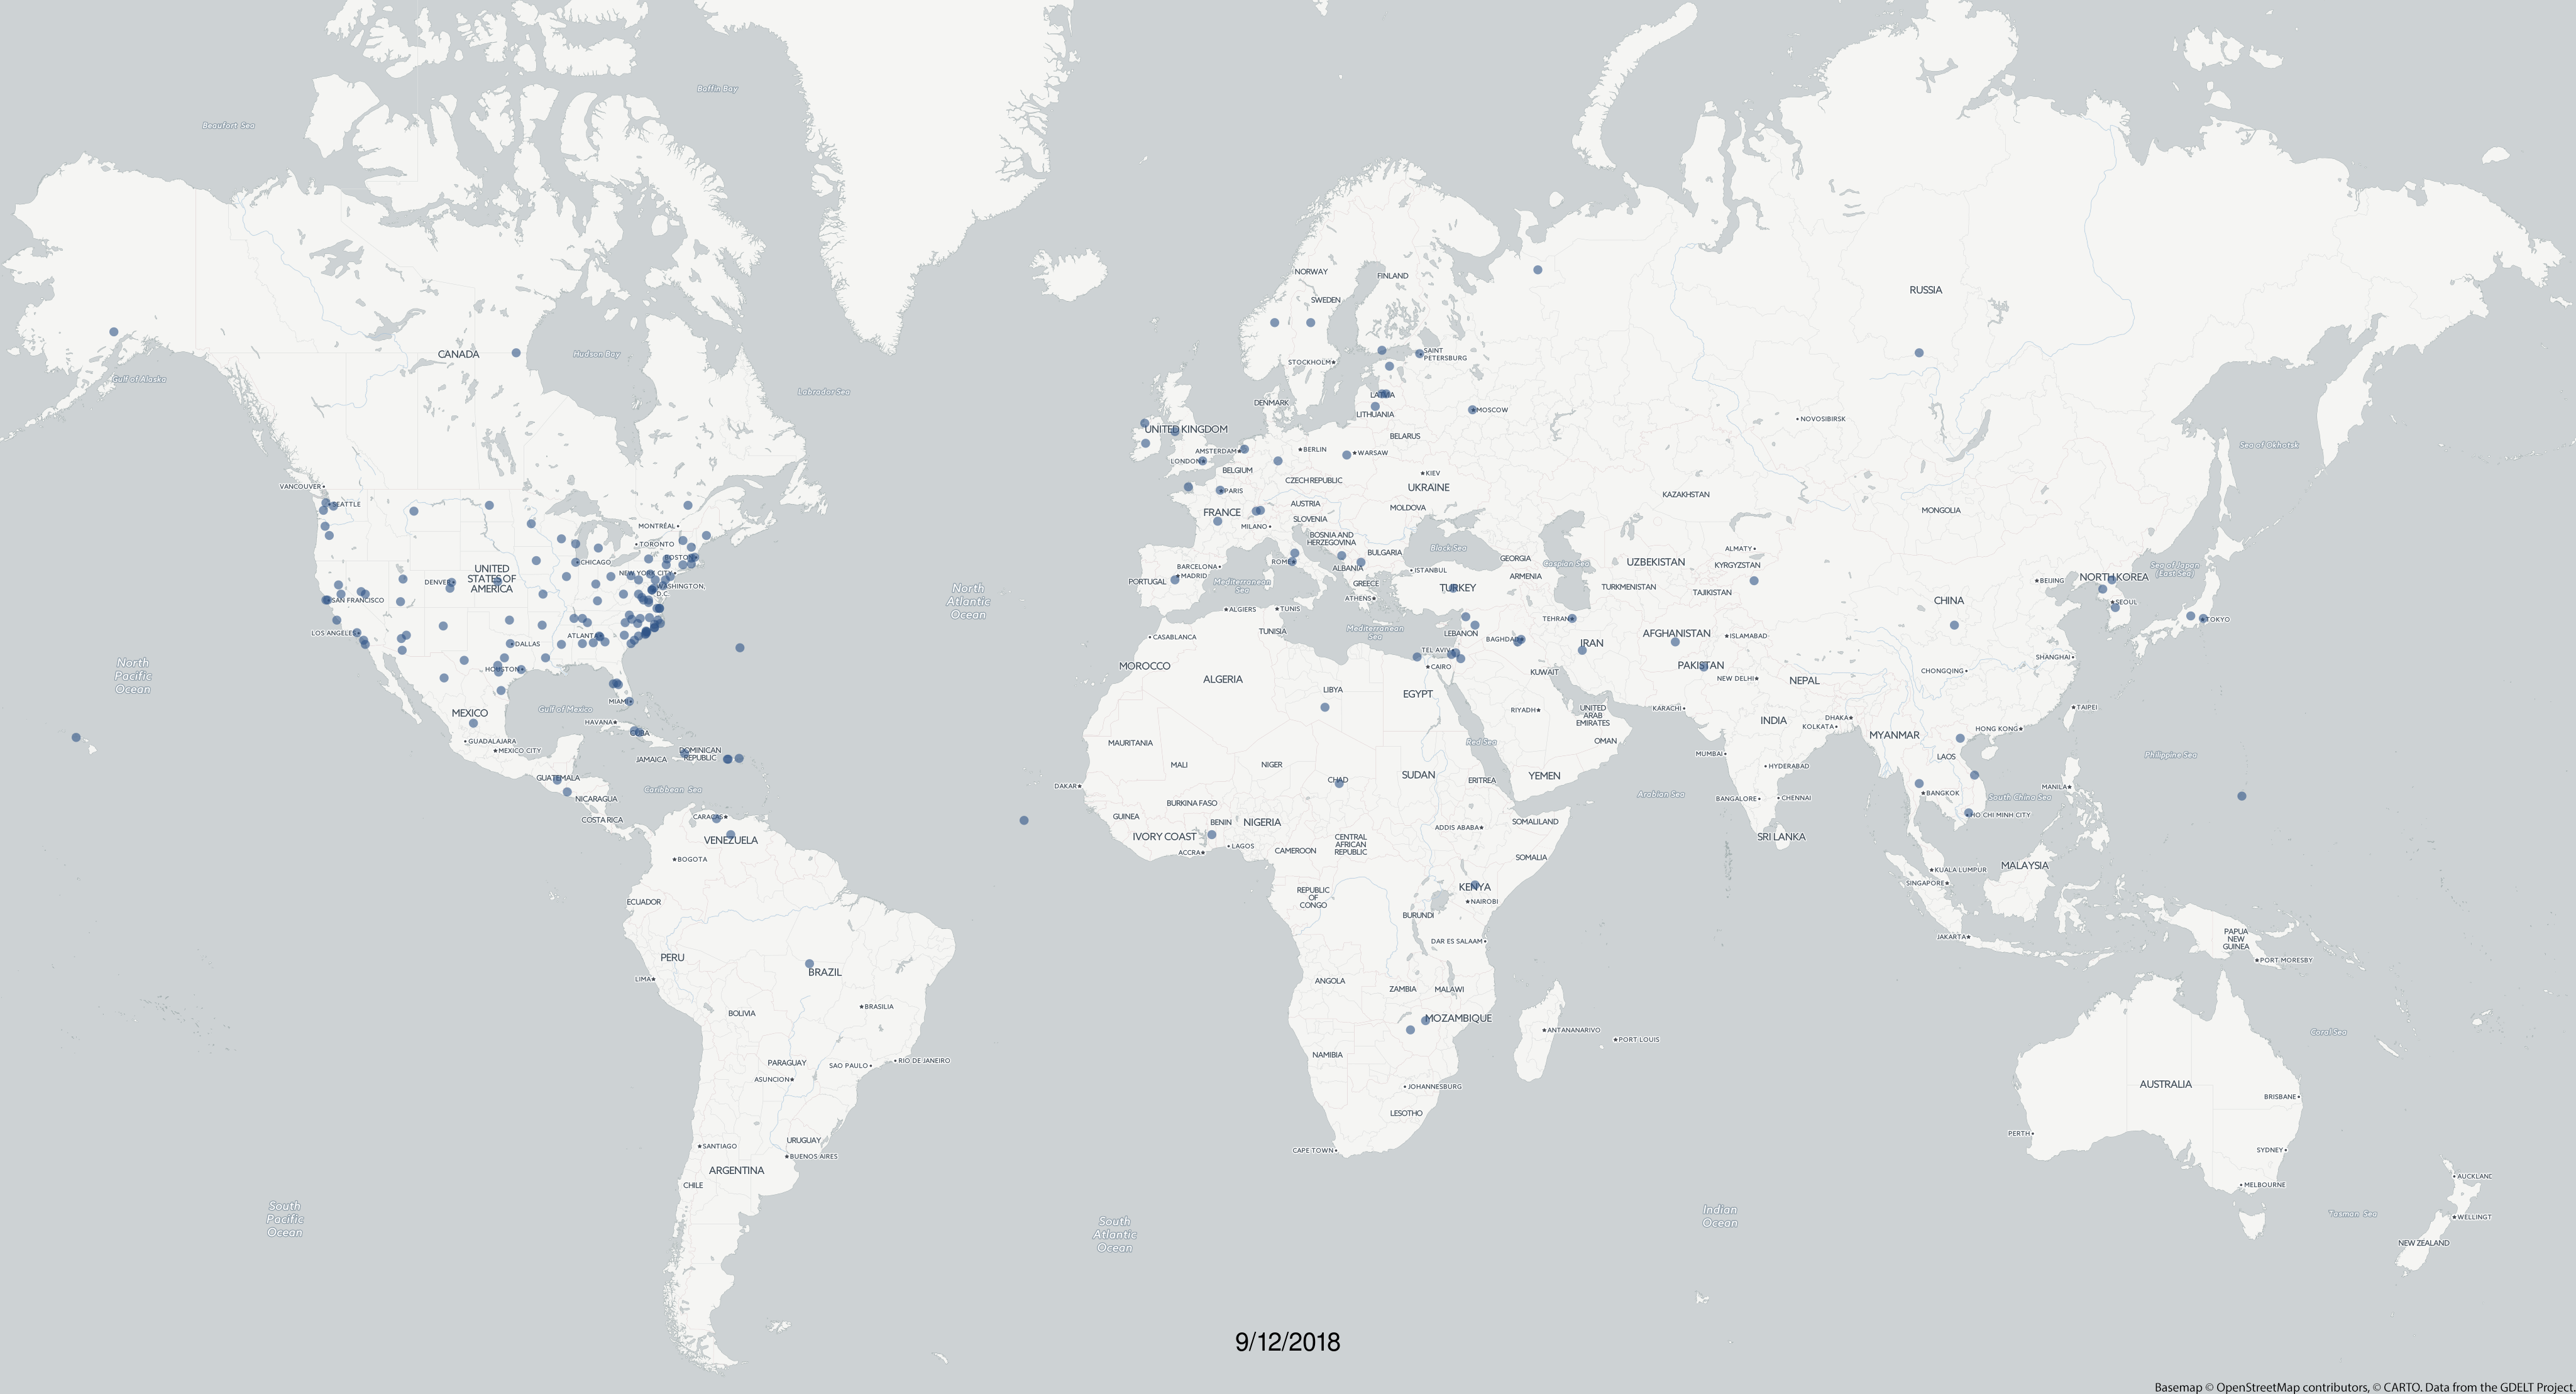
The animation below shows the combined geographic focus of CNN, Fox News and MSNBC over the past decade. It is available in the following formats:
- YouTube. You can watch the full animation on YouTube in its native 4K resolution or any desired lower resolution.
- Raw MPEG. You can also download the raw 4k MPEG movie file (H.264 / yuv420p).
- Raw Video Frames. You can download the individual video frames (one per day) as PNG images using the URL format "http://data.gdeltproject.org/blog/2018-television-news-geography-2009-2018-movies/frames-cnn_msnbc_fox/YYYYMMDD.png" and replace "YYYYMMDD" with any date between 20090604 and 20181119. Thus, to download the frame for September 12, 2018 you would use the URL "http://data.gdeltproject.org/blog/2018-television-news-geography-2009-2018-movies/frames-cnn_msnbc_fox/20180912.png".
- CSV Data File. You can also download the raw CSV output of the BigQuery query (see the bottom of this blog post) from which the maps were generated, to create your own maps or spatial analyses.
BBC News 2017-2018
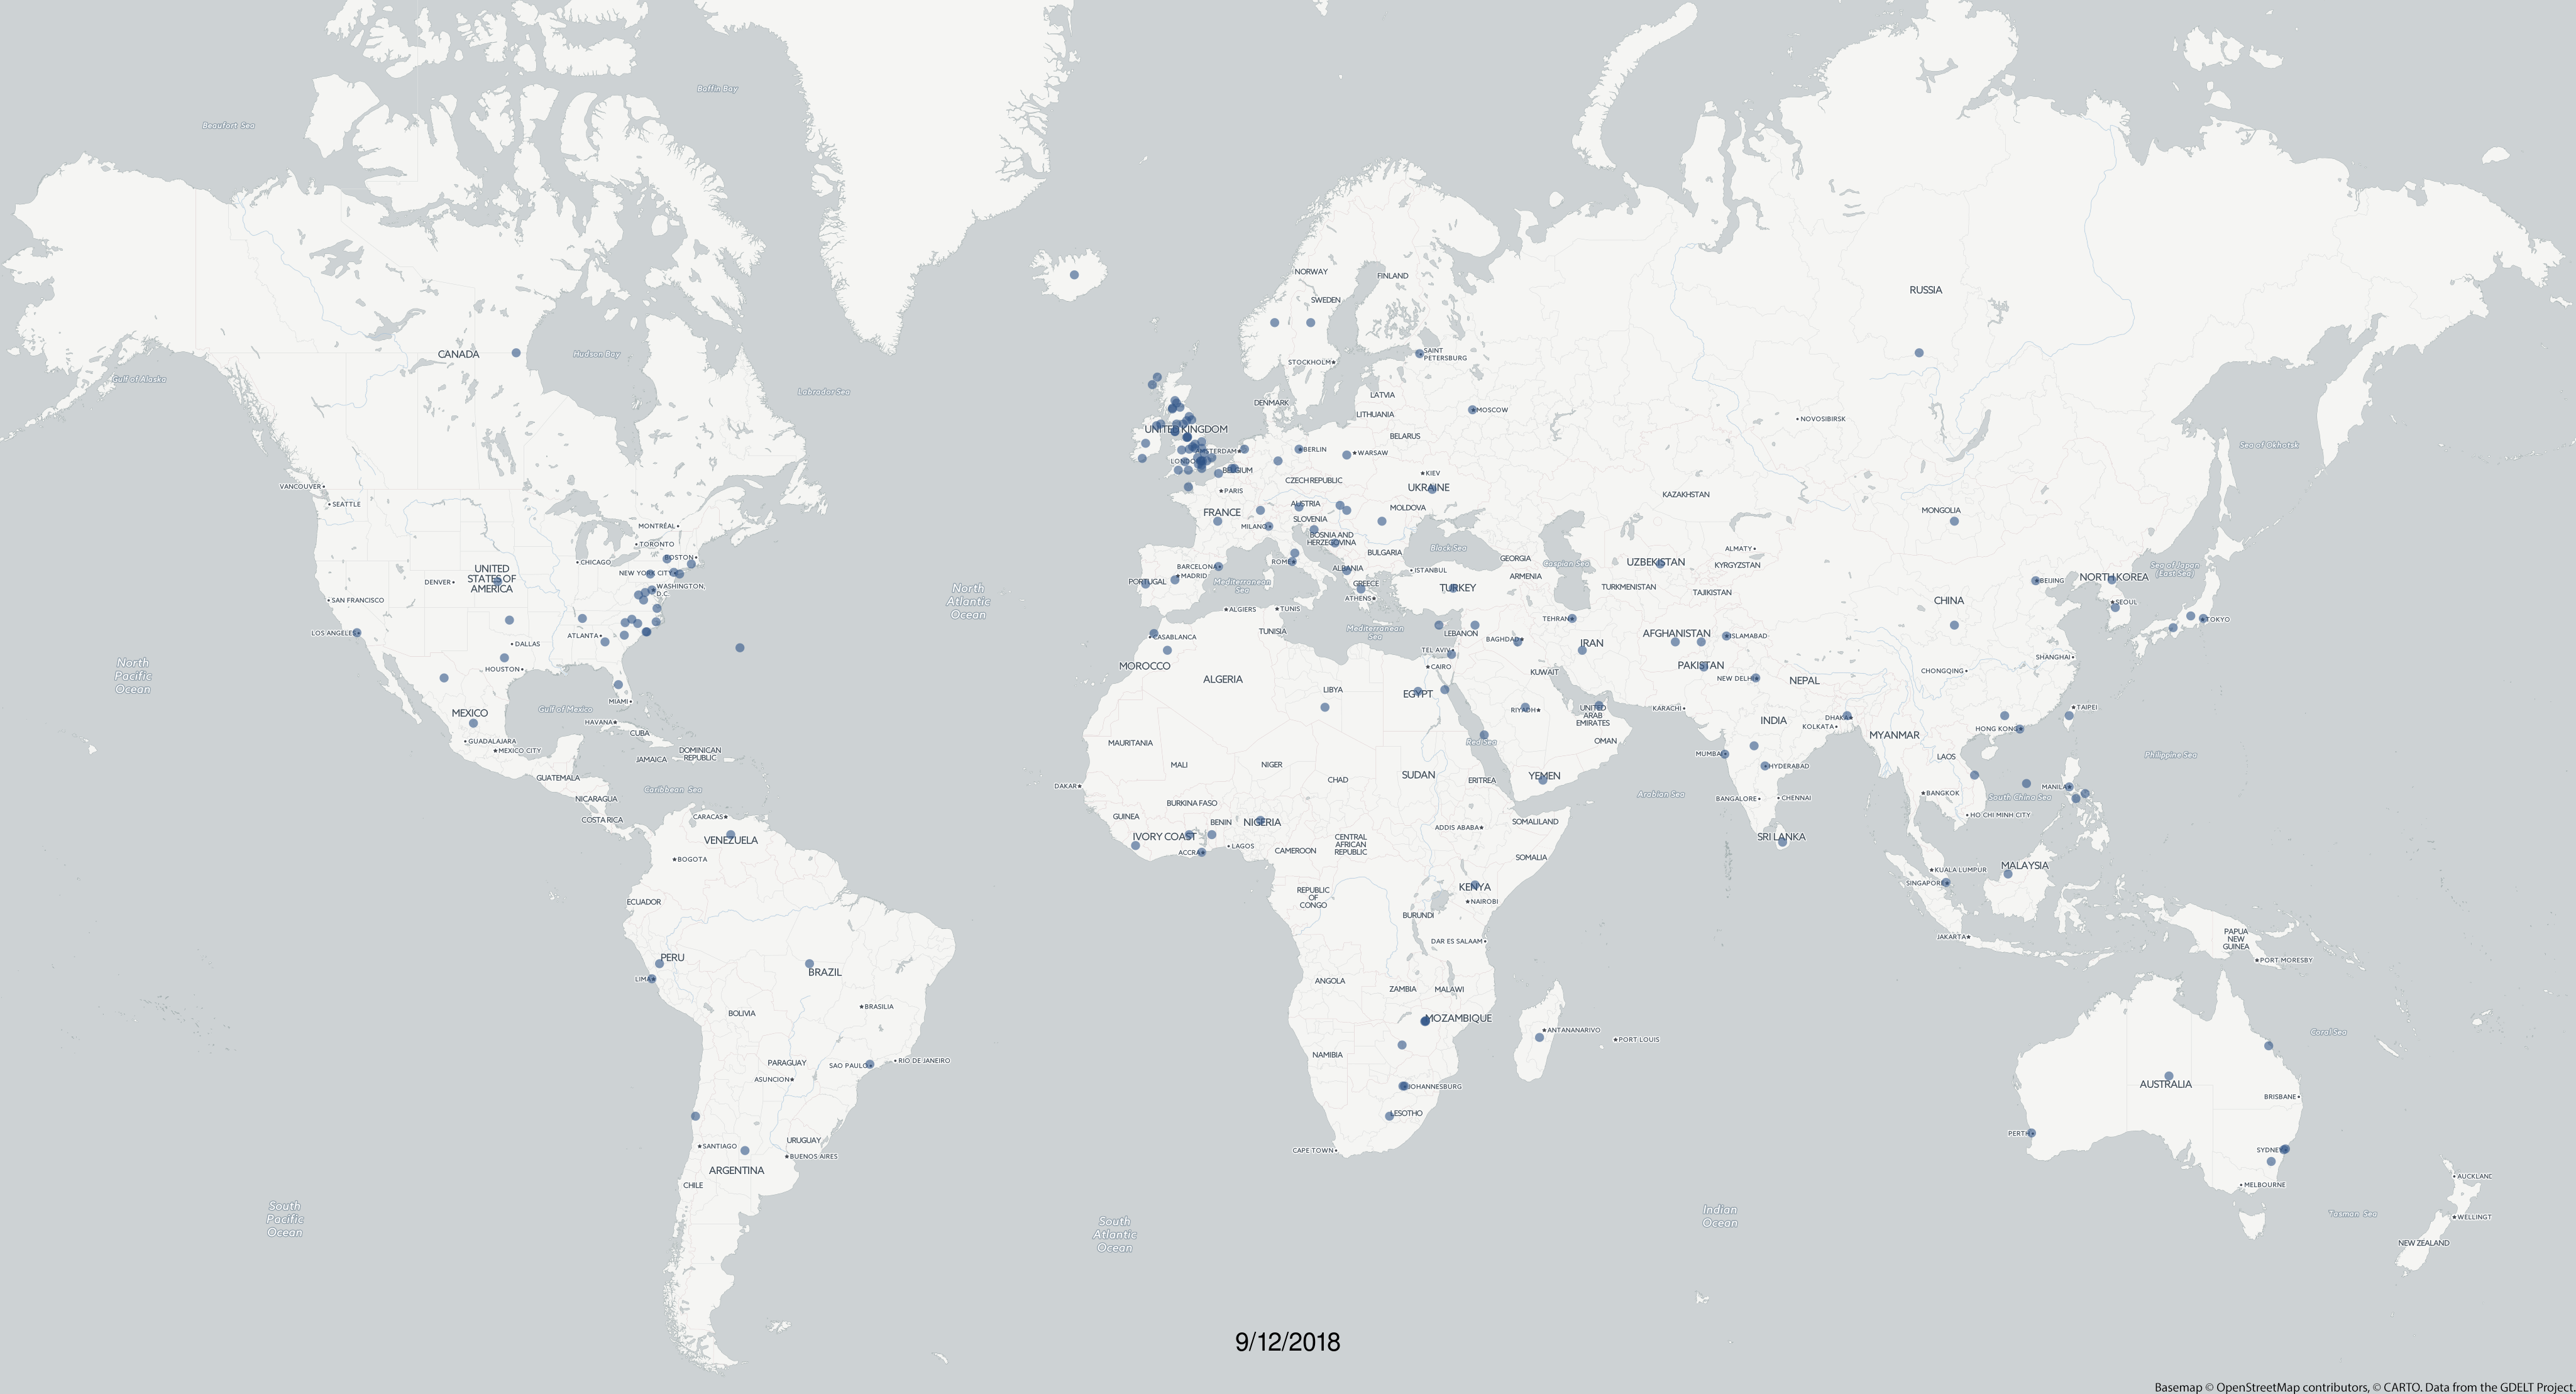
The animation below shows the geographic focus of BBC News London over the past two years. It is available in the following formats:
- YouTube. You can watch the full animation on YouTube in its native 4K resolution or any desired lower resolution.
- Raw MPEG. You can also download the raw 4k MPEG movie file (H.264 / yuv420p).
- Raw Video Frames. You can download the individual video frames (one per day) as PNG images using the URL format "http://data.gdeltproject.org/blog/2018-television-news-geography-2009-2018-movies/frames-bbc/YYYYMMDD.png" and replace "YYYYMMDD" with any date between 20161222 and 20181119. Thus, to download the frame for September 12, 2018 you would use the URL "http://data.gdeltproject.org/blog/2018-television-news-geography-2009-2018-movies/frames-bbc/20180912.png".
- CSV Data File. You can also download the raw CSV output of the BigQuery query (see the bottom of this blog post) from which the maps were generated, to create your own maps or spatial analyses.
TECHNICAL DETAILS
To create the maps above, we simply used the following two SQL statements with BigQuery and downloaded their results as CSV files (see above to download the two raw CSV files to make your own maps). These were then imported into GDELT's powerful new mapping infrastructure that projected them into Web Mercator (EPSG:3857), styled the points, reprojected them into GraphViz space adjusted for the selected basemap, rendered them using GraphViz's rasterization pipeline, overlaid them on top of the selected basemap (in this case the Carto Positron basemap) and finally appended the date as a text layer overlay. Finally, the PNG sequence was converted into an MPEG movie using ffmpeg. GDELT's new mapping system automates this entire workflow, accepting as input the raw results of the two BigQuery queries below and automatically distributing the workload in these two cases across 32 cores and 200GB of RAM backed by Local SSD, outputting to GCS, allowing one-click mapping from BigQuery GDELT queries directly into a final polished animation, uniquely tailored for GDELT's geographic data.
For those interested in mapping only portions of the world, you can use the countrycode and ADM1 codes in the CSV files to filter to geographic subsets.
select DATE, max(latitude) latitude, max(longitude) longitude, max(countrycode) countrycode, max(adm1code) adm1code, featureid, max(featuretype) featuretype, count(1) cnt from (
SELECT REGEXP_EXTRACT(SPLIT(V2Locations,';'),r'(^[0-5])#') as featuretype,
REGEXP_EXTRACT(SPLIT(V2Locations,';'),r'^[0-5]#.*?#(.*?)#') as countrycode,
REGEXP_EXTRACT(SPLIT(V2Locations,';'),r'^[0-5]#.*?#.*?#(.*?)#') as adm1code,
REGEXP_EXTRACT(SPLIT(V2Locations,';'),r'^[0-5]#.*?#.*?#.*?#.*?#(.*?)#') as latitude,
REGEXP_EXTRACT(SPLIT(V2Locations,';'),r'^[0-5]#.*?#.*?#.*?#.*?#.*?#(.*?)#') as longitude,
REGEXP_EXTRACT(SPLIT(V2Locations,';'),r'^[0-5]#.*?#.*?#.*?#.*?#.*?#.*?#(.*?)#') as featureid,
FLOAT(REGEXP_REPLACE(V2Tone, r',.*', "")) tone,
substr(string(DATE), 1, 8) DATE
FROM [gdeltv2.iatvgkg] where (SourceCommonName ='CNN' or SourceCommonName ='CNNW' or SourceCommonName ='MSNBC' or SourceCommonName ='MSNBCW' or SourceCommonName ='FOXNEWS' or SourceCommonName ='FOXNEWSW')
) where featureid is not null group by DATE, featureid order by DATE asc
select DATE, max(latitude) latitude, max(longitude) longitude, max(countrycode) countrycode, max(adm1code) adm1code, featureid, max(featuretype) featuretype, count(1) cnt from (
SELECT REGEXP_EXTRACT(SPLIT(V2Locations,';'),r'(^[0-5])#') as featuretype,
REGEXP_EXTRACT(SPLIT(V2Locations,';'),r'^[0-5]#.*?#(.*?)#') as countrycode,
REGEXP_EXTRACT(SPLIT(V2Locations,';'),r'^[0-5]#.*?#.*?#(.*?)#') as adm1code,
REGEXP_EXTRACT(SPLIT(V2Locations,';'),r'^[0-5]#.*?#.*?#.*?#.*?#(.*?)#') as latitude,
REGEXP_EXTRACT(SPLIT(V2Locations,';'),r'^[0-5]#.*?#.*?#.*?#.*?#.*?#(.*?)#') as longitude,
REGEXP_EXTRACT(SPLIT(V2Locations,';'),r'^[0-5]#.*?#.*?#.*?#.*?#.*?#.*?#(.*?)#') as featureid,
FLOAT(REGEXP_REPLACE(V2Tone, r',.*', "")) tone,
substr(string(DATE), 1, 8) DATE
FROM [gdeltv2.iatvgkg] where (SourceCommonName ='BBCNEWS')
) where featureid is not null group by DATE, featureid order by DATE asc