With the release of the massive new 3.8-billion-edge Web Entities graph encoding the co-occurrences of entity annotations generated by Google's Cloud Vision API over half a billion global news images, a vast world of visual analyses become possible.
Given the the entire graph is is Gephi's edge list format, a single SQL query in BigQuery is all that's required to extract a subgraph suitable for direct import and rendering in Gephi.
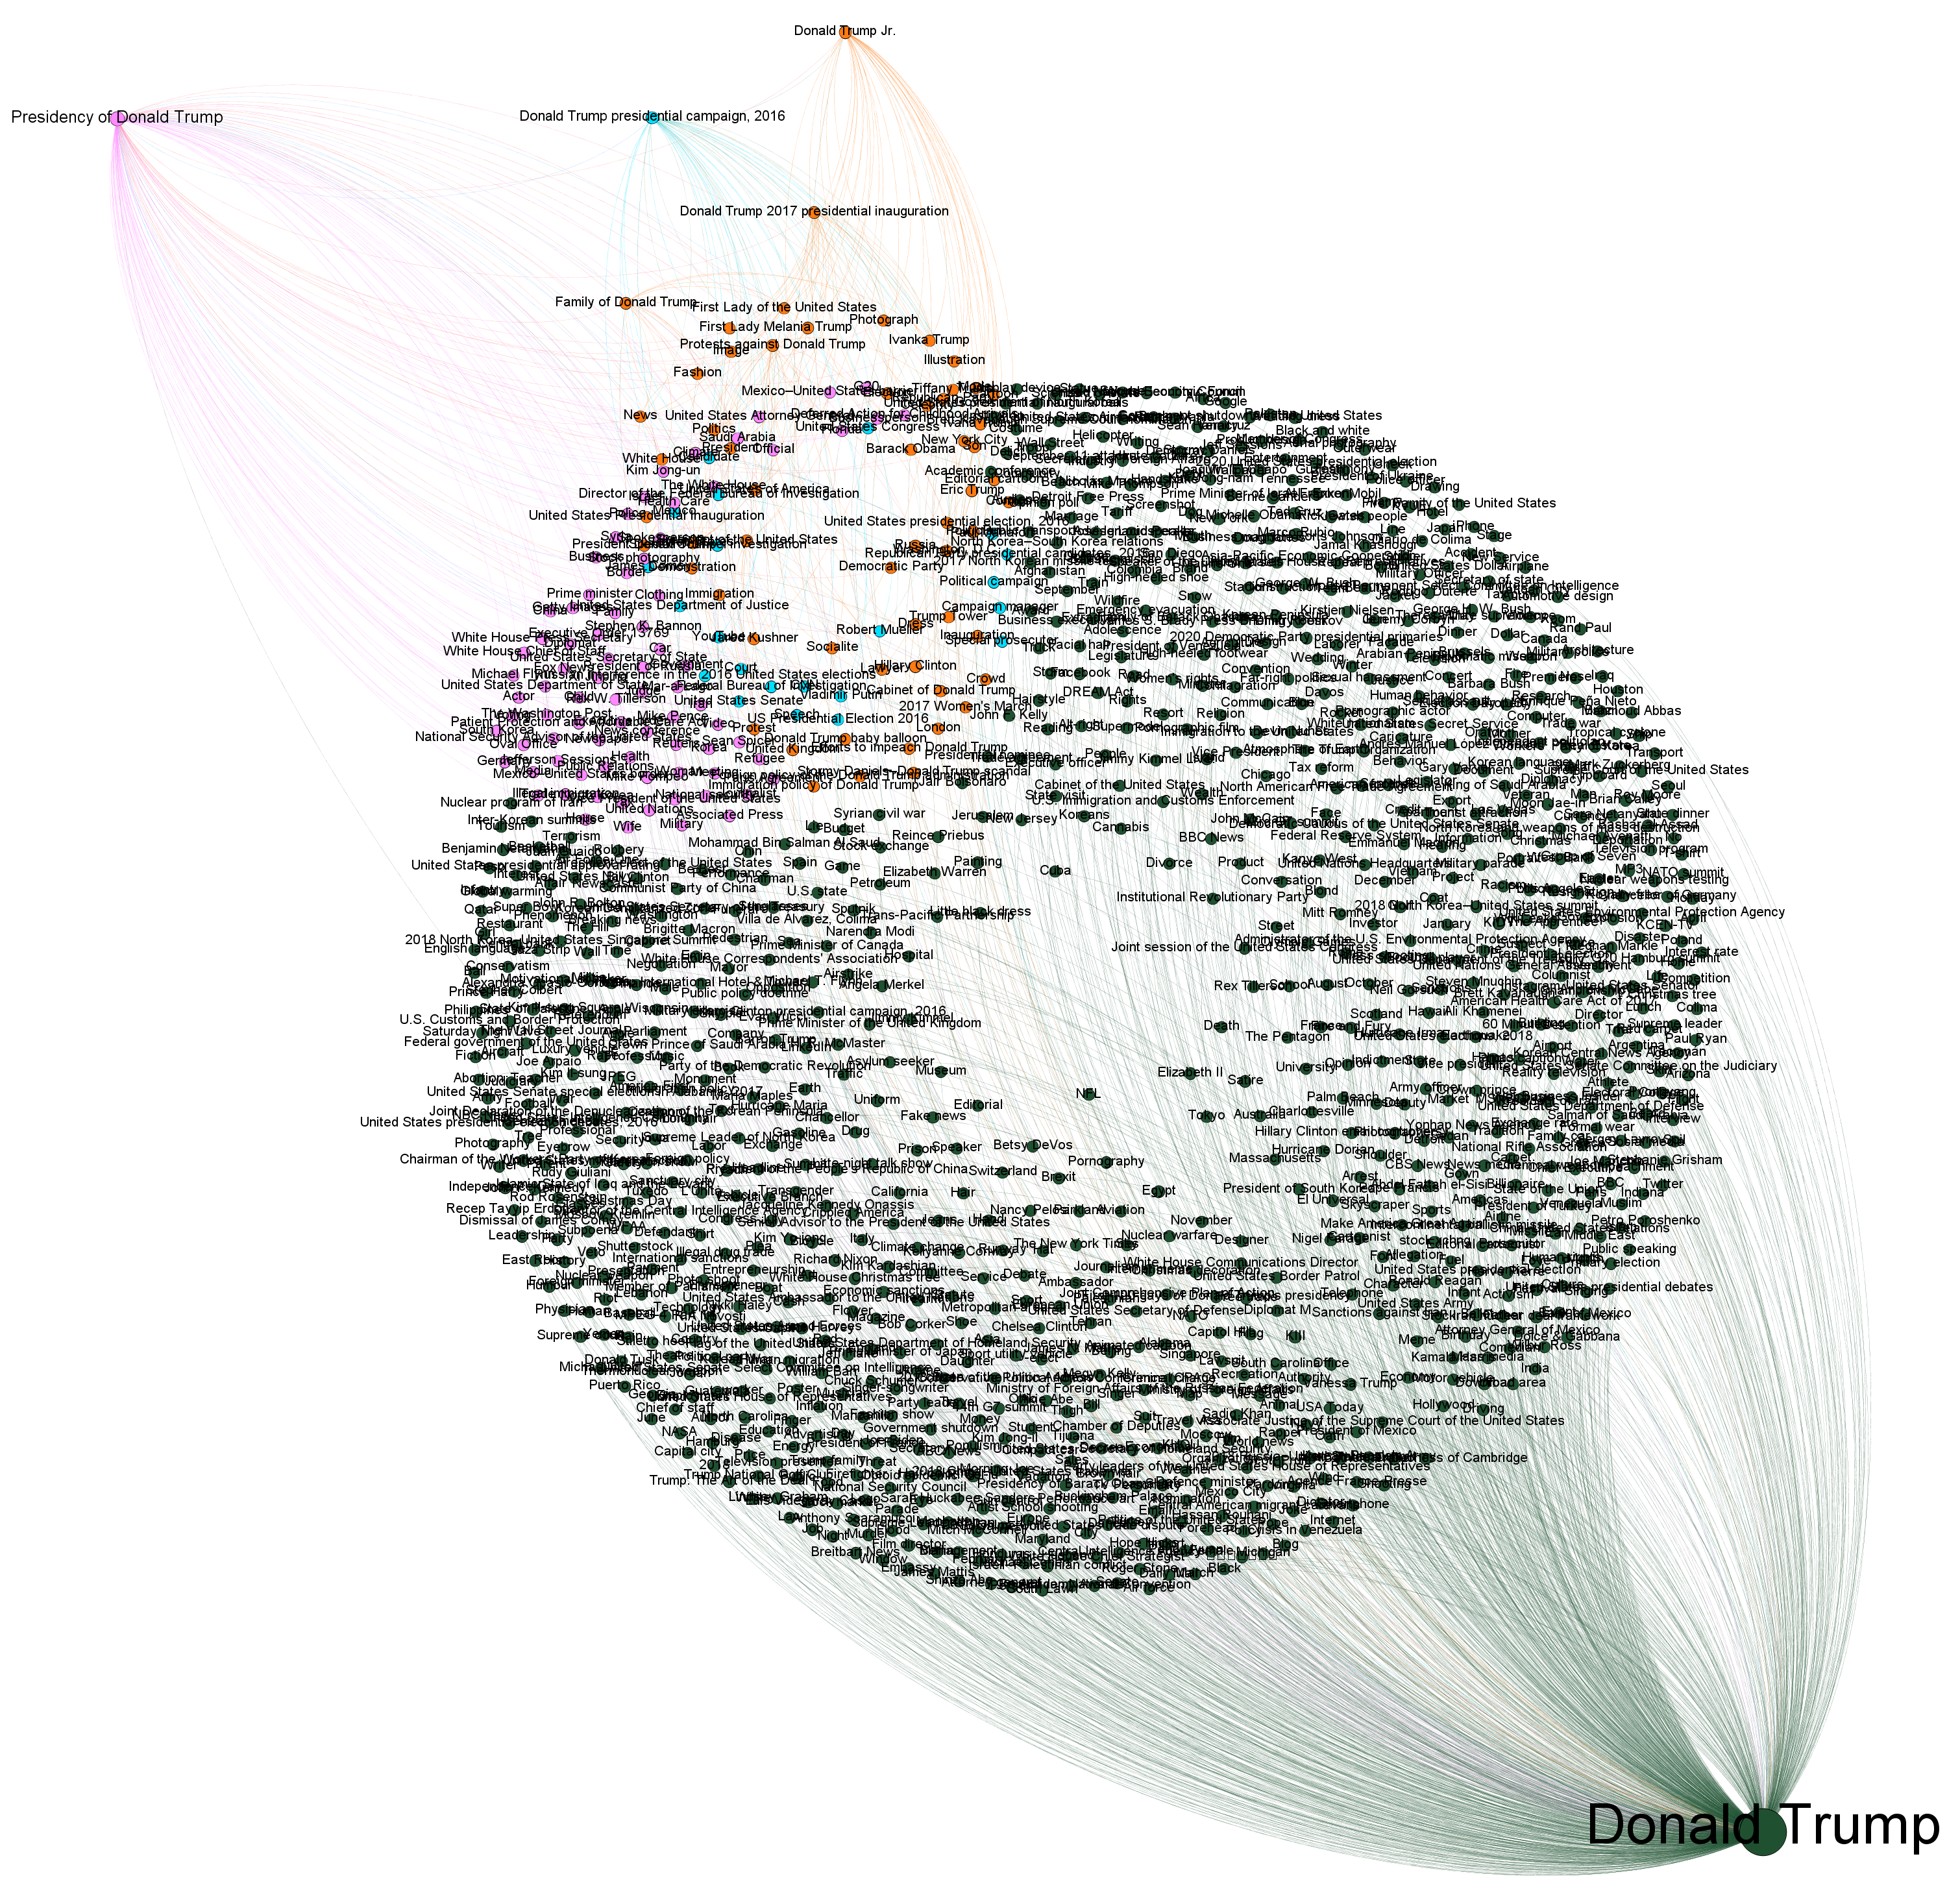
The image below shows the result of extracting the subgraph centered on "Donald Trump":
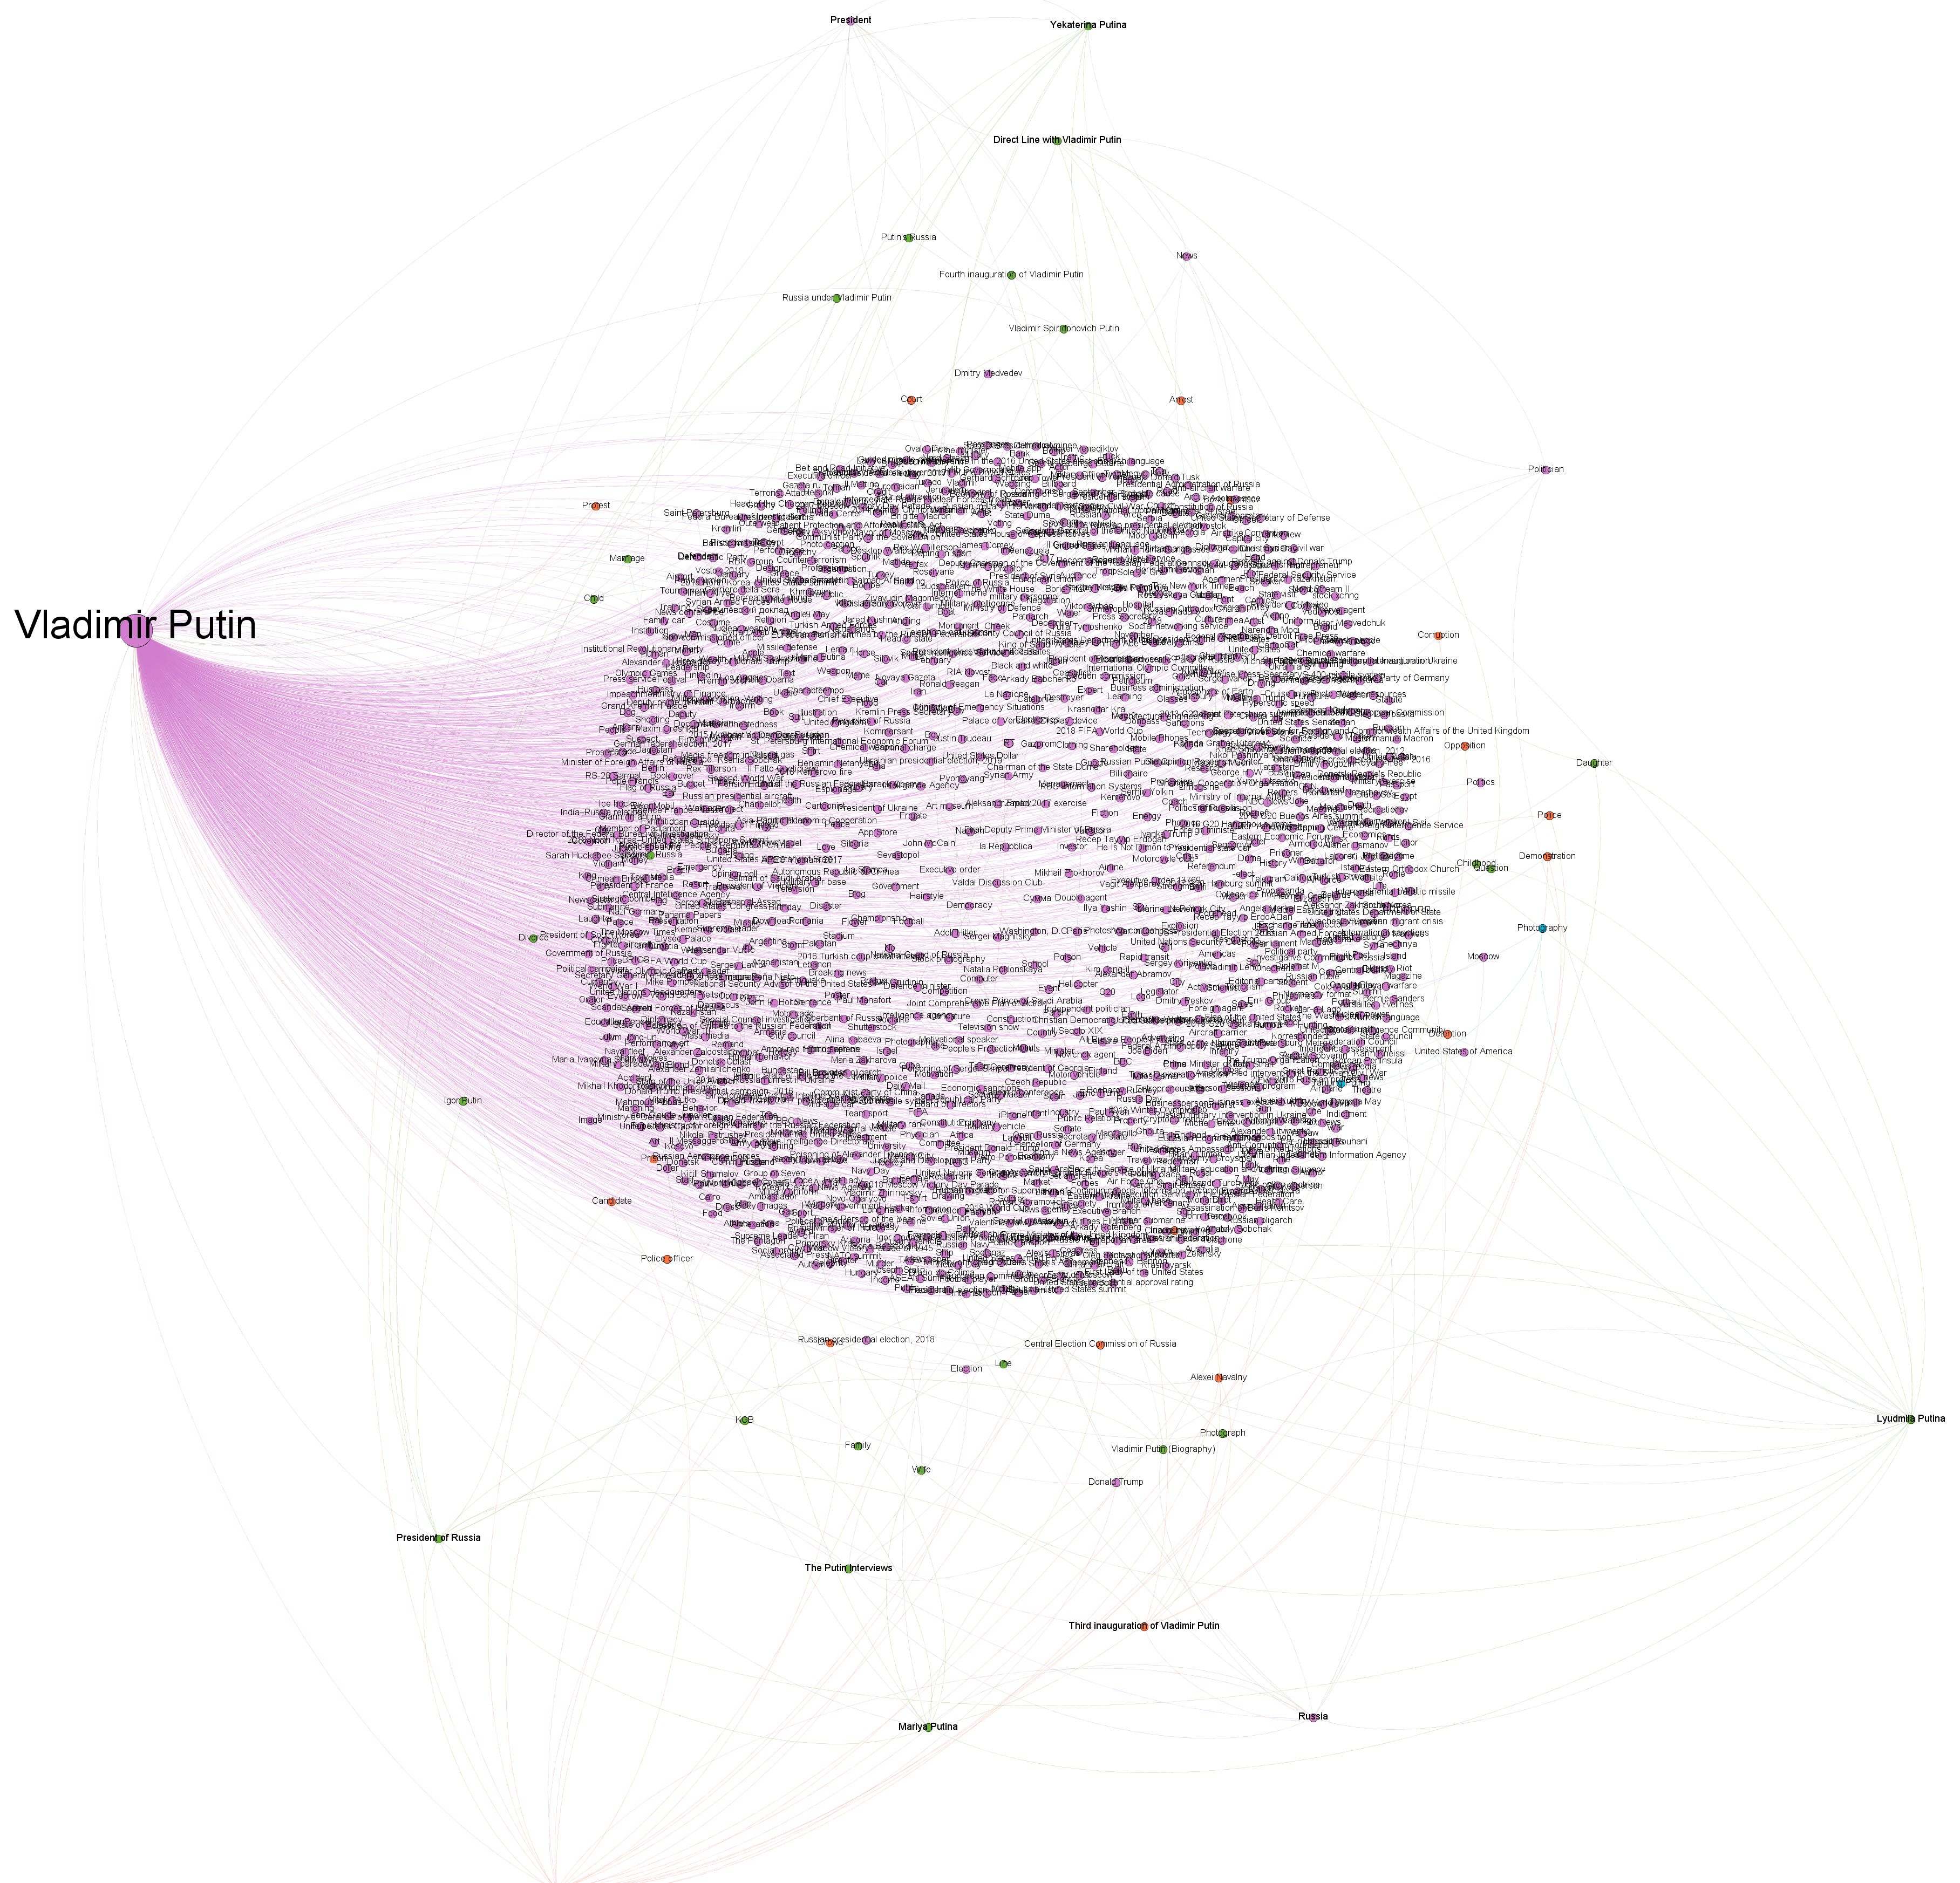
And here is the same process used to extract the subgraph around "Putin":
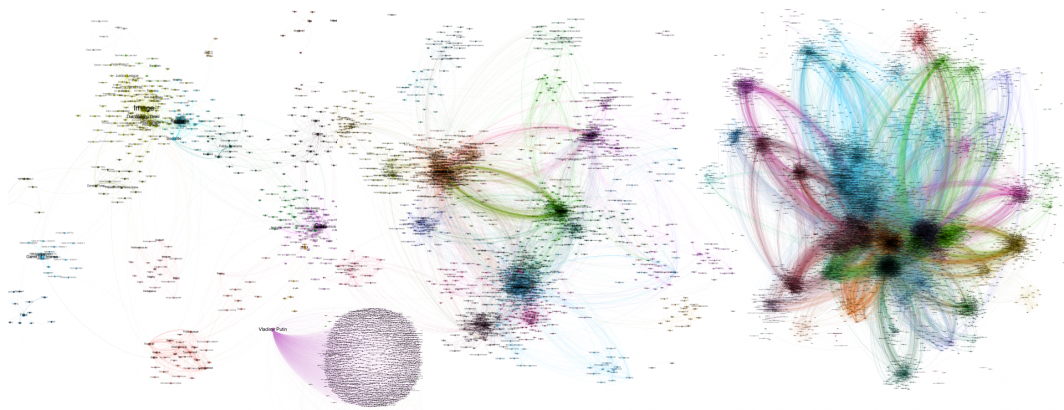
What about larger macro-scale subgraphs? The image below shows the top 1,500 strongest edges extracted from the graph. These are not the most common entities, but rather the most common relationships, which reflect a narrow subset of tightly-connected entities. Again , this took a single SQL query.
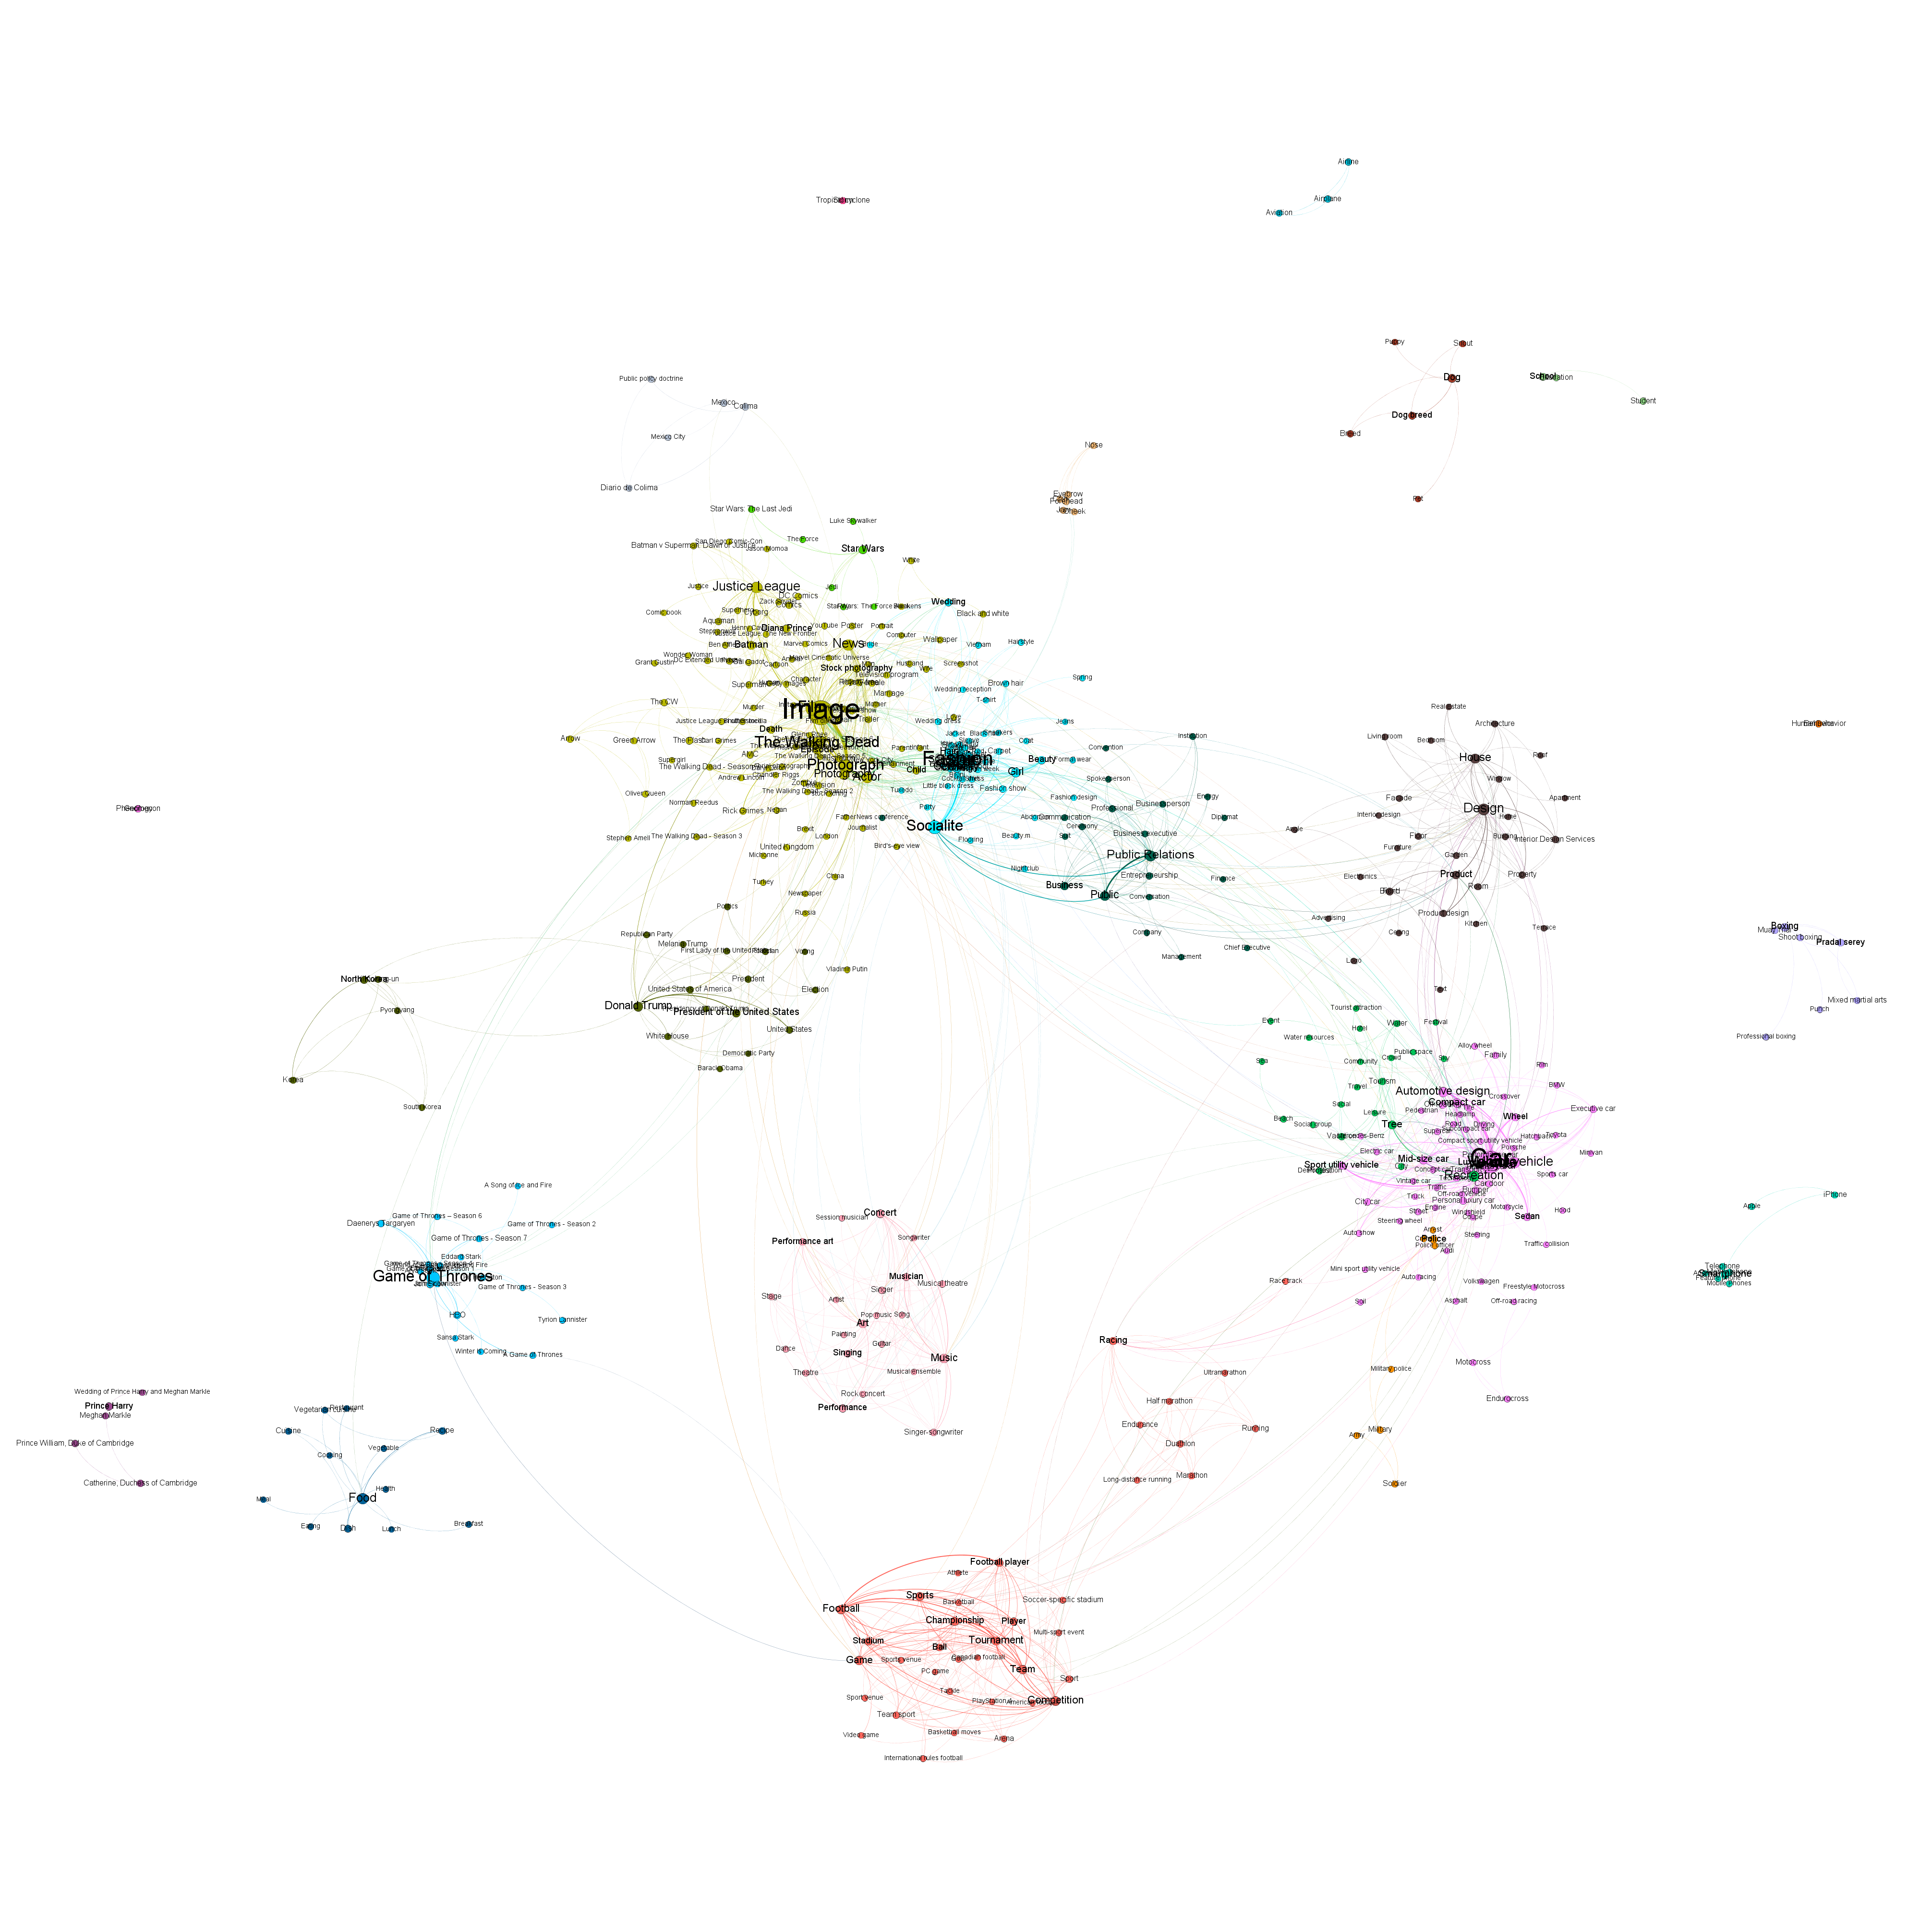
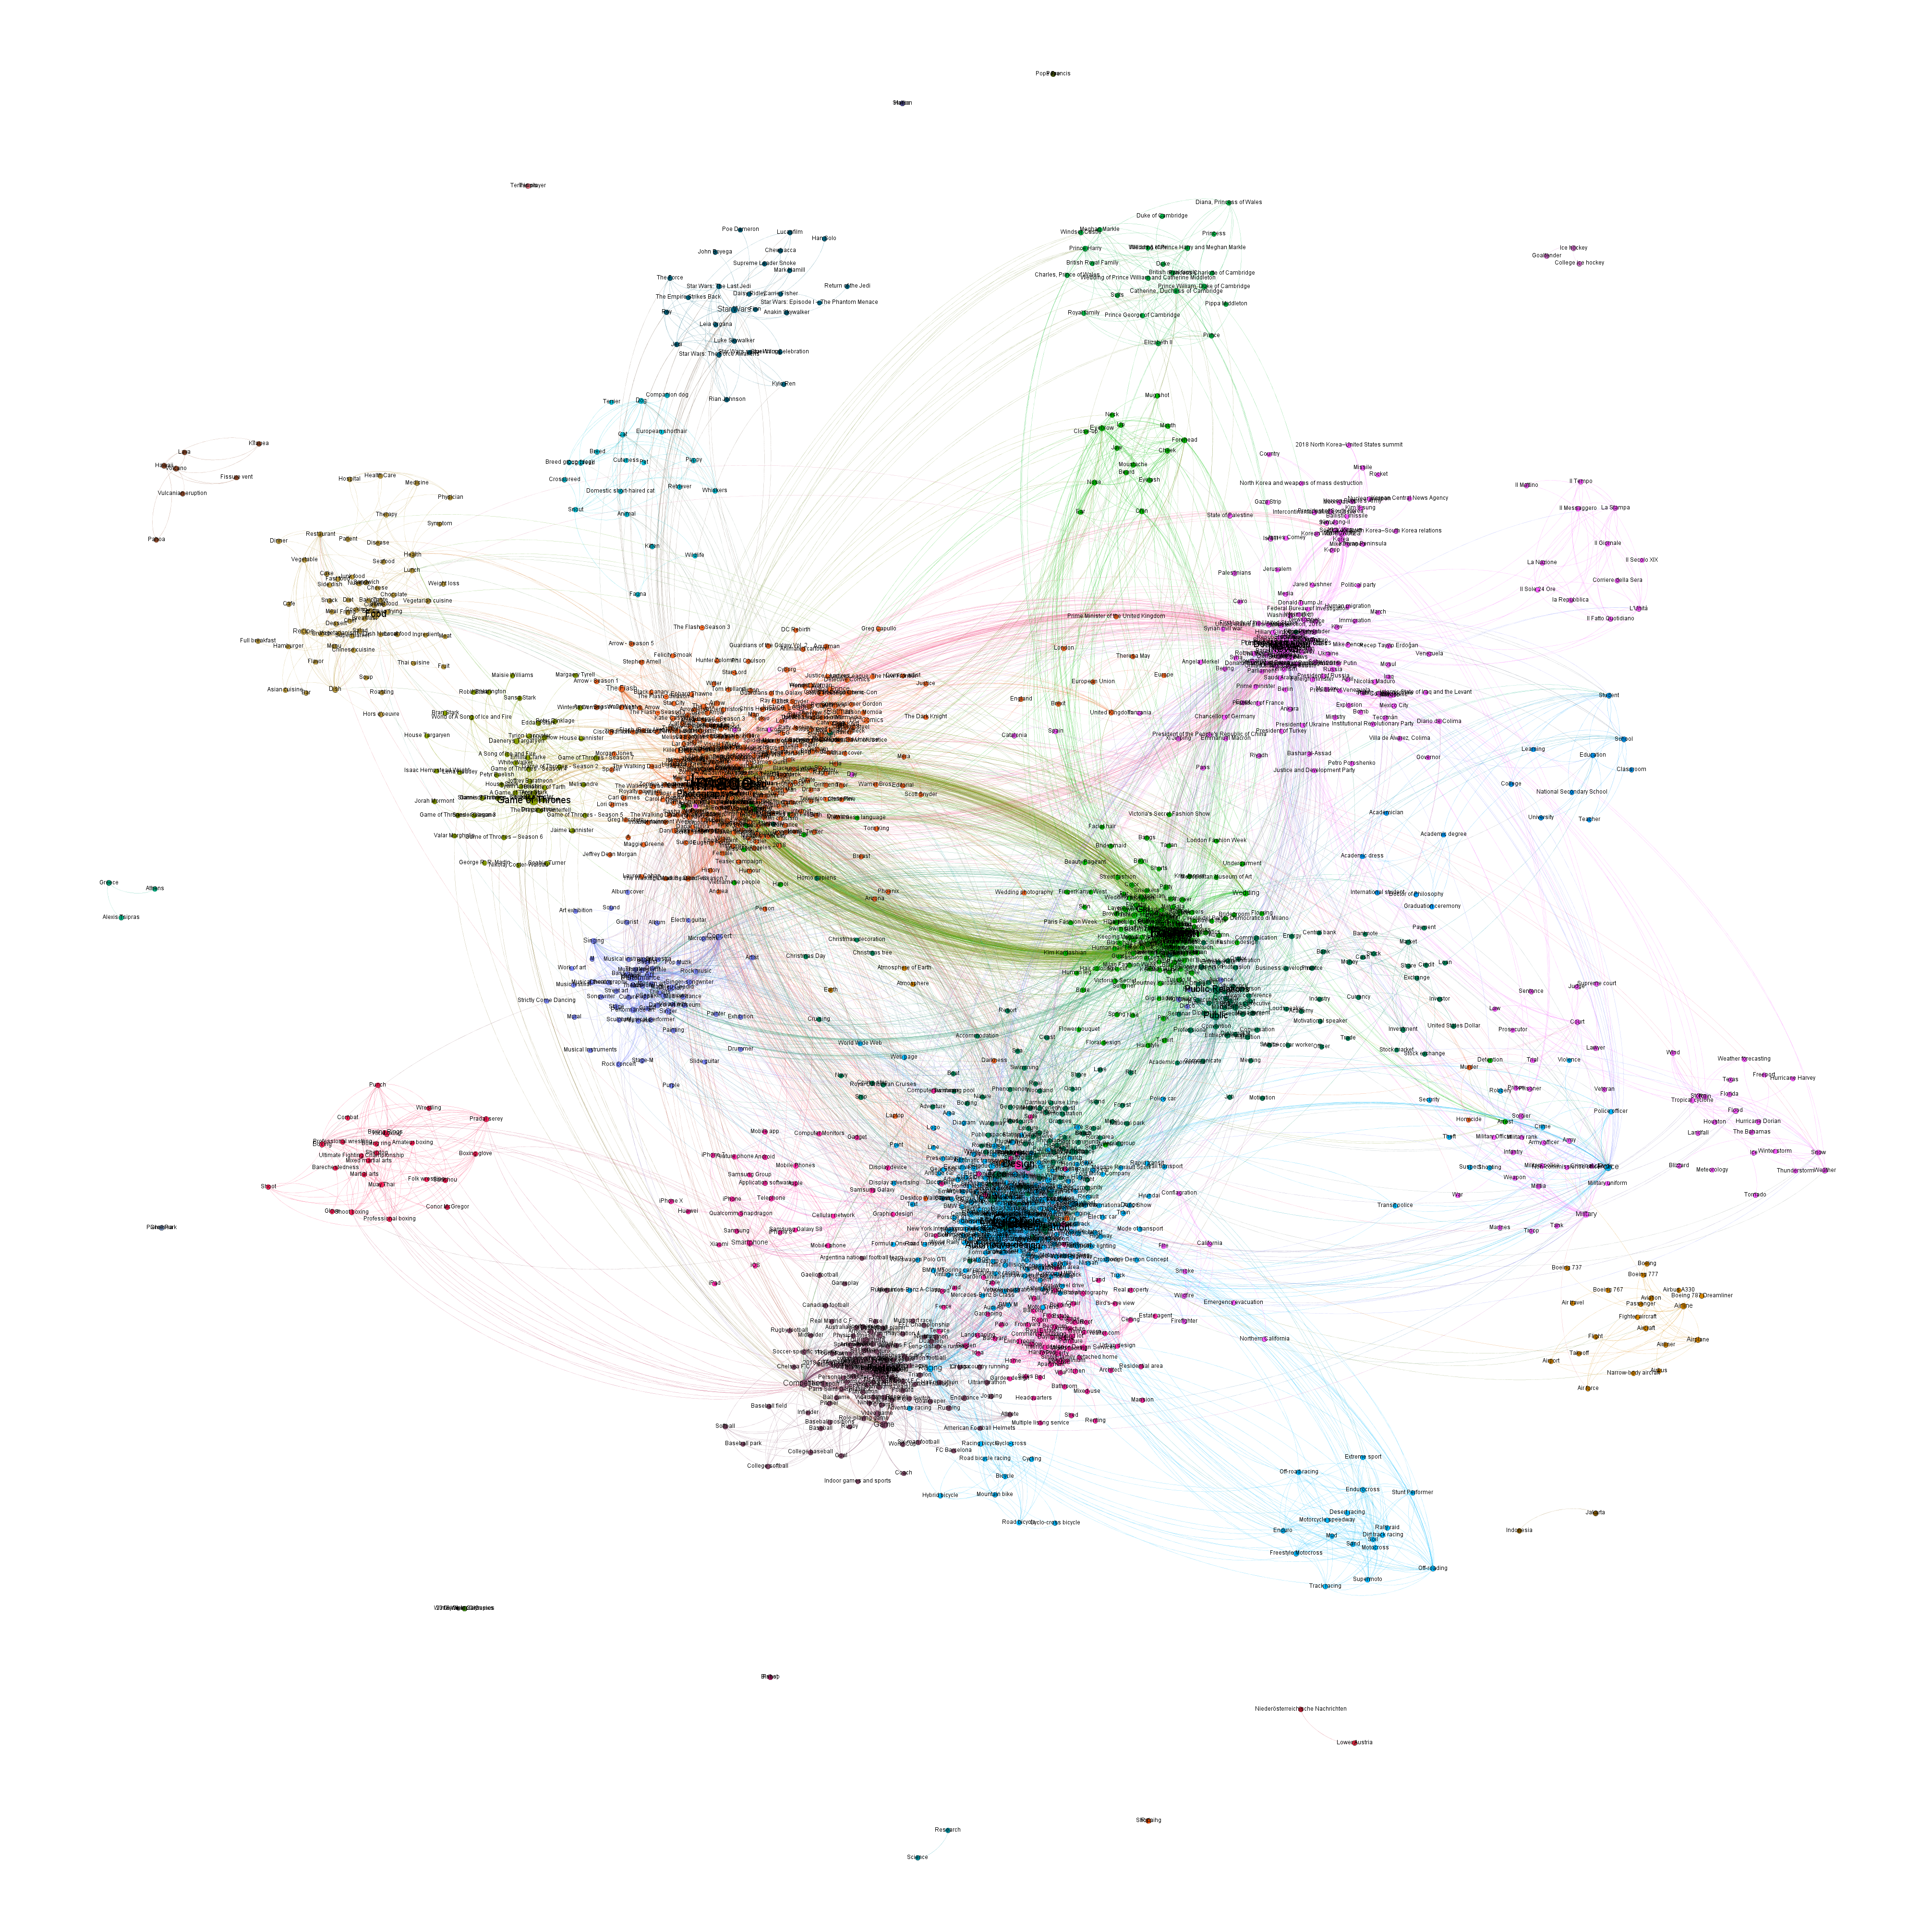
What about increasing this to the top 10,000 edges?
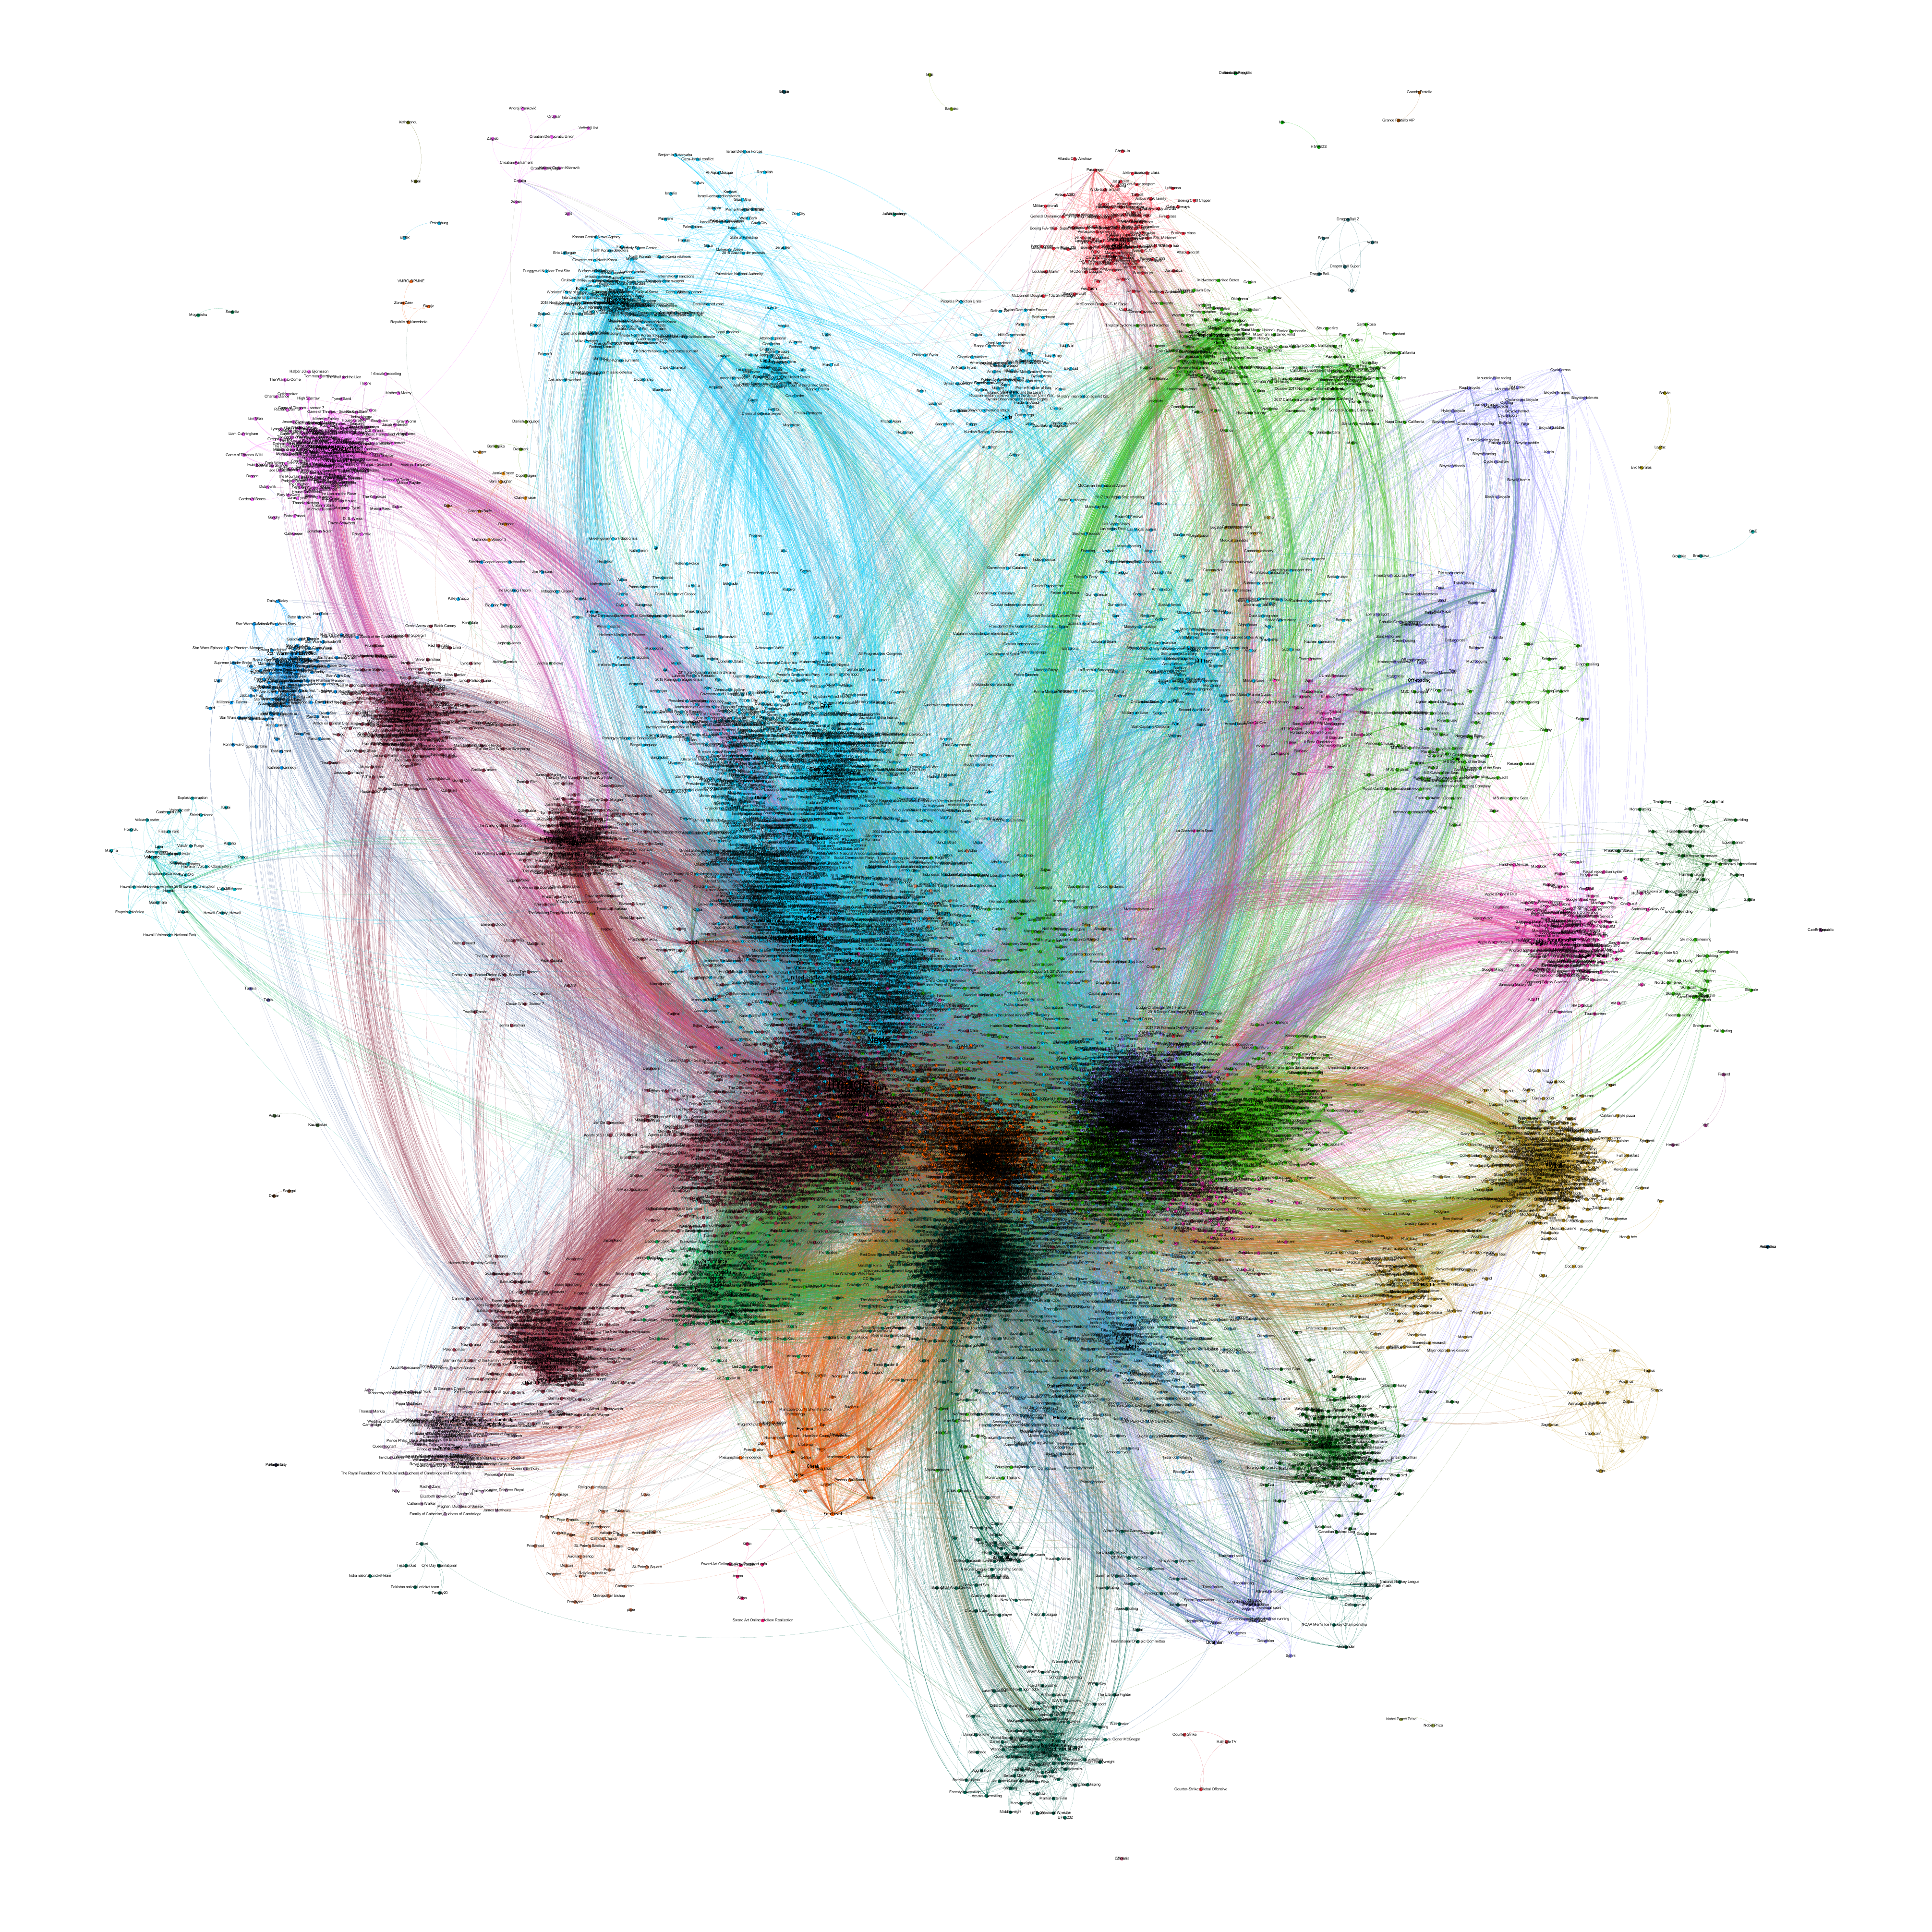
Finally, what would the top 100,000 edges look like, representing 0.0026% of the full 3.8-billion-edge graph?
We're tremendously excited to see what you're able to accomplish with this enormous new graph dataset! Let us know if you come up with an exciting visualization of this dataset, we'd love to feature it on the GDELT Blog!