Earlier today we demonstrated how the new 3.8-billion-edge co-occurrence entity graph can be used for visualizing the local subgraph around entities of interest. Yet its massive scale makes it especially powerful for exploring macro-level patterns around visual representation across the entire world.
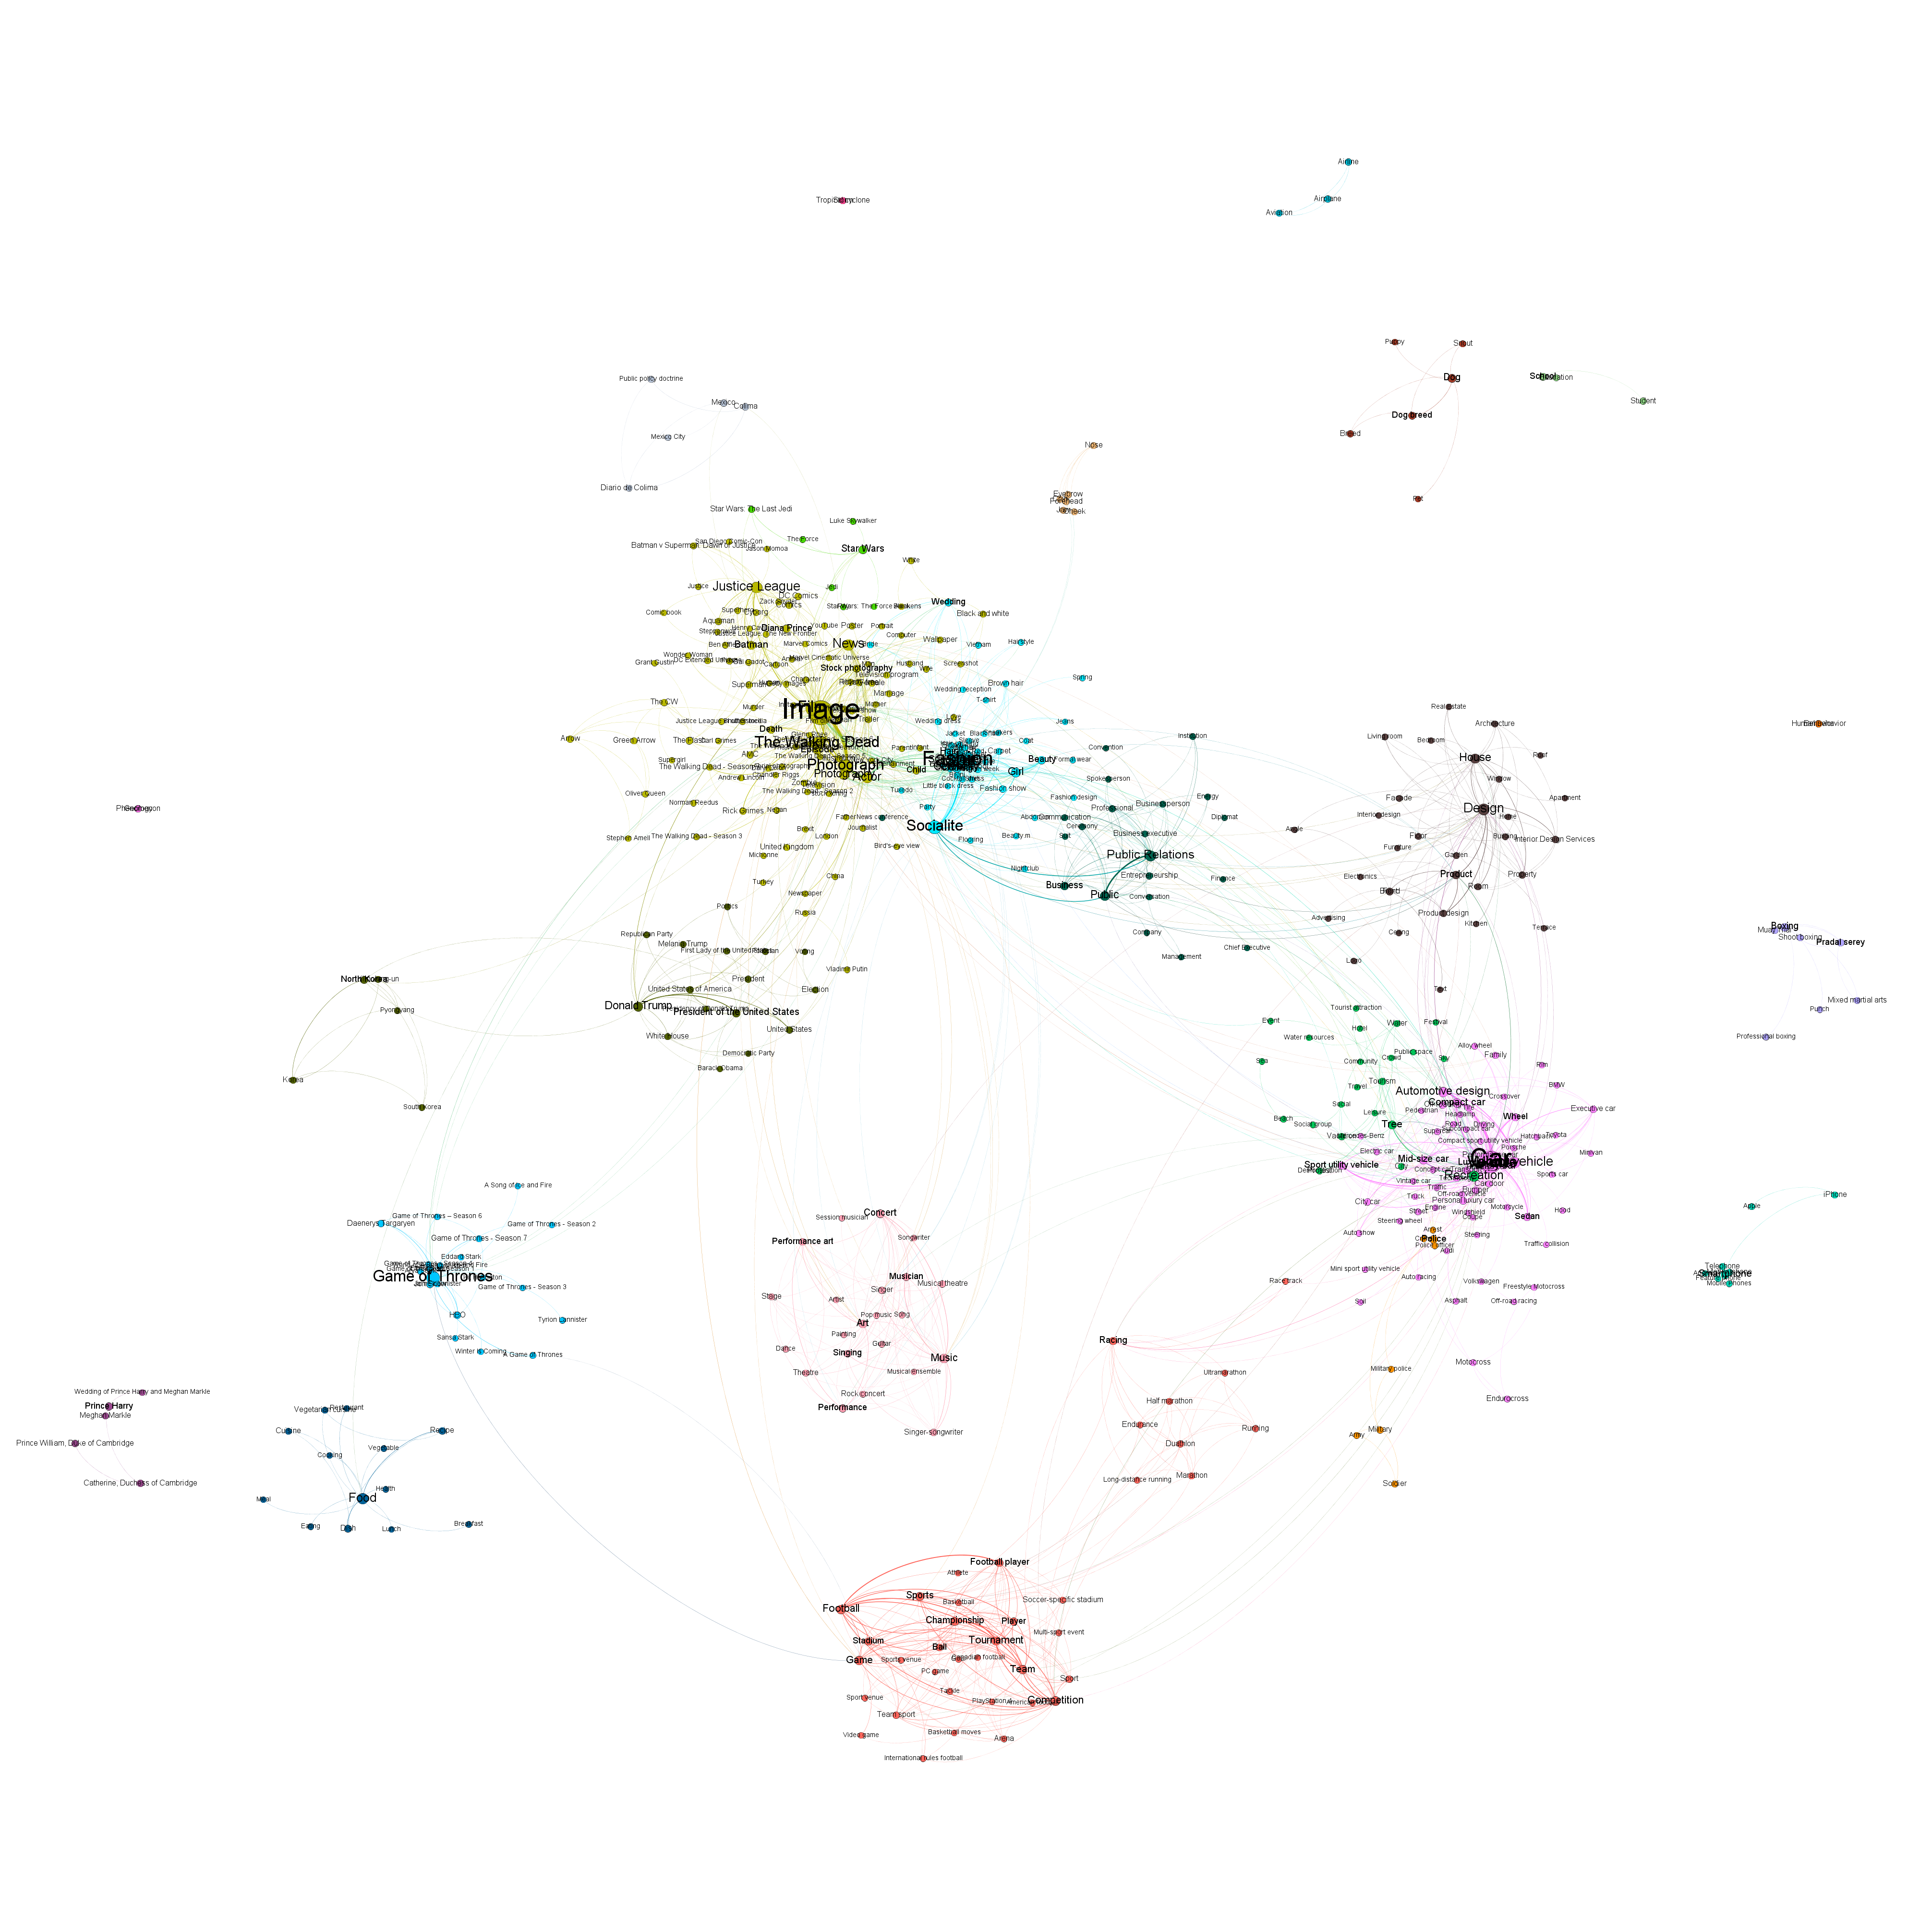
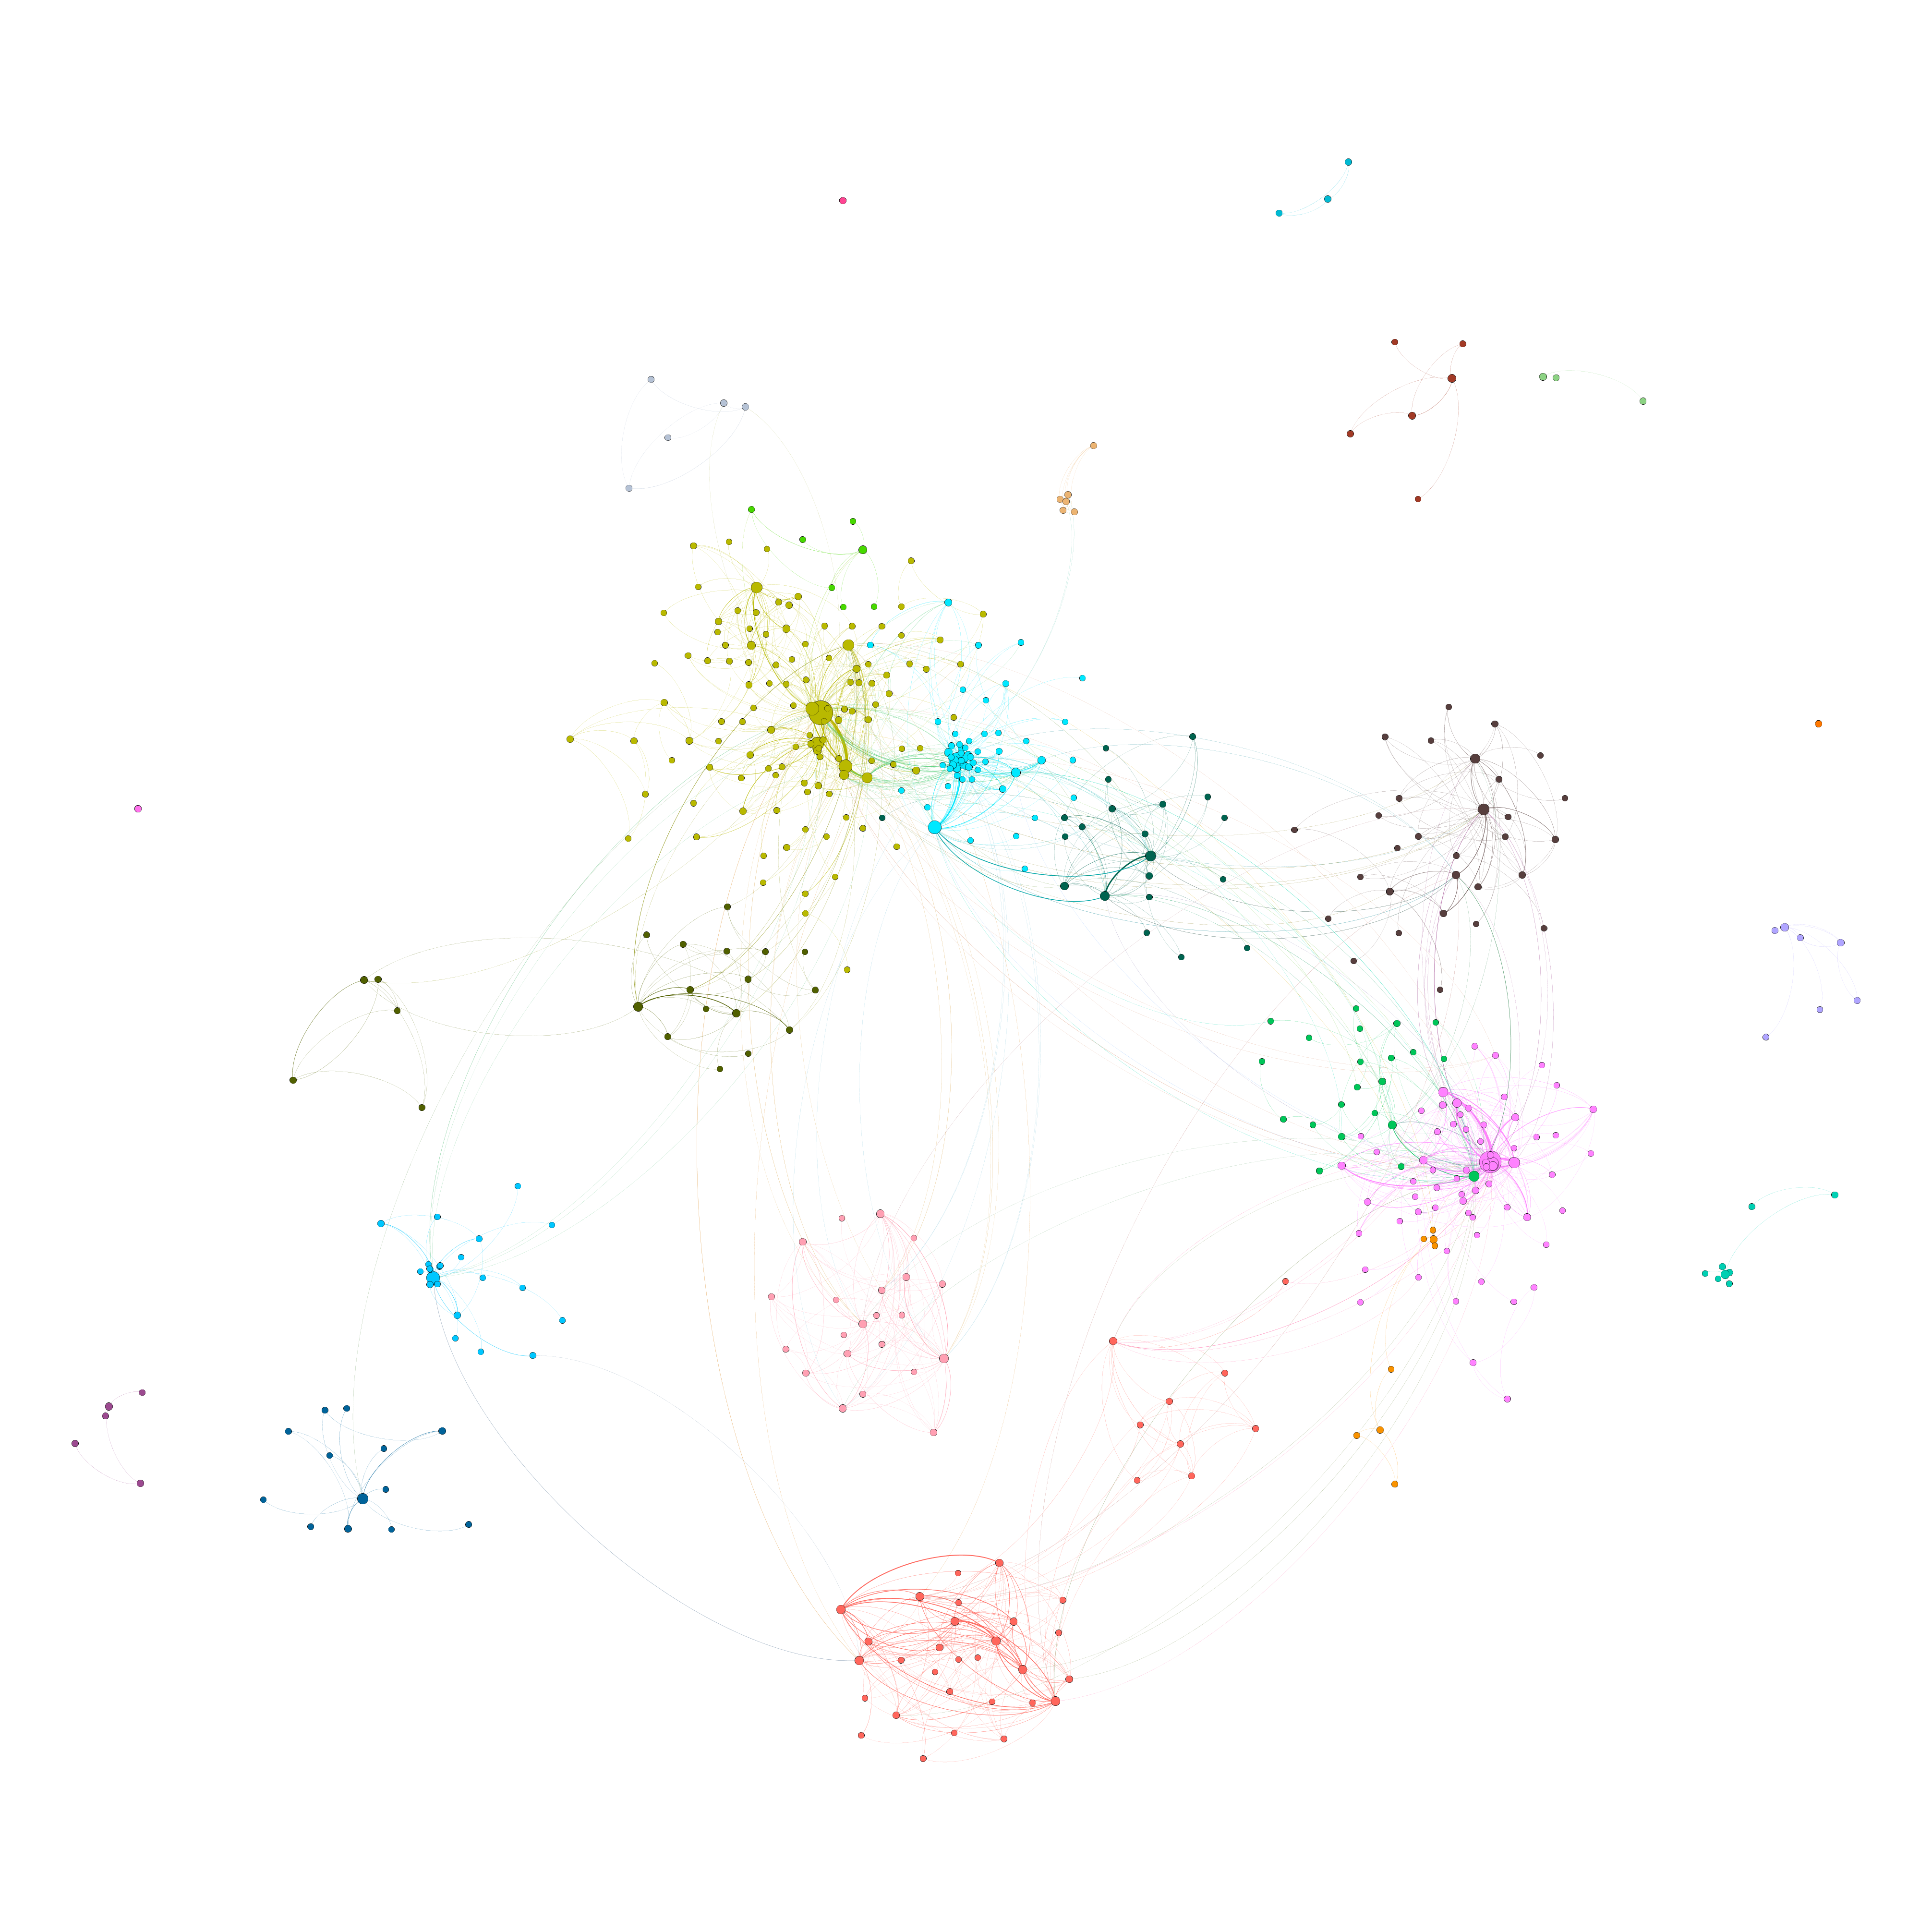
Using a single query in BigQuery we can extract the top 1,500 most common co-occurrences and render them into a subgraph for rendering in Gephi, as seen in the visualization below.
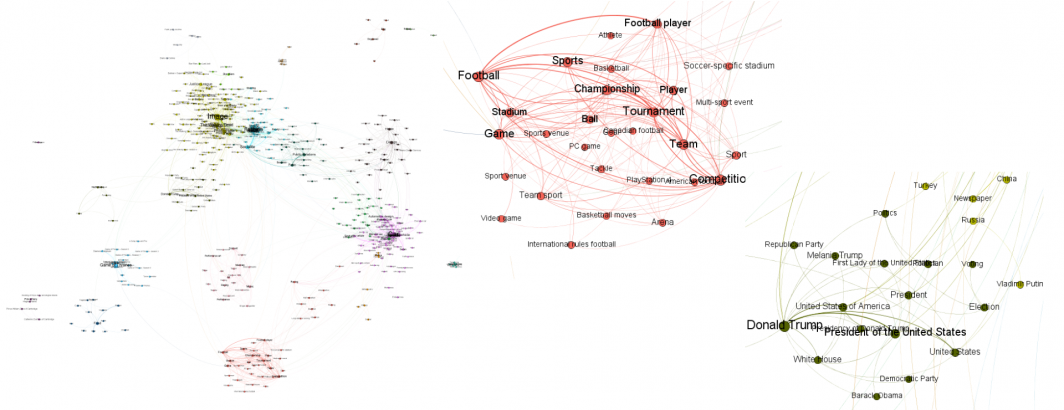
What can we learn from this visualization? Unsurprisingly, the most commonly co-occurring visual entities fall into a set of distinct categories, such as sports, entertainment, global politics and so on. Game of Thrones' global impact is visible in its presence below.
It is important to remember that this graph does not represent the most common entities, but rather the most common co-occurring pairs of entities. This means that the clusters below capture the entities which appear together most often, not necessarily the most important entities overall. In short, this visualization captures the pairings which have defined the visual landscape over the past three years, but not necessarily its overall content, given that more common entities may simply have not appeared sufficiently commonly with any other single entity to make it into the top 1,500 strongest associations.
Creating this graph took just a single line of SQL in BigQuery and just 4 seconds:
SELECT * FROM `gdelt-bq.gdeltv2.cloudvision_webentitygraph_20191020` order by RawCount desc limit 1500
You can download the visualization files for this graph below: