The massive new 3.8-billion-edge co-occurrence entity graph we released earlier today can answer myriad questions about how the world's imagery contextualizes and relates key topics and entities to one another.
The complete graph can be trivially subset into subgraphs centered on specific entities. Earlier today we showed how those subgraphs can be viewed in tabular format, but since the graph is already in Gephi's edge list format, simple SQL queries can be used to form ready-for-visualization subgraphs in seconds.
Using the same "Donald Trump" and "Putin" queries as we used earlier today with BigQuery to create the "top 15 tables", we can instead use the exact same query without modification, increase the limit clause to 1500 and import the results directly into Gephi.
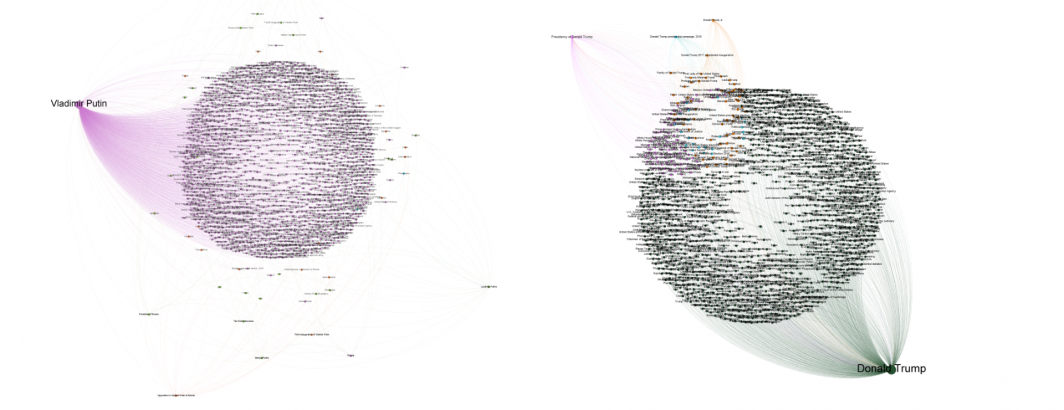
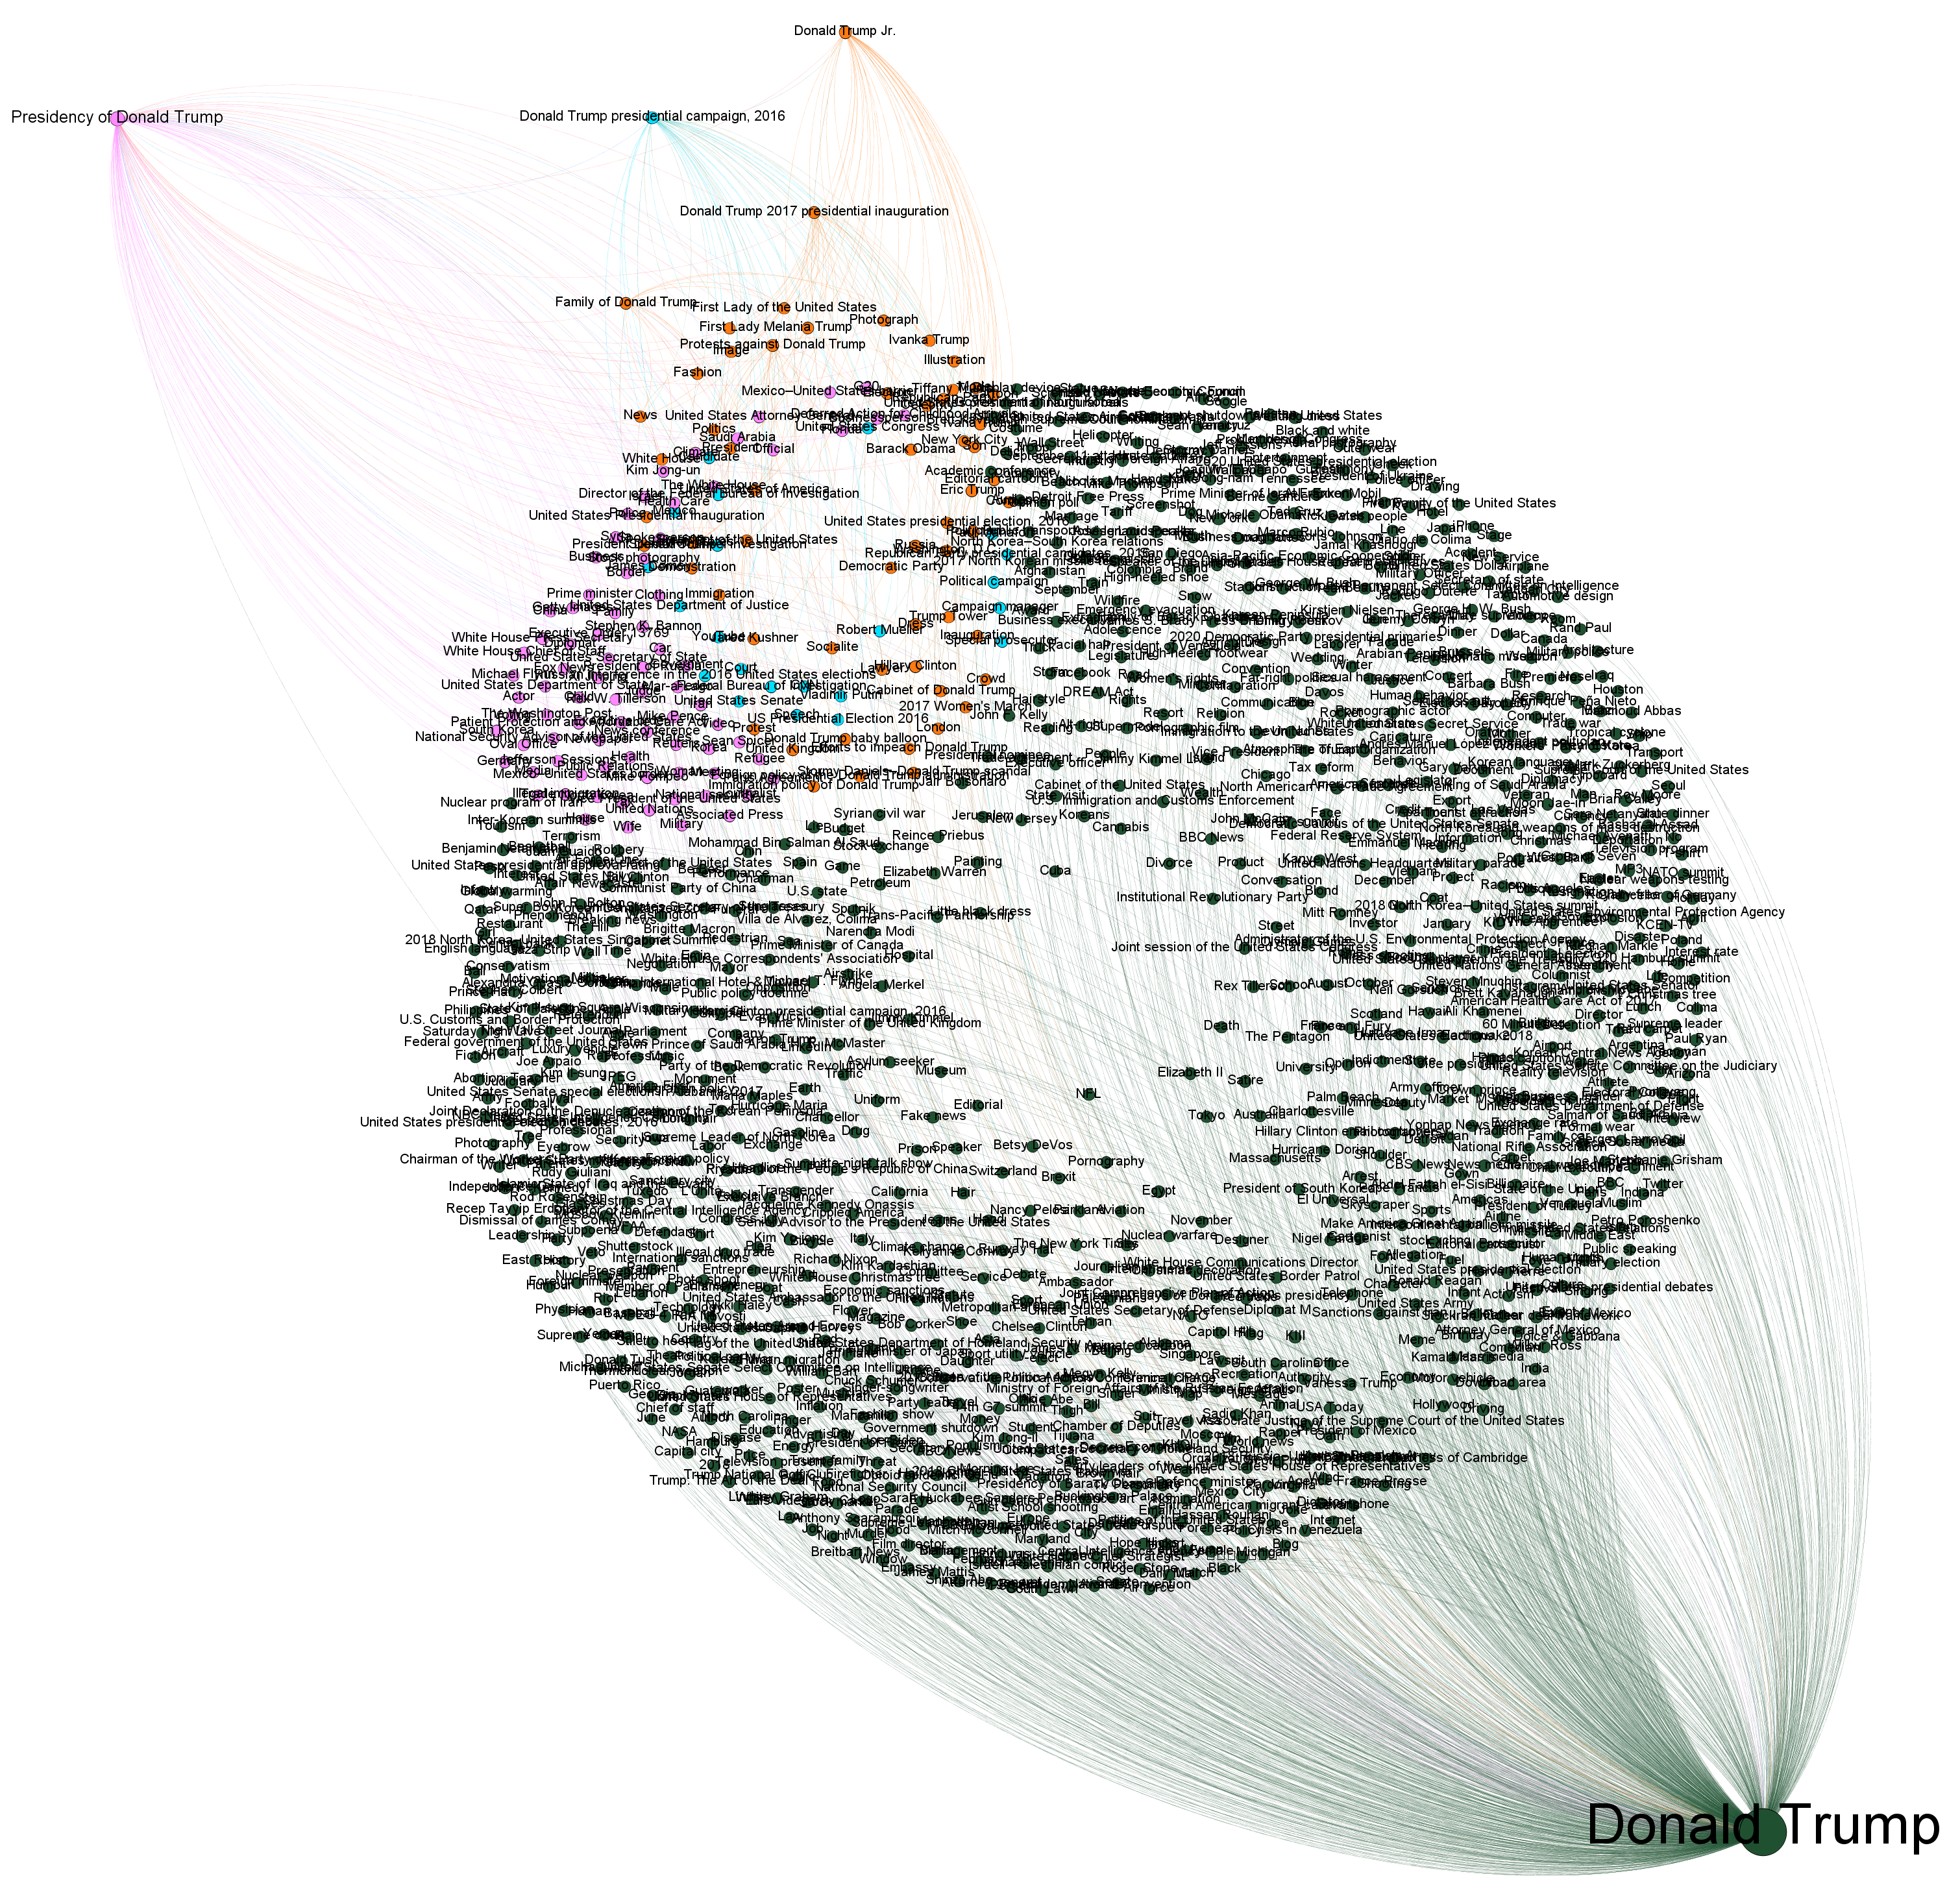
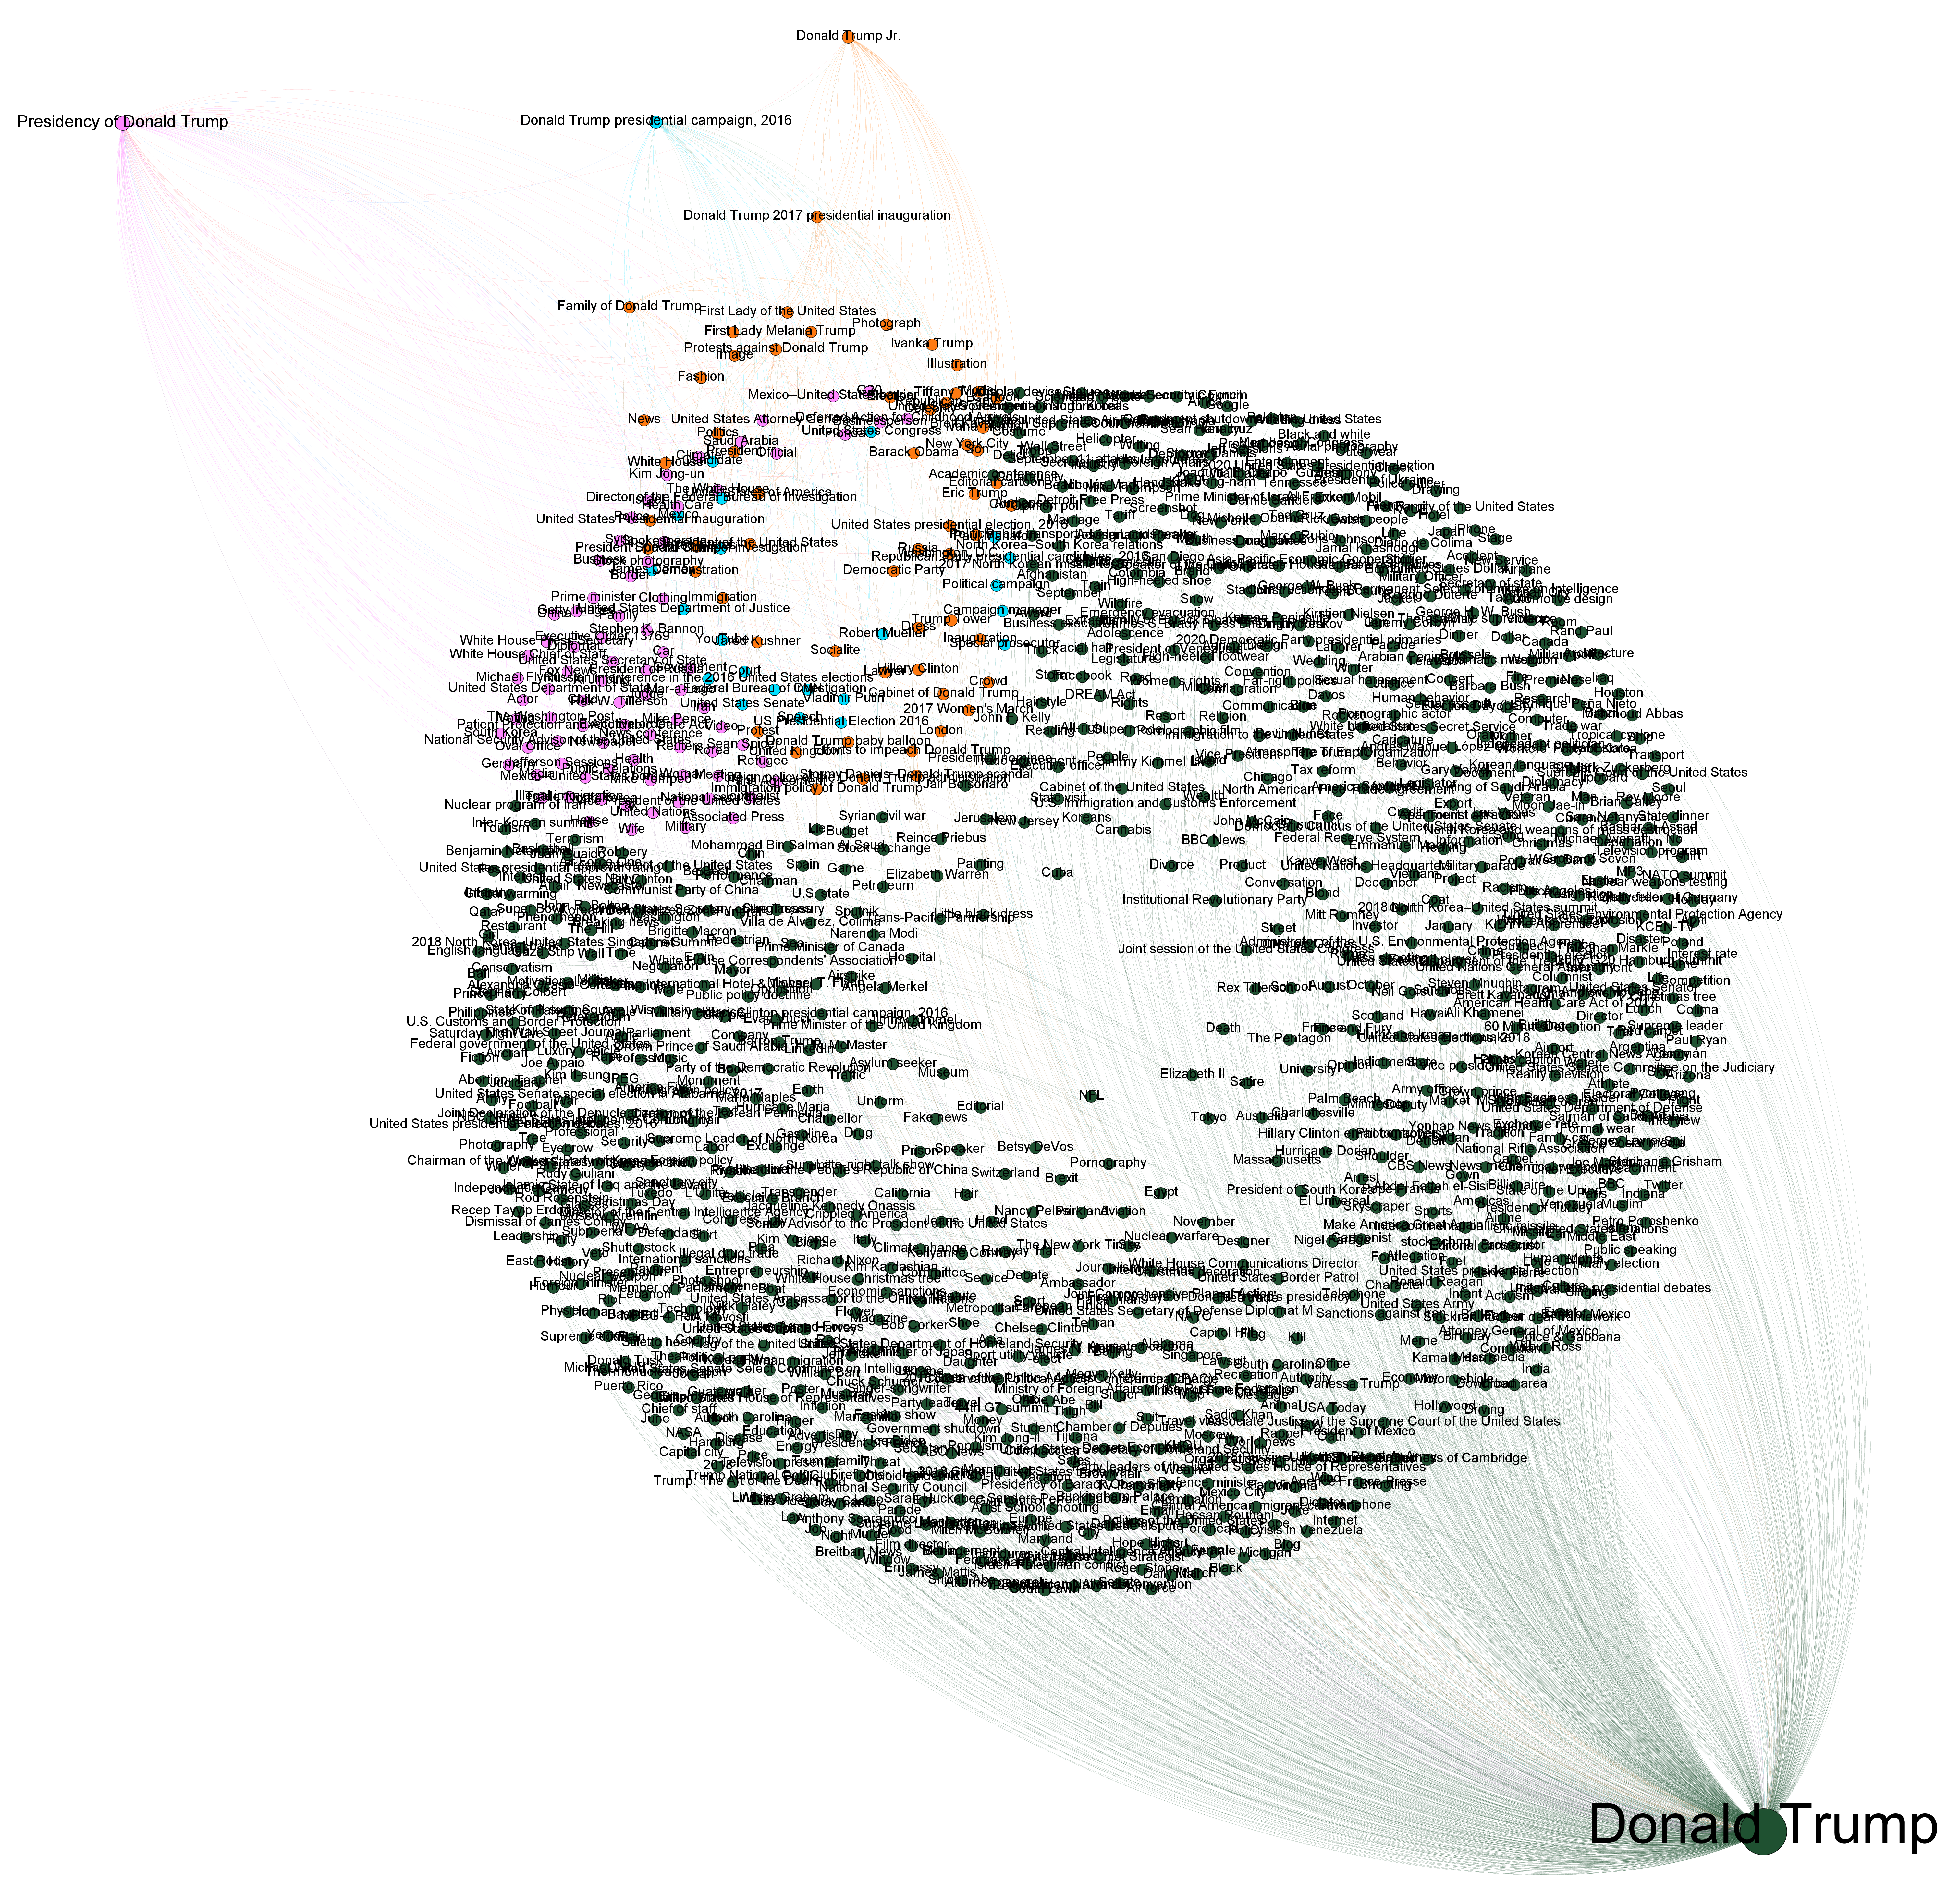
Below is the result of visualizing the top 1,500 edges containing "Donald Trump" as either the Source or Target:
You can download the visualization files for this graph below:
- Full Resolution 4K x 4K Graph.
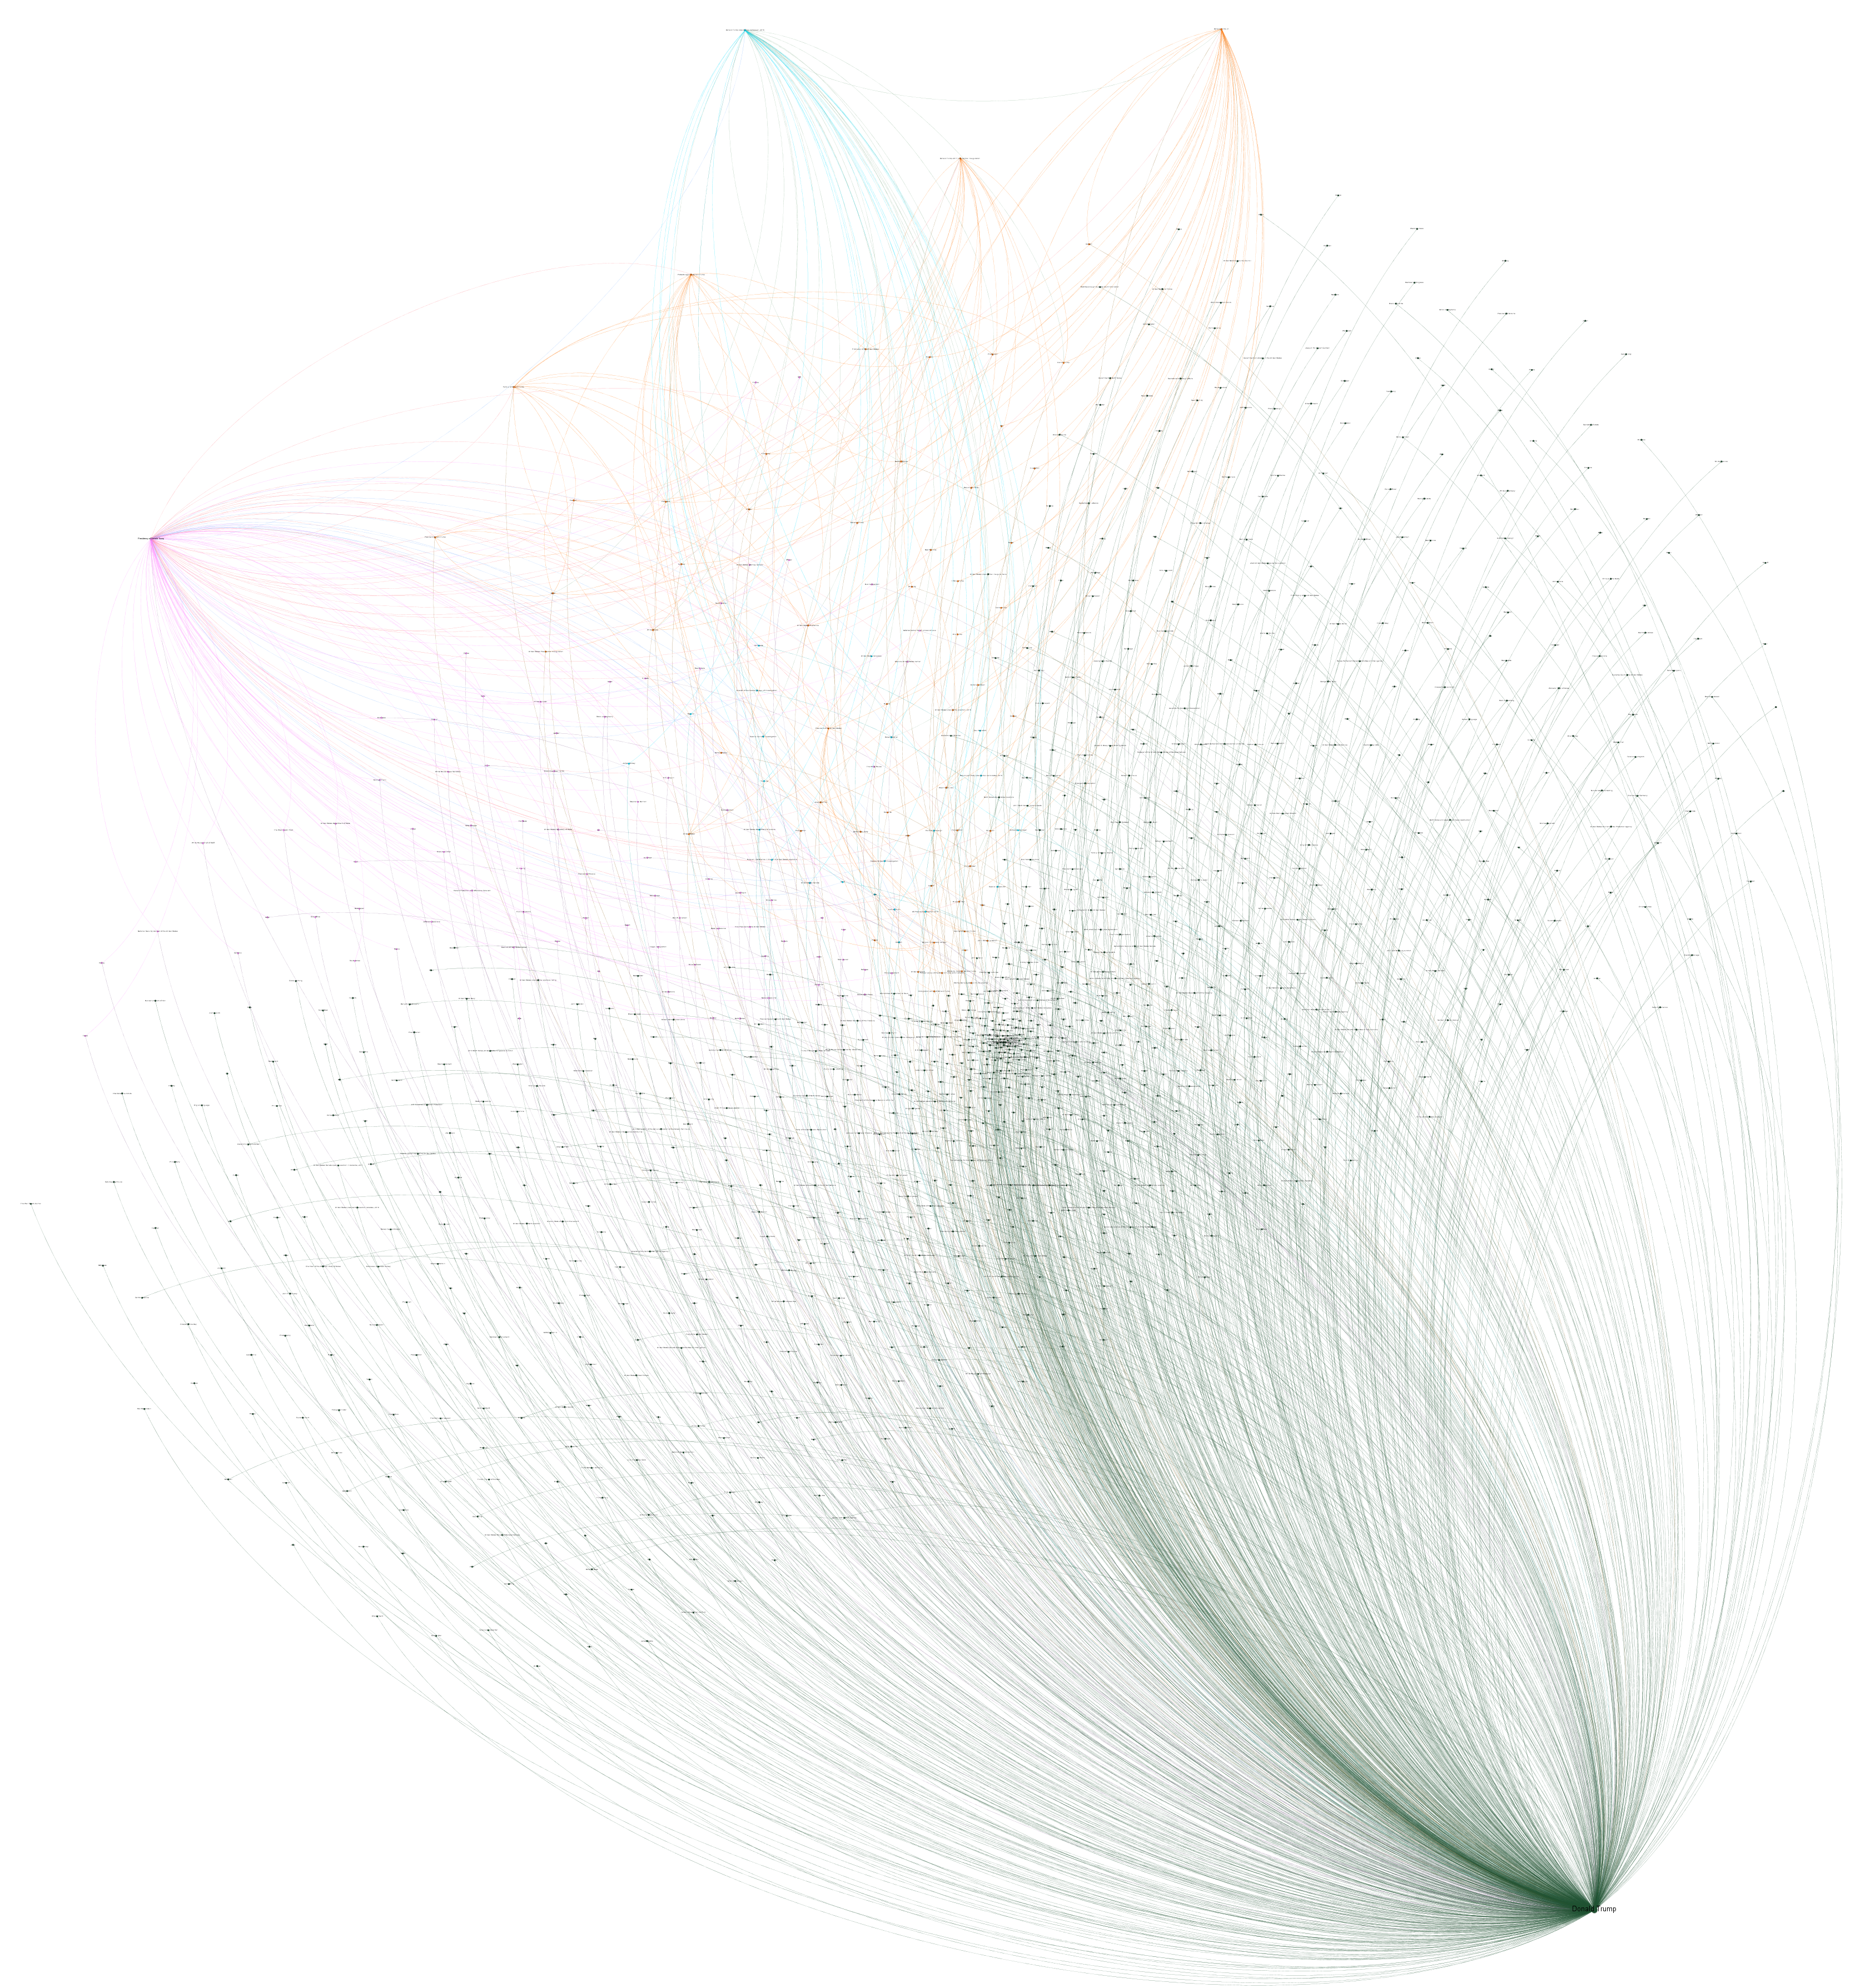
- Full Resolution 4K x 4K Alternative Layout Graph.
- Full Resolution 8K x 8K Graph.
- Gephi File.
- CSV Edge List.
Similarly, the graph below shows the same results for the query "Putin":

You can download the visualization files for this graph below:
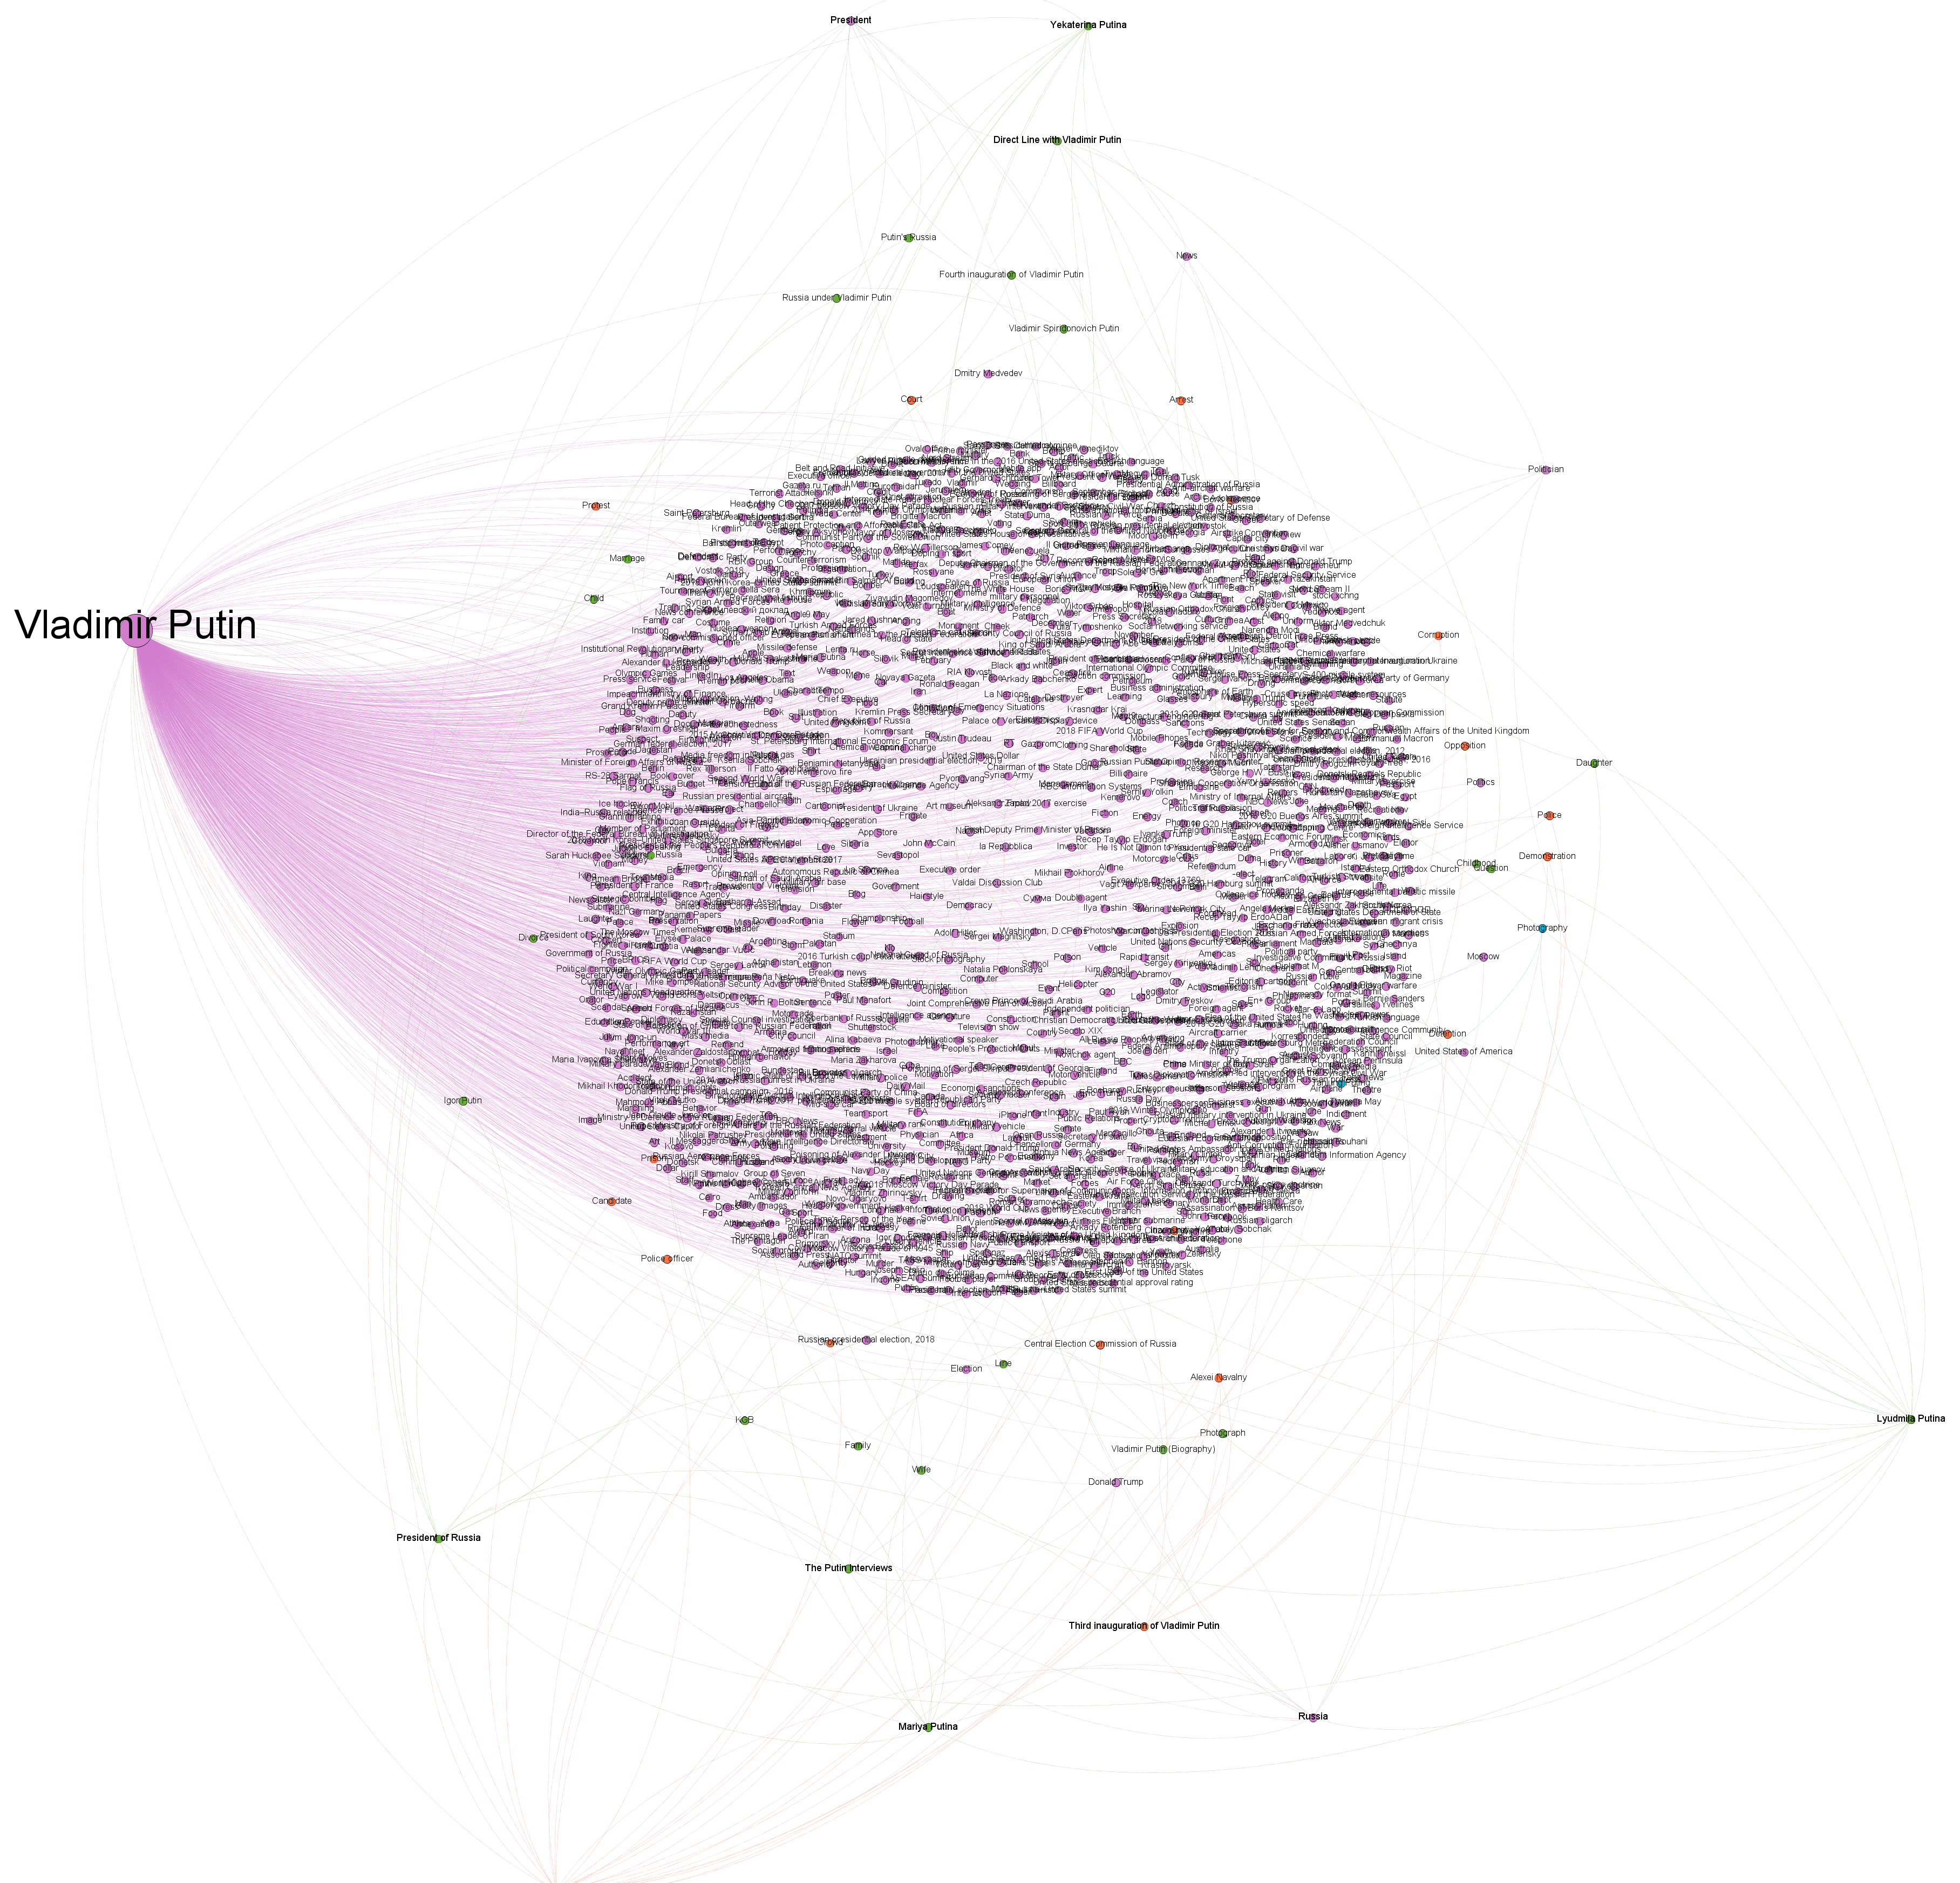
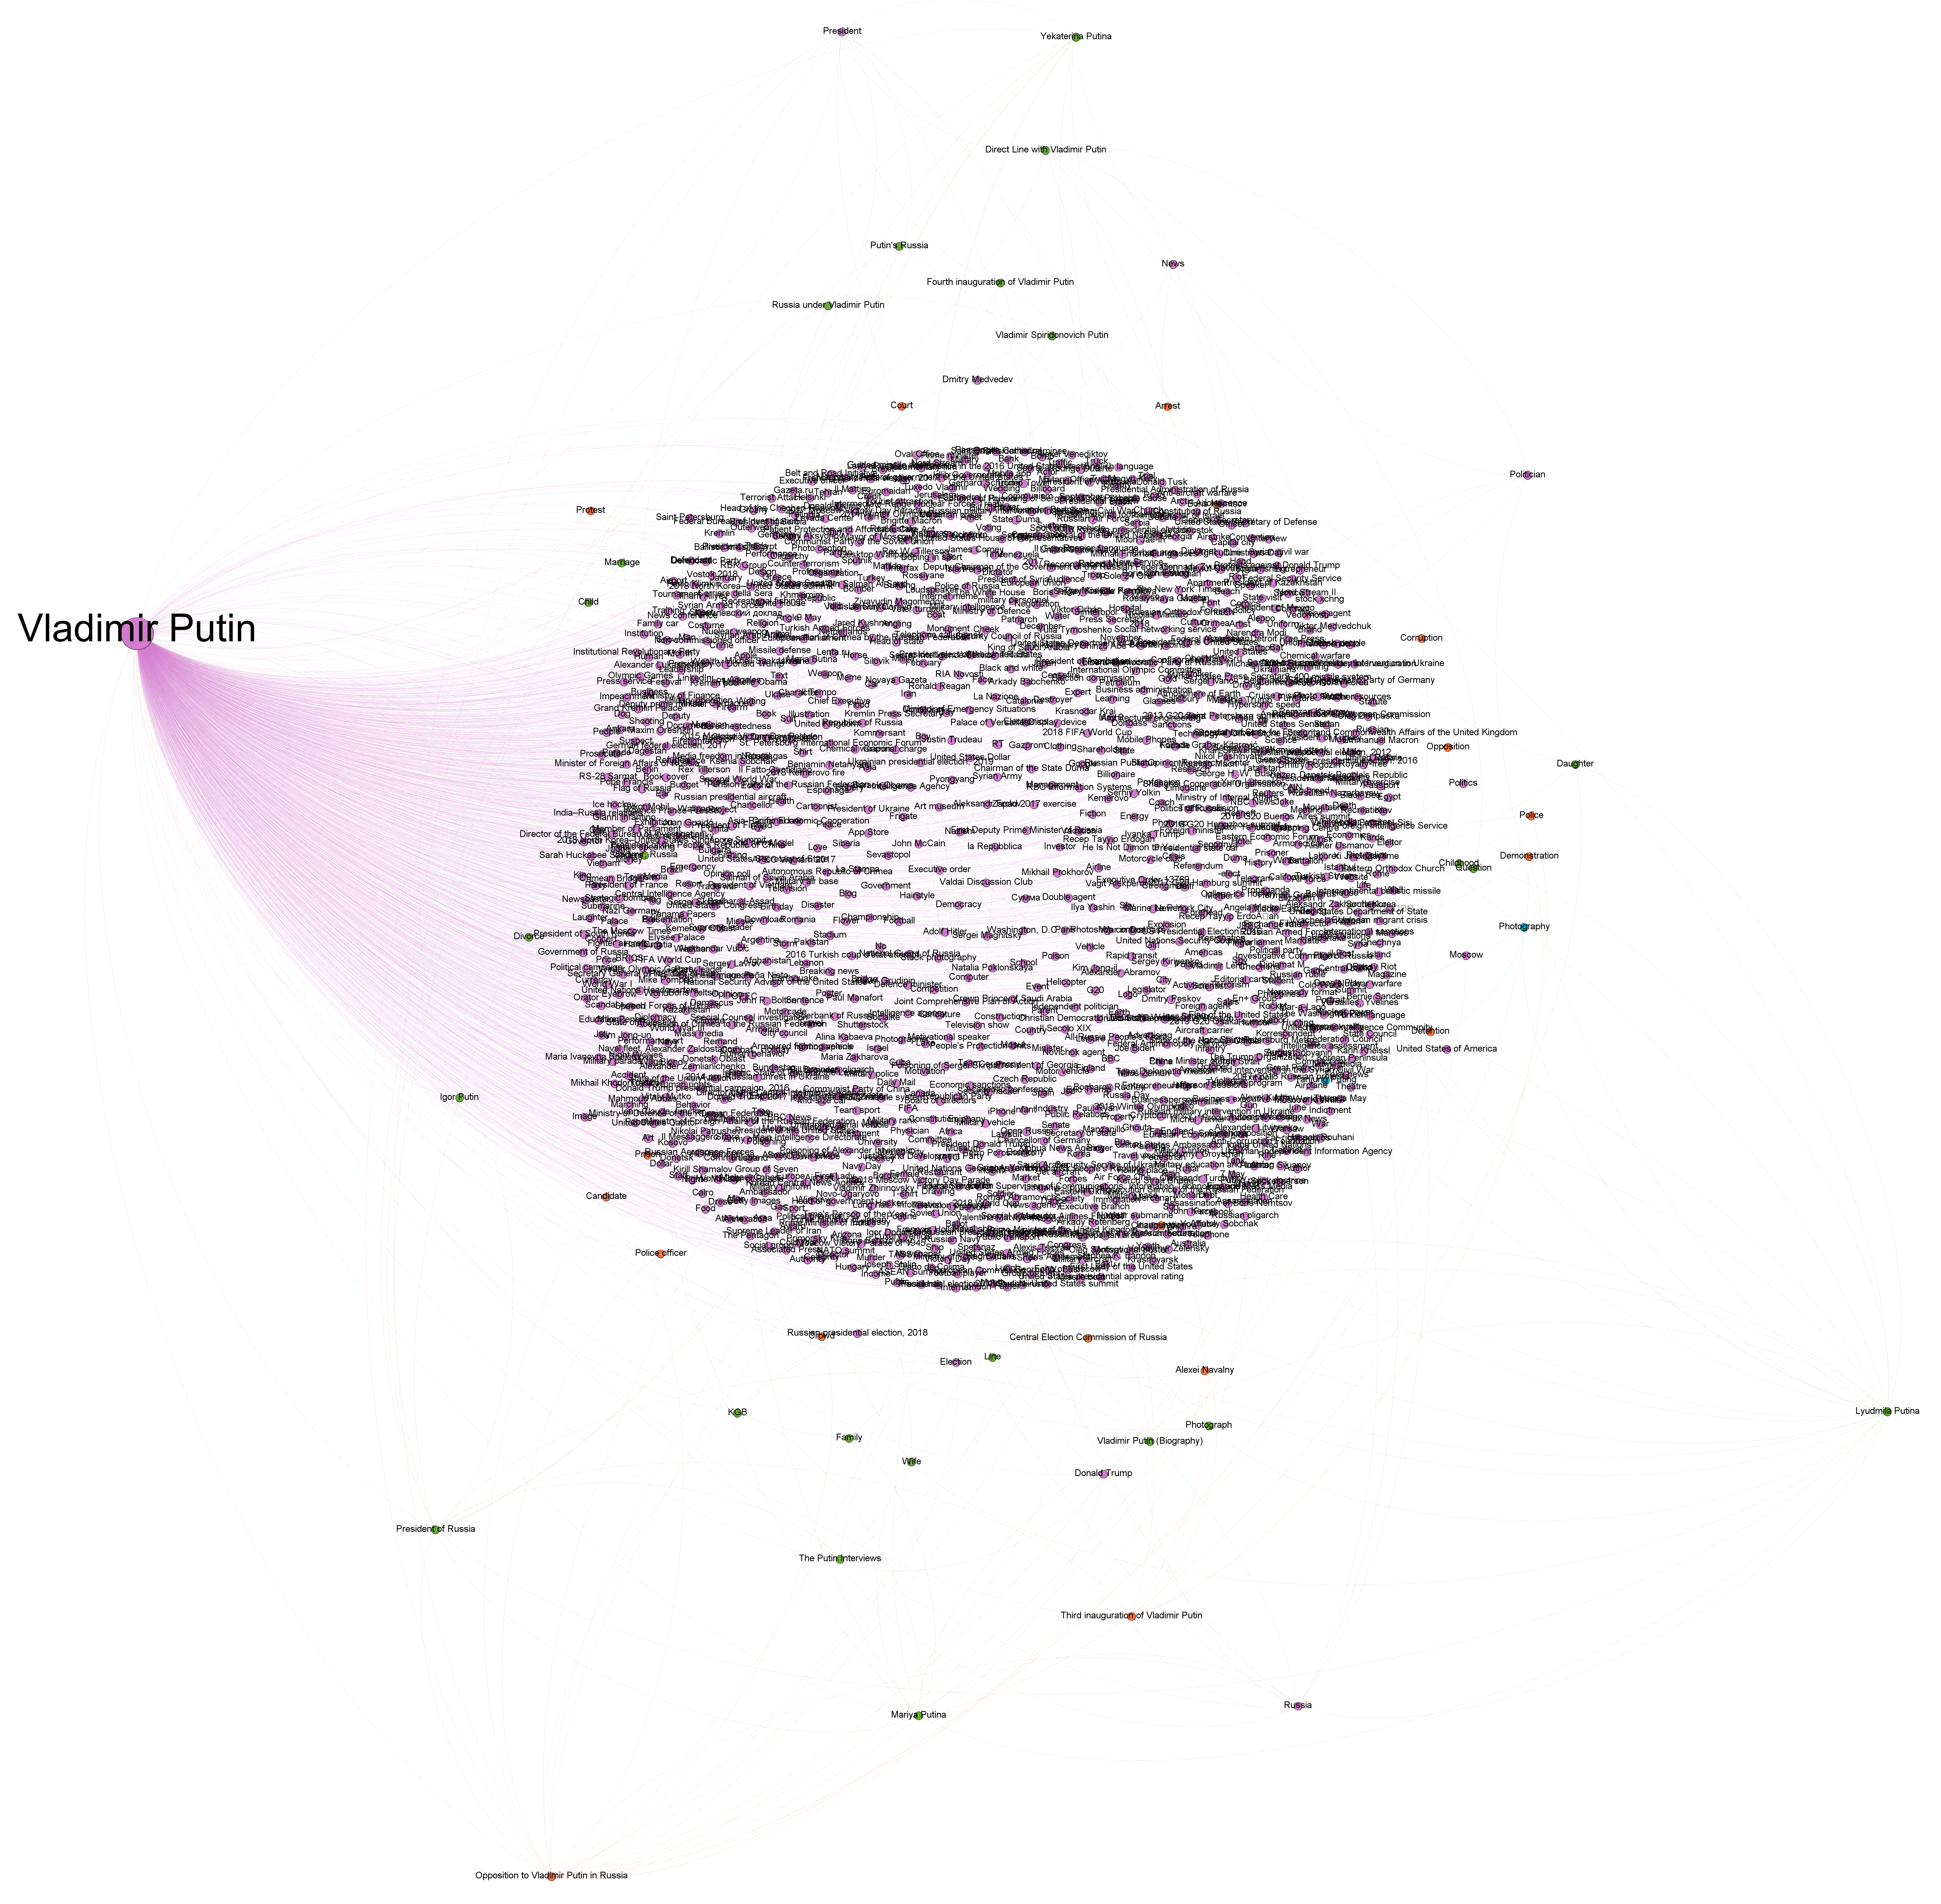
Of course, these graphs are relatively simplistic given that they center around a single node. More complex queries extracting transitive linkages through the graph would yield more interesting subgraphs.
We're excited to see what you're able to accomplish!