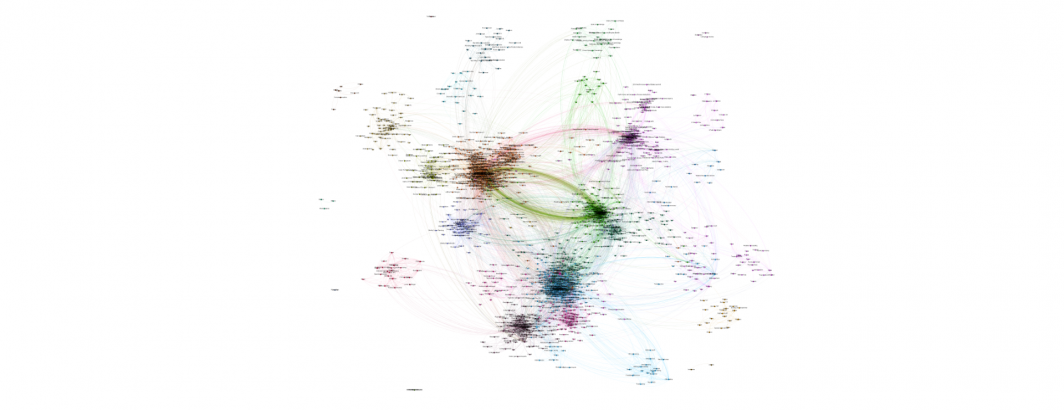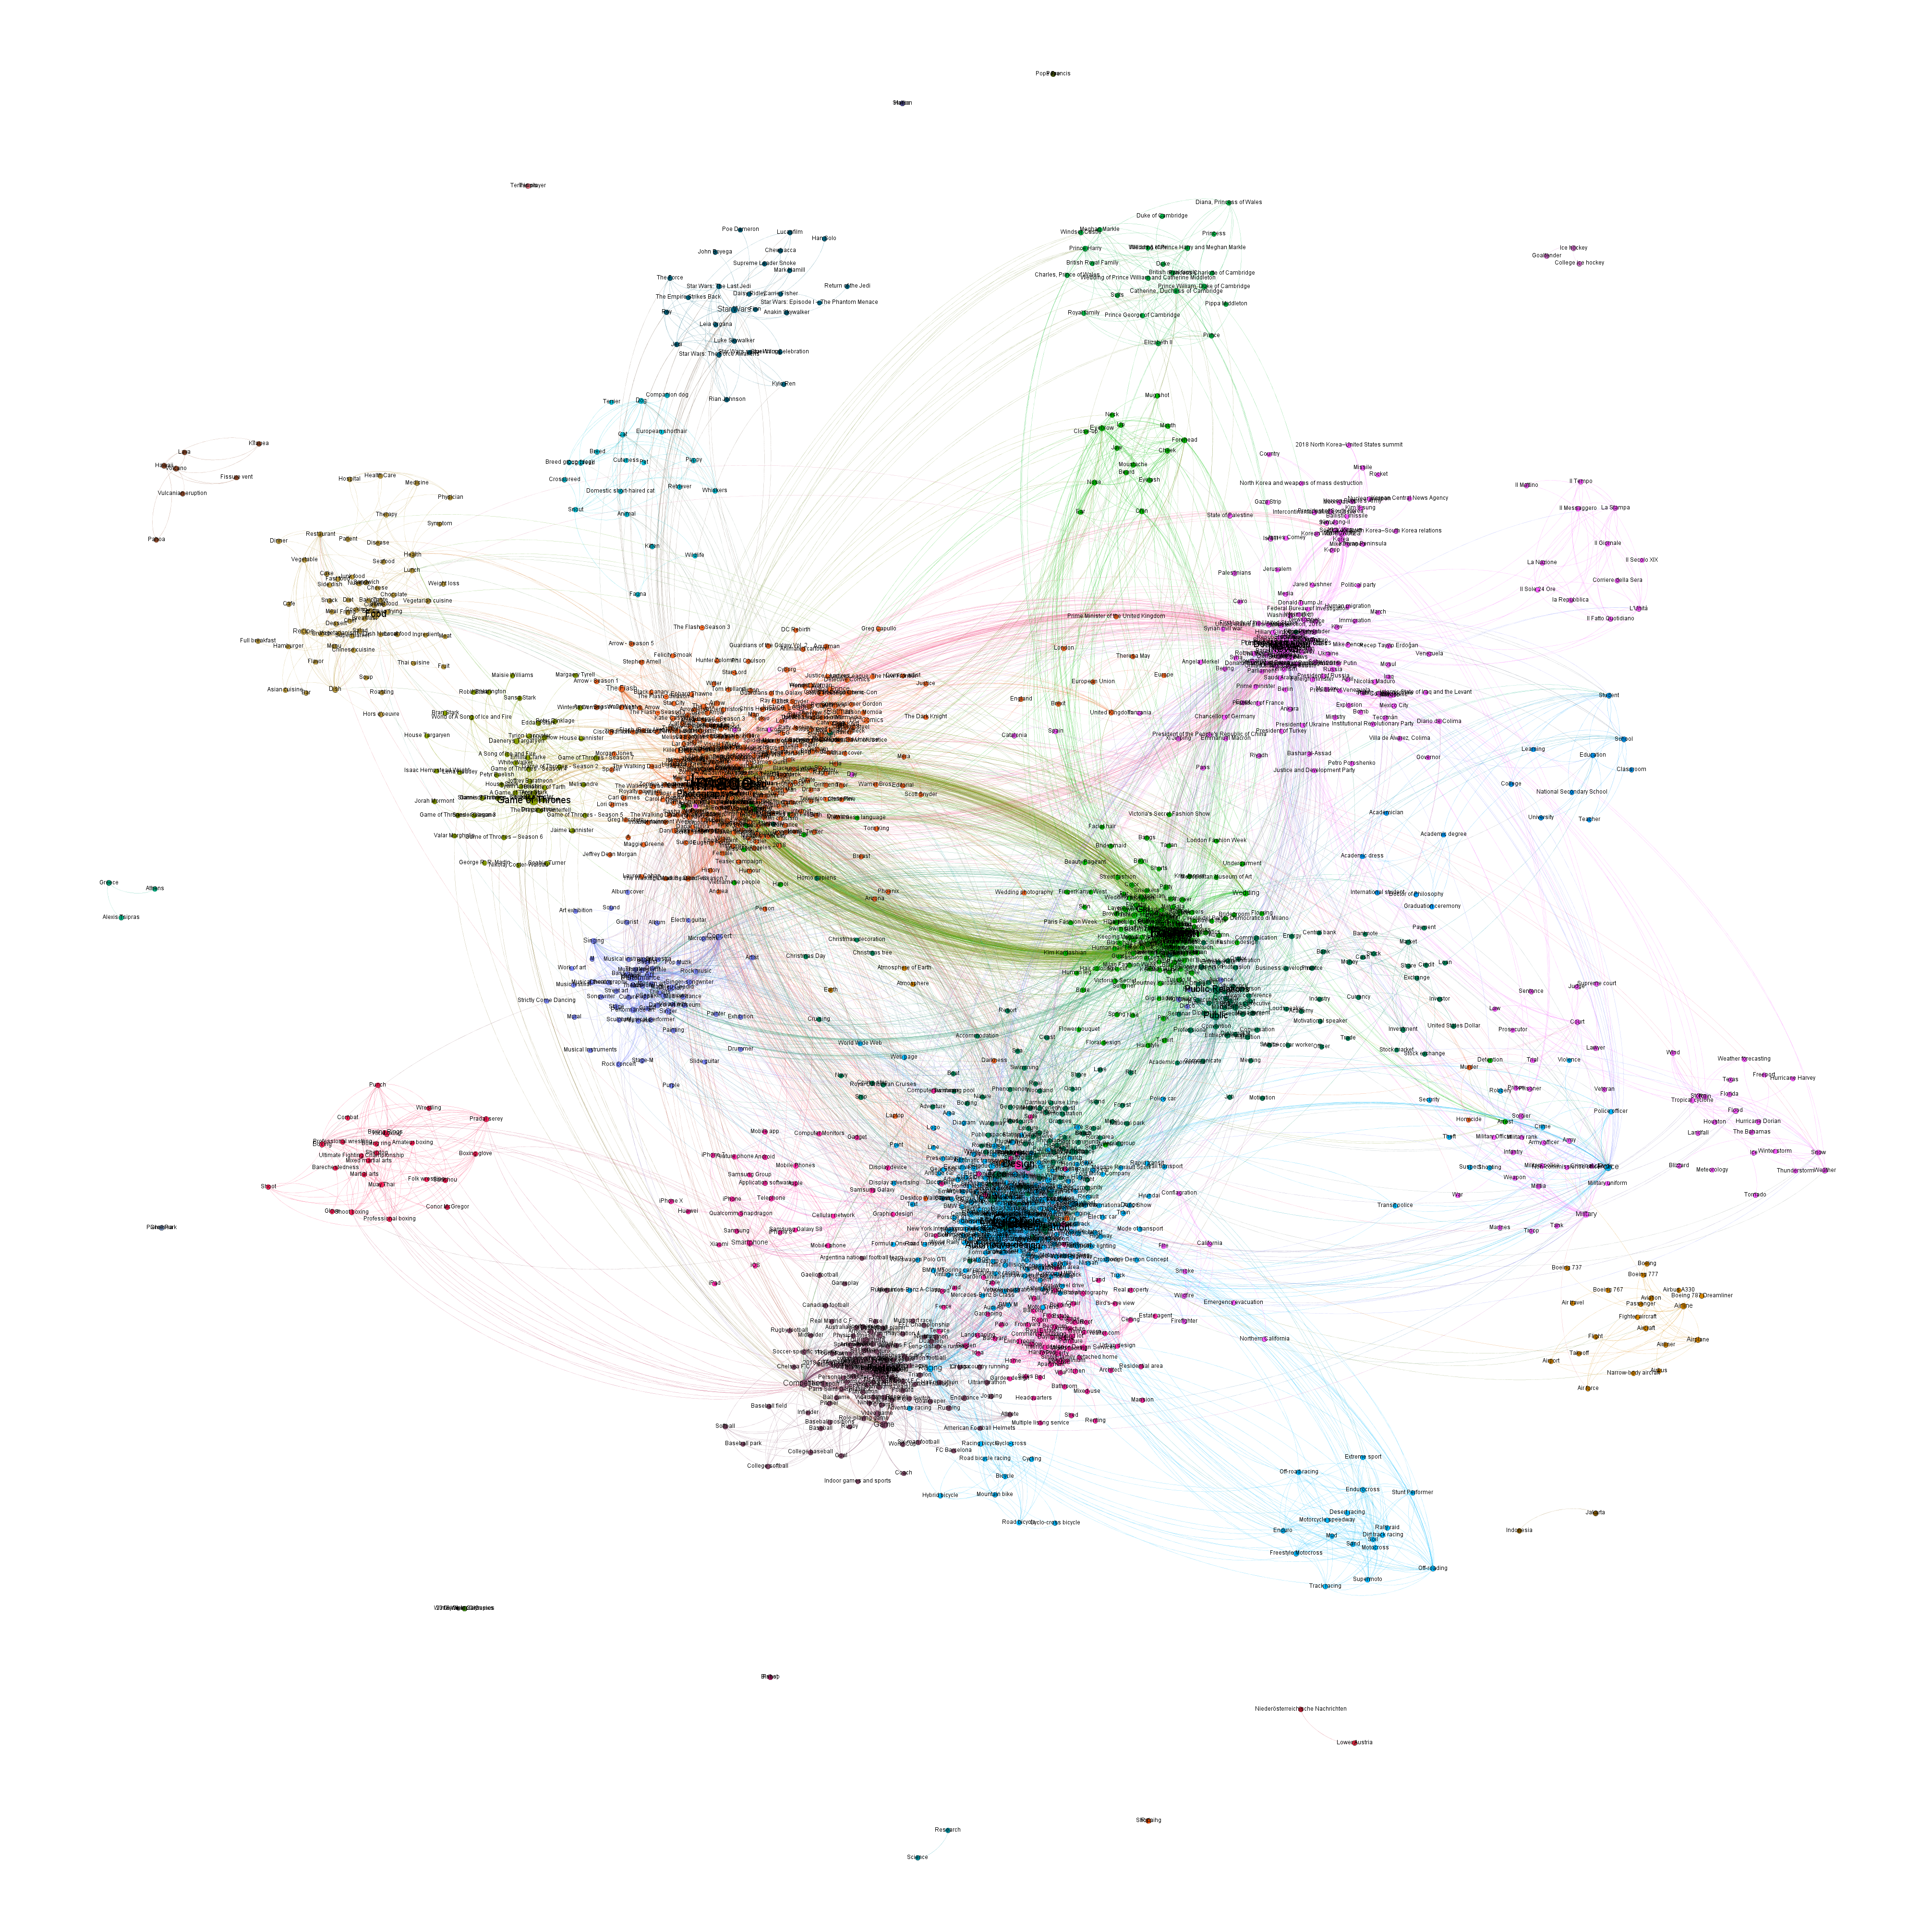
Similar to the subgraph of the top 1,500 strongest edges we created earlier today, here is the same graph constructed for the top 10,000 edges. Once again, these represent the strongest entity pairings, not necessarily the most common entities, which likely appear in many different contexts, rather than being so closely bound to specific paired entities.
The impact of popular culture can be seen even more clearly in the imagery below.
Creating this graph took just a single line of SQL in BigQuery and just 4 seconds:
SELECT * FROM `gdelt-bq.gdeltv2.cloudvision_webentitygraph_20191020` order by RawCount desc limit 10000
You can download the visualization files for this graph below:
