Yesterday, in collaboration with the Internet Archive, we unveiled a major new analysis that visually clustered an entire episode of Russian TV News' "60 Minutes" by using the Visual Explorer's one-frame-every-4-seconds "visual ngrams" and pairwise comparing every frame to every other frame to catalog all of the frames with greater than 95% visual similarity. Two key outcomes of that analysis were the powerful insights, such as ad cataloging, made possible by such analysis and proving out the computational tractability of such large-scale similarity clustering. What would it look like to scale that analysis up to an entire year of 60 Minutes episodes, comparing every frame to every other frame across more than 740,000 frames representing nearly 50,000 minutes of airtime across 335 broadcasts?
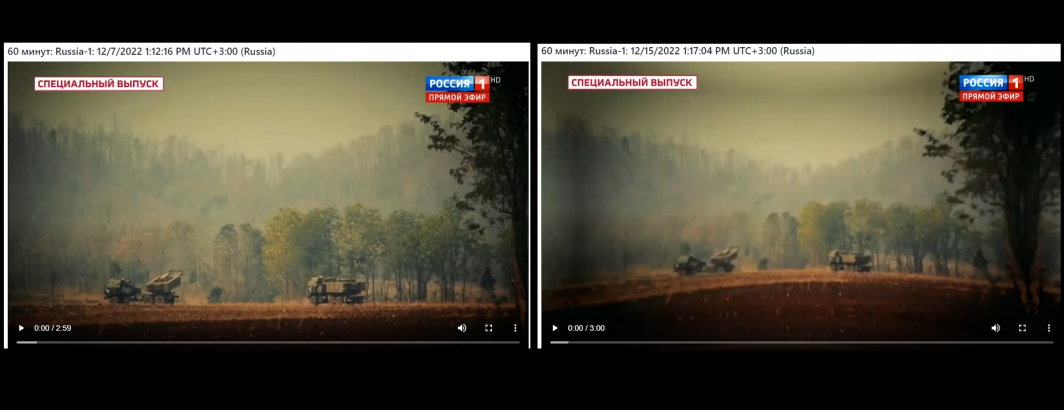
As an example of the power of this approach, here is the same clip airing on December 7th and 15th, showcasing the immense power of being able to search across nearly an entire year of 60 Minutes episodes:
You can download the complete set of matches at the end of this post.
In collaboration with the Internet Archive, the Visual Explorer extracts one frame every 4 seconds from each broadcast to create a "visual ngram" that non-consumptively captures the core visual narratives of the broadcast. We will use those to visually cluster all of the 60 Minutes episodes archived by the Archive over the past year.
First we'll download the Archive's complete Russia 1 show inventory and filter it to extract just the list of 60 Minutes episodes (NOTE – filtering like this requires EPG data, which was not added until May 19, 2022, excluding the first two months of the Archive's Russia 1 archive):
apt-get -y install parallel
apt-get -y install jq
start=20220101; end=20230314; while [[ ! $start > $end ]]; do echo $start; start=$(date -d "$start + 1 day" "+%Y%m%d"); done > DATES
mkdir JSON
time cat DATES | parallel --eta 'wget -q https://storage.googleapis.com/data.gdeltproject.org/gdeltv3/iatv/visualexplorer/RUSSIA1.{}.inventory.json -P ./JSON/'
rm IDS.tmp; find ./JSON/ -depth -name '*.json' | parallel --eta 'cat {} | jq -r .shows[].id >> IDS.tmp'
grep '60_minut' IDS.tmp | sort > IDS
Now download all of the video ngram ZIP files and unpack them:
mkdir IMAGES
time cat IDS | parallel --eta 'wget -q https://storage.googleapis.com/data.gdeltproject.org/gdeltv3/iatv/visualexplorer/{}.zip -P ./IMAGES/'
time find ./IMAGES/ -depth -name '*.zip' | parallel --eta 'unzip -n -q -d ./IMAGES/ {} && rm {}'
time find ./IMAGES/ -depth -name "*.jpg" | wc -l
In all, there are 743,474 images. Clustering this entire massive archive is as simple as the following two lines using an off-the-shelf tool called "findimagedupes":
apt-get -y install findimagedupes
time find ./IMAGES/ -depth -name "*.jpg" -print0 | findimagedupes -f ./FINGERPRINTS-60MIN.db -q -q -t 95% -0 -- - > MATCHES.60MIN&
Despite computing perceptual hashes for three quarters of a billion images and pairwise comparing every image to every other image (276 billion comparisons), the entire process from start to finish takes just over 1 hour and 45 minutes on a 64-core VM. Note that findimagedupes has the ability to save its fingerprints to an ondisk database which we enable here. This means that in future we can hand it a new image or set of images and have it compare them against this entire year-long archive without recomputing all of the fingerprints.
Here we look for 95% similarity, which is an extremely high threshold that captures only near-duplicates, but this could be reduced to capture more images that are "similar" but not identical.
We then process the matches file using a simple Perl script that generates four files. One containing any cross-day matches (where a group of frames spans across days – these are the most interesting) cross-show matches (where a group of frames spans two or more broadcasts in the same day – 60 Minutes broadcasts twice a day so many repeats are clips reused later in the same day), one containing sequential matches in the same broadcast (a sequence of images) and one containing matches with gaps between them within the same broadcast.
#!/usr/bin/perl

open(FILE, $ARGV[0]);
open(OUTS, ">$ARGV[0].seq");
open(OUTG, ">$ARGV[0].gap");
open(OUTC, ">$ARGV[0].crossshow");
open(OUTD, ">$ARGV[0].crosssdate");
while(<FILE>) {
    my @arr = sort (split/\s+/, $_); $arrlen = scalar(@arr);

    $lastshow = ''; $lastdate = 0; $firstframe = 0; $lastframe = 0; $hasgap = 0; $crossshow = 0; $crossdate = 0;
    for($i=0;$i<$arrlen;$i++) {
        ($show, $frame) = $arr[$i]=~/.*\/(.*?)\-(\d+)\.jpg/; ($date) = $show=~/_(\d\d\d\d\d\d\d\d)_/;
        $arr[$i]=~s/^.*\///; $arr[$i]=~s/\.jpg//;
        if ($i > 0 && $frame != ($lastframe+1)) { $hasgap = 1; };
        if ($i > 0 && $show ne $lastshow) { $crossshow = 1; };
        if ($i > 0 && $lastdate != $date) { $crossdate = 1; print "($lastdate)($date)\n"; };
        $lastshow = $show; $lastdate = $date; $lastframe = $frame; if ($i == 0) { $firstframe = $frame; };
    }

    if ($crossdate == 1) { print OUTD "@arr\n"; next; }
    if ($crossshow == 1) { print OUTC "@arr\n"; next; }
    if ($hasgap == 1) { $gap = $lastframe - $firstframe; print OUTG "$gap\t@arr\n"; } else { print OUTS "@arr\n"; };

}
close(FILE);
close(OUTS);
close(OUTG);
close(OUTC);
close(OUTD);
You can download these four files below:
- Cross Date Matches.
- Cross Show Matches.
- Single-Show Matches With Gaps.
- Single-Show Sequential Matches.
We are tremendously excited to see what you're able to do with this matches dataset and how you might apply this same technique to perform more advanced analyses, such as tracing clips across channels – for example CNN, Fox News and MSNBC excerpts used on Russian television
This analysis is part of an ongoing collaboration between the Internet Archive and its TV News Archive, the multi-party Media-Data Research Consortium and GDELT.