
As we continue in our efforts to automatically segment television news broadcasts into their component stories, we've looked at shot-level video summaries, semantic caption similarity and even shot-level OCR edit distance and text similarity. In the past we've also looked at day-level visual similarity using the Video AI API's label annotations. What about looking at visual similarity across shots in a single broadcast?
BigQuery's LAG() and ARRAY_AGG() feature make it pretty straightforward to break a broadcast into shots and compile a list of the visual labels seen in the current shot and the previous shot:
select showOffset, LastList, List from (
select showOffset, LAG(List) OVER (PARTITION BY 1 order by showOffset asc) LastList, List from (
select showOffset, ARRAY_AGG(entity ORDER BY entity asc) list from (
SELECT showOffset, entity.name entity FROM `gdelt-bq.gdeltv2.vgegv2_iatv`, UNNEST(entities) AS entity WHERE DATE(date) = "2020-02-02" and iaShowId='KGO_20200202_000000_ABC_World_News_Tonight_With_David_Muir' and numShotChanges>1
) group by showOffset order by showOffset
)
)
That yields results that look like:
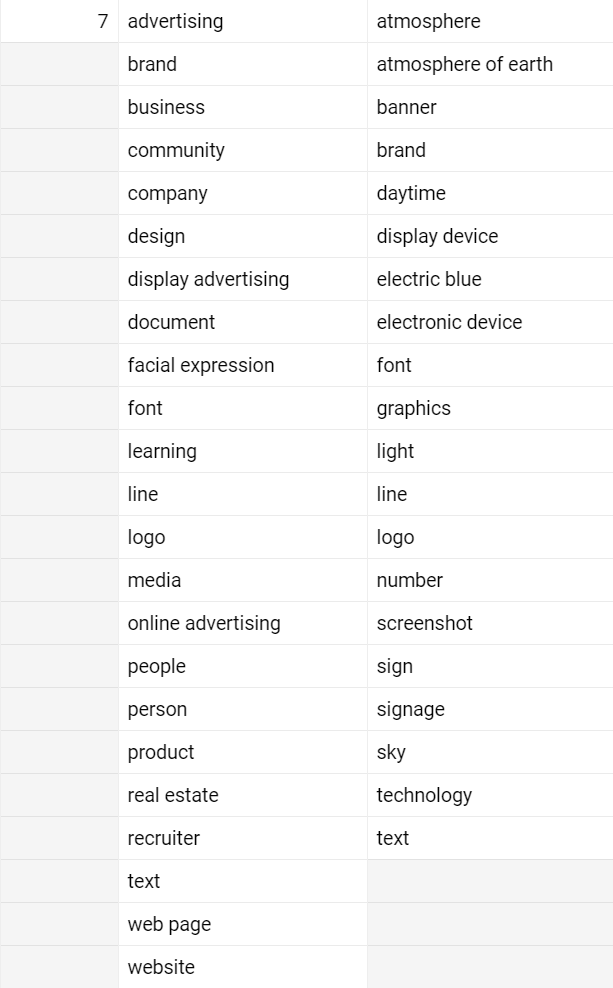
We can merge the two lists and compile the dataset into a flattened structure where each row is a given shotOffset+entry with two columns, one recording a 1 if it appeared in the current shot and a 0 if not and the same for the last shot:
WITH data as (
select showOffset, LAG(List) OVER (PARTITION BY 1 order by showOffset asc) LastList, List from (
select showOffset, ARRAY_AGG(entity ORDER BY entity asc) list from (
SELECT showOffset, entity.name entity FROM `gdelt-bq.gdeltv2.vgegv2_iatv`, UNNEST(entities) AS entity WHERE DATE(date) = "2020-02-02" and iaShowId='KGO_20200202_000000_ABC_World_News_Tonight_With_David_Muir' and numShotChanges>1
) group by showOffset order by showOffset
)
)
select showOffset, entry, sum(IsList) ThisTot, sum(IsLastList) LastTot from (
select showOffset, entry, 1 IsList, 0 IsLastList from data a, UNNEST(List) entry
UNION ALL
select showOffset, entry, 0 IsList, 1 IsLastList from data b, UNNEST(LastList) entry
) group by showOffset, entry order by showOffset
This rewrites the nested dataset above into the flattened table:
| showOffset | entry | ThisTot | LastTot |
| 7 | advertising | 0 | 1 |
| 7 | brand | 1 | 1 |
| 7 | business | 0 | 1 |
| 7 | community | 0 | 1 |
| 7 | company | 0 | 1 |
| 7 | design | 0 | 1 |
| 7 | display advertising | 0 | 1 |
| 7 | document | 0 | 1 |
| 7 | facial expression | 0 | 1 |
| 7 | font | 1 | 1 |
| 7 | learning | 0 | 1 |
| 7 | line | 1 | 1 |
| 7 | logo | 1 | 1 |
| 7 | media | 0 | 1 |
| 7 | online advertising | 0 | 1 |
| 7 | people | 0 | 1 |
| 7 | person | 0 | 1 |
| 7 | product | 0 | 1 |
| 7 | real estate | 0 | 1 |
| 7 | recruiter | 0 | 1 |
| 7 | text | 1 | 1 |
| 7 | web page | 0 | 1 |
| 7 | website | 0 | 1 |
| 7 | atmosphere | 1 | 0 |
| 7 | atmosphere of earth | 1 | 0 |
| 7 | banner | 1 | 0 |
| 7 | daytime | 1 | 0 |
| 7 | display device | 1 | 0 |
| 7 | electric blue | 1 | 0 |
| 7 | electronic device | 1 | 0 |
| 7 | graphics | 1 | 0 |
| 7 | light | 1 | 0 |
| 7 | number | 1 | 0 |
| 7 | screenshot | 1 | 0 |
| 7 | sign | 1 | 0 |
| 7 | signage | 1 | 0 |
| 7 | sky | 1 | 0 |
| 7 | technology | 1 | 0 |
From there we can easily add a Pearson correlation CORR() computation and a simple percent similarity metric:
WITH data as (
select showOffset, numShotChanges, LAG(List) OVER (PARTITION BY 1 order by showOffset asc) LastList, List from (
select showOffset, min(numShotChanges) numShotChanges, ARRAY_AGG(entity ORDER BY entity asc) list from (
SELECT showOffset, numShotChanges, entity.name entity FROM `gdelt-bq.gdeltv2.vgegv2_iatv`, UNNEST(entities) AS entity WHERE DATE(date) = "2020-02-02" and iaShowId='KGO_20200202_000000_ABC_World_News_Tonight_With_David_Muir' and numShotChanges>1
) group by showOffset order by showOffset
)
)
select showOffset, CORR(LastTot, ThisTot) Pearson, ( (sum(LastTot)+sum(ThisTot)) / (count(LastTot)*2) )*100 PercSim from (
select showOffset, entry, sum(IsList) ThisTot, sum(IsLastList) LastTot from (
select showOffset, entry, 1 IsList, 0 IsLastList from data a, UNNEST(List) entry
UNION ALL
select showOffset, entry, 0 IsList, 1 IsLastList from data b, UNNEST(LastList) entry
) group by showOffset, entry order by showOffset
) group by showOffset order by showOffset
This yields this results spreadsheet with each row being a shot and two columns, one being the Pearson correlation of that shot's visual labels with those of the previous shot and the second being the overall percent similarity of the two sets of labels.
Alternatively, we can vastly simplify this query if we treat the labels as words and perform string comparisons, using the same approach we used for OCR, using Felipe Hoffa's UDF template:
CREATE TEMP FUNCTION fuzz_tokensetratio(a string, b string) RETURNS INT64 LANGUAGE js AS """ return fuzzball.token_set_ratio(a,b); """ OPTIONS (library="gs://fh-bigquery/js/fuzzball.umd.min.js");
CREATE TEMP FUNCTION fuzz_tokensortratio(a string, b string) RETURNS INT64 LANGUAGE js AS """ return fuzzball.token_sort_ratio(a,b); """ OPTIONS (library="gs://fh-bigquery/js/fuzzball.umd.min.js");
CREATE TEMP FUNCTION fuzz_partialratio(a string, b string) RETURNS INT64 LANGUAGE js AS """ return fuzzball.partial_ratio(a,b); """ OPTIONS (library="gs://fh-bigquery/js/fuzzball.umd.min.js");

select showOffset,
fhoffa.x.levenshtein(LastListString, ListString) Levenshtein,
fuzz_tokensetratio(LastListString, ListString) Fuzz_TokenSetRatio,
fuzz_tokensortratio(LastListString, ListString) Fuzz_TokenSortRatio,
fuzz_partialratio(LastListString, ListString) Fuzz_PartialRatio,
LastListString, ListString from (

select showOffset, ARRAY_TO_STRING(LastList, ' ') LastListString, ARRAY_TO_STRING(List, ' ') ListString from (
select showOffset, LAG(List) OVER (PARTITION BY 1 order by showOffset asc) LastList, List from (
select showOffset, ARRAY_AGG(entity ORDER BY entity asc) list from (
SELECT showOffset, entity.name entity FROM `gdelt-bq.gdeltv2.vgegv2_iatv`, UNNEST(entities) AS entity WHERE DATE(date) = "2020-02-02" and iaShowId='KGO_20200202_000000_ABC_World_News_Tonight_With_David_Muir' and numShotChanges>1
) group by showOffset order by showOffset
)
)

)
This yields this results spreadsheet, with each row being a shot and a set of columns representing the various similarity scores of that shot's labels compared to the previous shot. Not all of these string metrics are as meaningful here, especially Levenshtein's edit distance-based metric, but nonetheless offers a practical example of how we can compare the visual similarity of scene composition across shot changes.
We hope this gives you some ideas!