How did the rise of COVID-19 coverage look like through Twitter, online news and Google Trends?
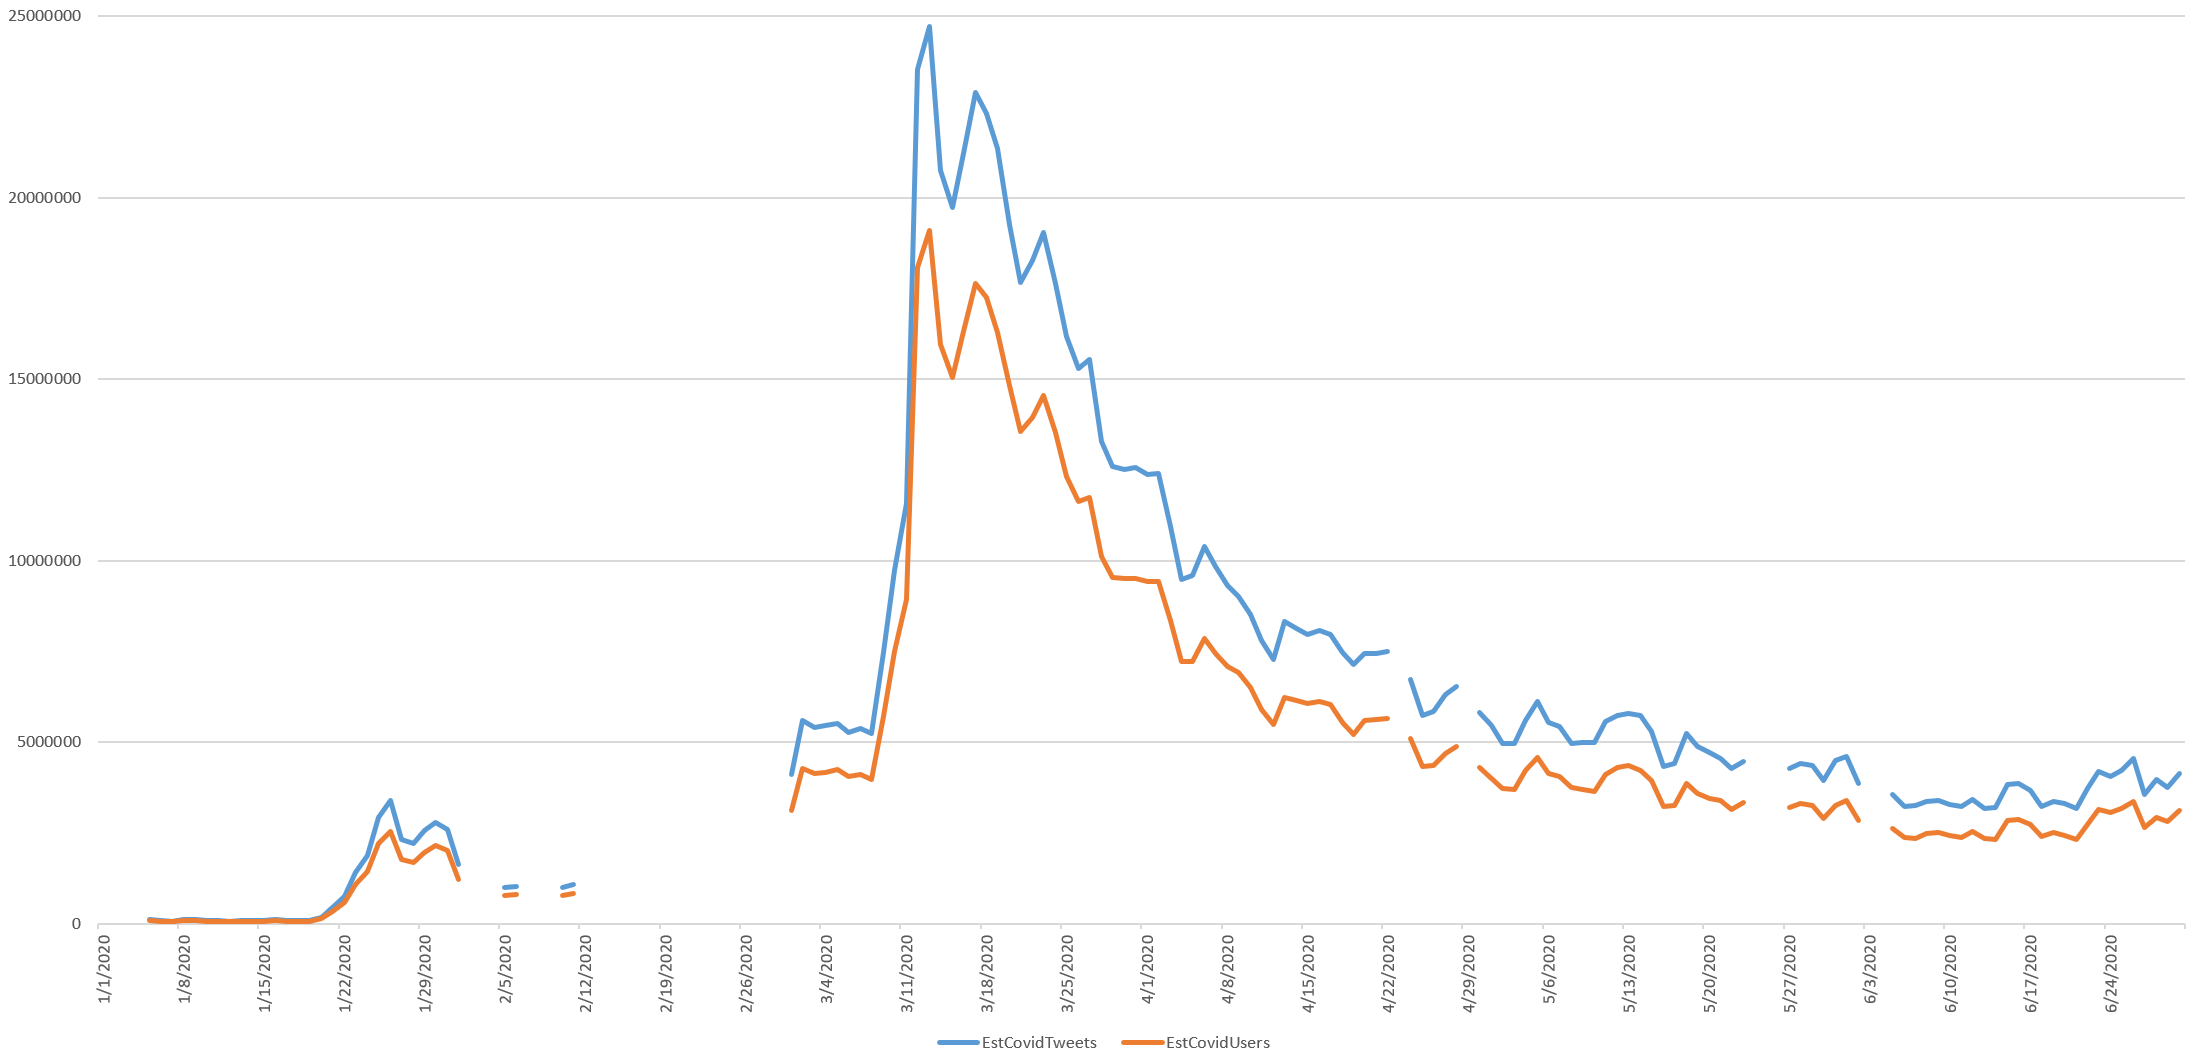
The timeline below shows the estimated total volume of Twitter posts matching the equivalent of "(*covd* OR *covid* OR *2019ncov* OR *coronavirus* OR *wuhan* OR *pandemic* OR *outbreak* OR * flu * OR *#flu * OR *pneumonia* OR *virus*)" by searching the lowercased text of all tweets in the Twitter 1% stream and multiplying the number of daily matches by 100, using the approach we demonstrated last year to tightly align with the full Twitter firehose. We included the word "virus" because Twitter has included this term as a COVID-19-sensitive term, meaning searches for the word "virus" will display Twitter's CDC COVID-19 infobox at the top of the results. Note that due to their English-centric nature, these terms will likely capture primarily the English Twittersphere's reaction to the pandemic.
The majority of growth in COVID-19-related tweets appears to happen from March 9 to March 13, falling off ever since.
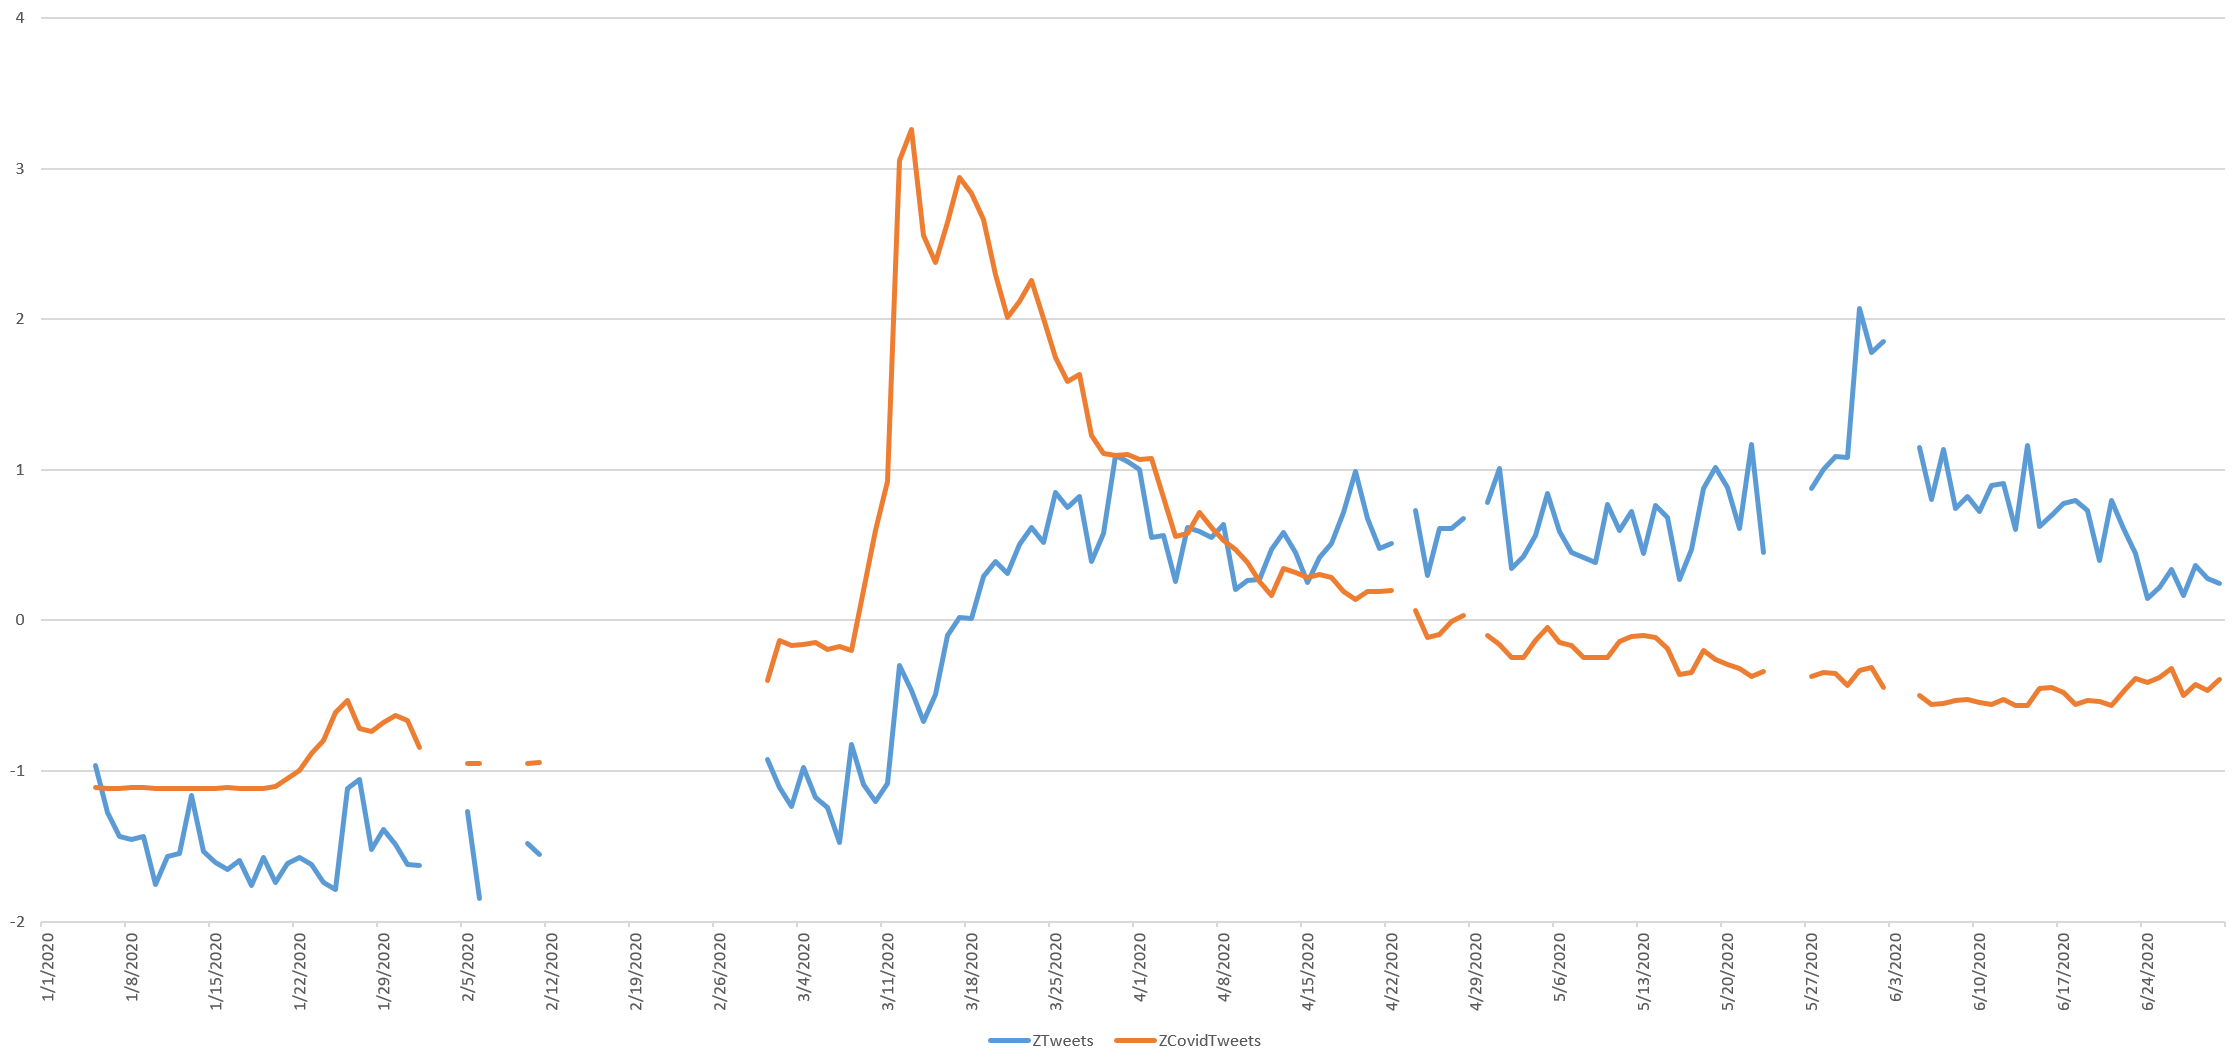
Using Z-Scores (standard deviations from mean), the timeline below compares the growth curves of Twitter as a whole versus COVID-19-related tweets since the start of this year.
Here it can be seen that COVID-19 leaps into prominence on Twitter over the space of just a few days, while the growth of Twitter as a whole begins around the same time, but builds much more slowly and remains elevated, while COVID-19 tweets sharply drop off.
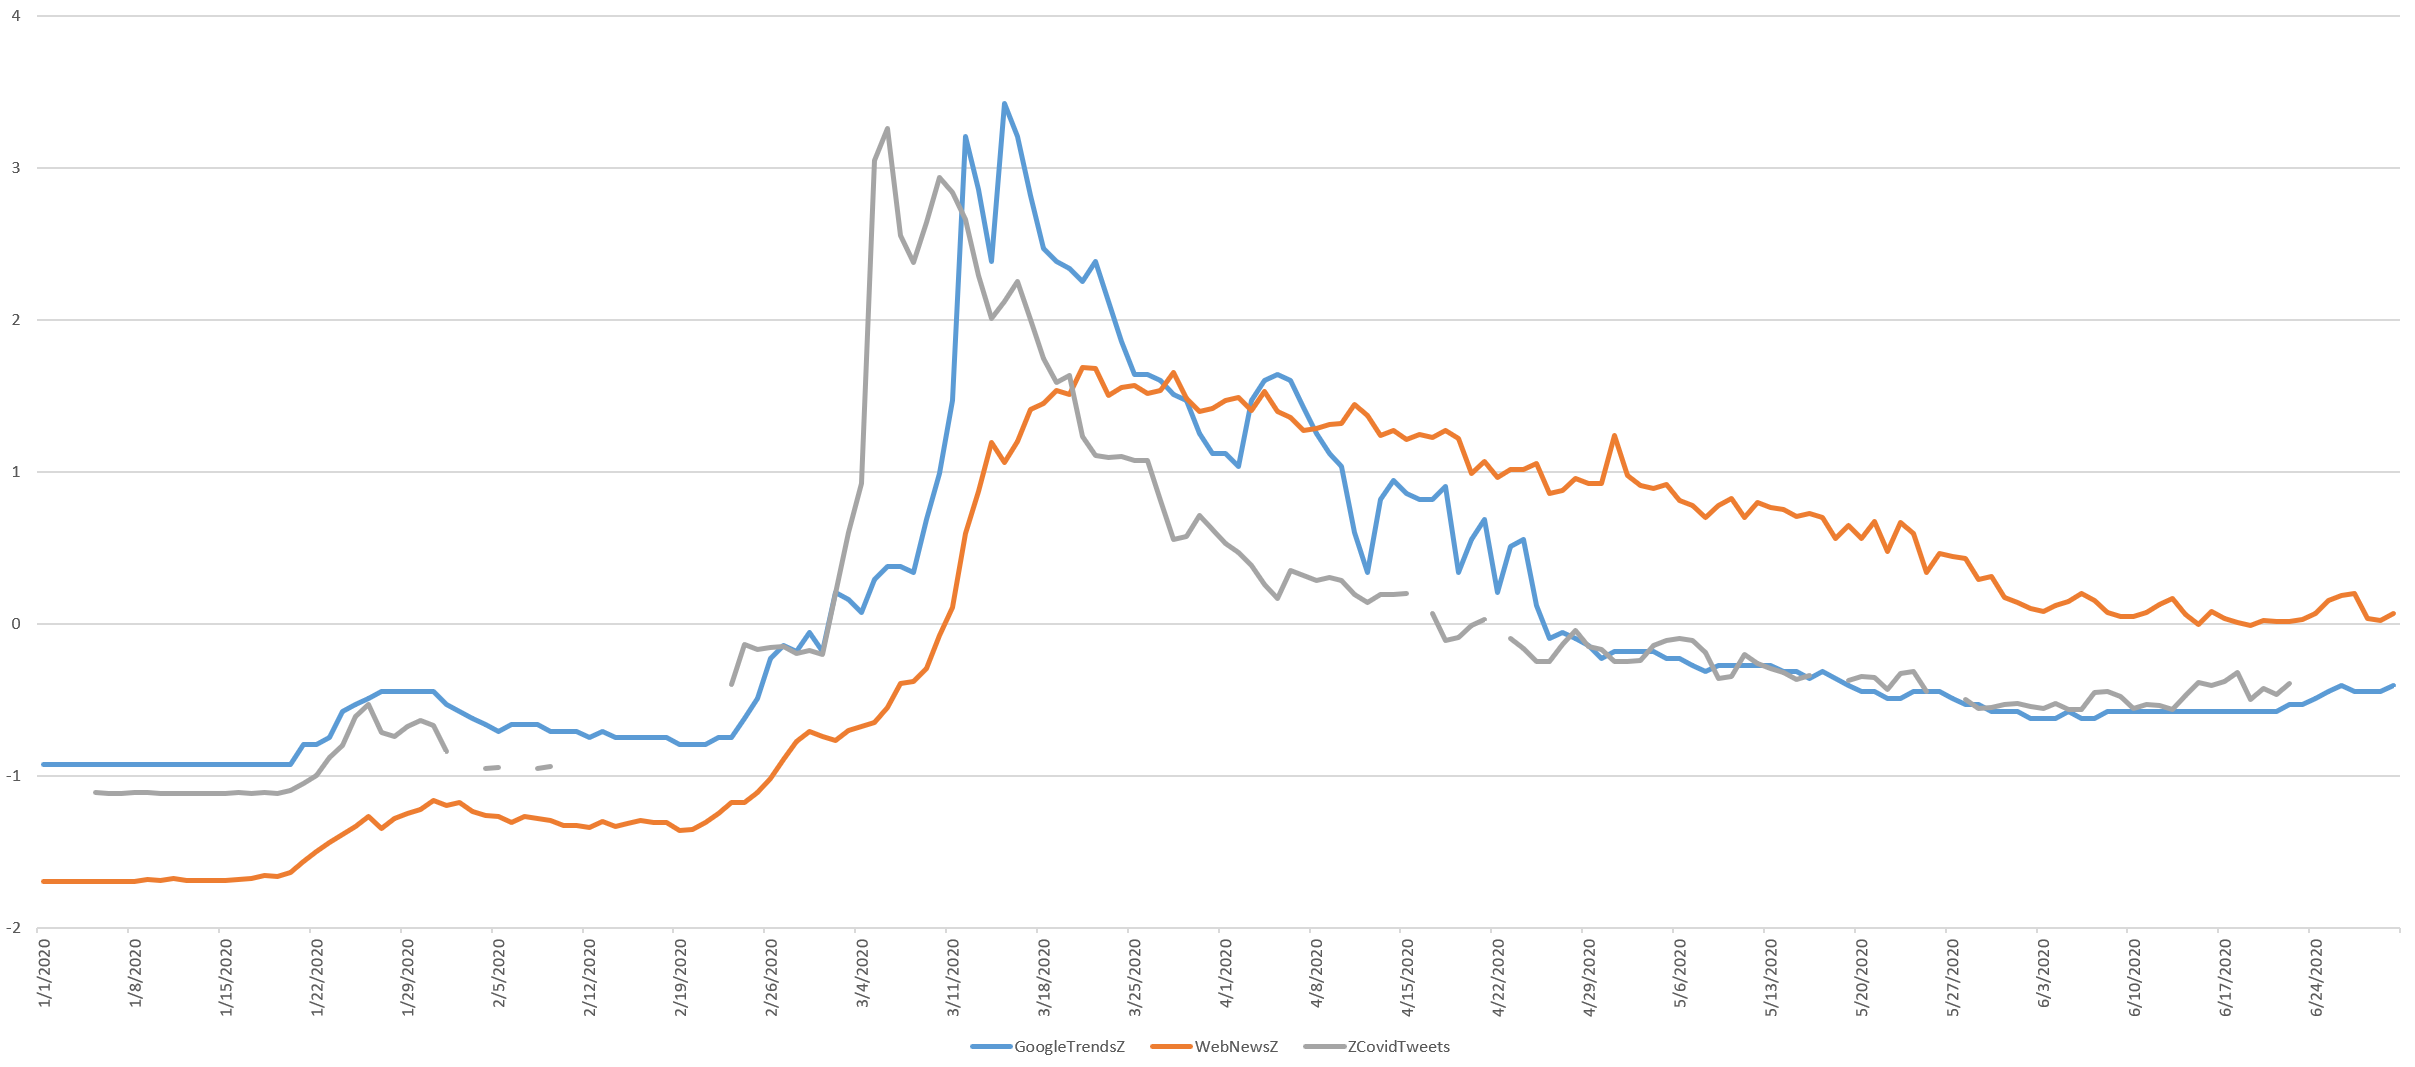
What about the relative narrative response curves across the three mediums of Twitter, online news ("covid OR coronavirus") and Google Trends ("coronavirus") searches? The timeline below compares their respective Z-scores, showing that all three follow similar trajectories, from their initial January bumps to their March surges to their declines over time. Twitter exhibits the most vertical surge in early March, from March 2 to a peak on March 6, followed by Google Trends from March 9 to a peak on March 15 and online news, which slows a much more continuous rampup rather than a singular vertical surge, running from around March 3 to a peak on March 21. Both Twitter and Google Trends have sharply decreased over time, while online news coverage remains elevated. All three have leveled off since around June 3.
Overall, Google Trends and Twitter are correlated at r=0.79, Google Trends and online news at r=0.64 and online news and Twitter at r=0.48.