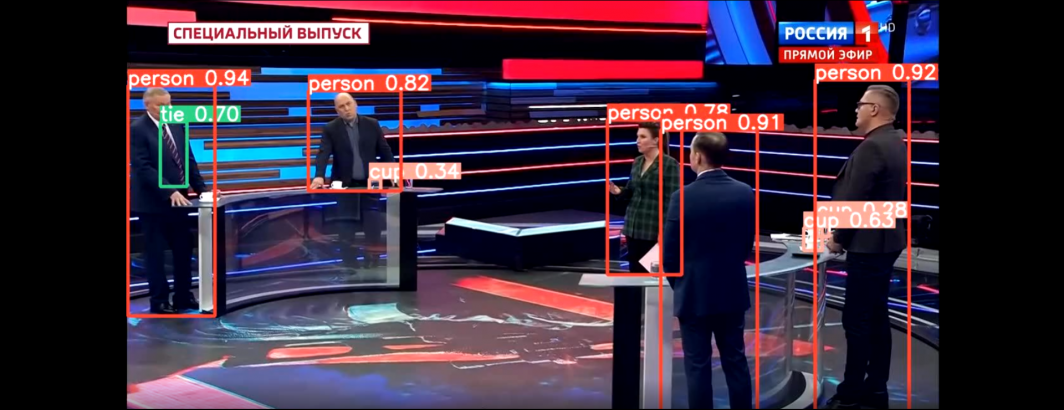
Yesterday we demonstrated applying the YOLOv5x pretrained COCO model to a single Russian television news broadcast. Today we are going to demonstrate how to apply it at scale to perform object detection over the entire 24/7 coverage of Russia 1 over the last two weeks showing how trivial the underlying workflow is to apply even advanced object detection like YOLO across 14 days (336 hours) of television news coverage.
The instructions below rely on our previously configured quad-core V100 GCE VM, which has the necessary libraries and drivers installed.
First, we install YOLO:
pip install -qr https://raw.githubusercontent.com/ultralytics/yolov5/master/requirements.txt
Given the high IO load of this workflow with all of the parallel streaming downloads, rapid file creation through unzipping, and random file reading and writing, we recommend creating a GCE VM with ~50-100GB of RAM and working entirely in a RAM disk, but you could also run this workflow at reduced speed on an SSD disk:
mkdir /dev/shm/YOLO
cd /dev/shm/YOLO
We want to process all shows on Russia 1 from November 11 to 24 inclusive, so we'll use a simple one-liner to generate the list of dates and then download the Visual Explorer inventory files for those dates:
#make date list...
start=20221111; end=20221124; while [[ ! $start > $end ]]; do echo $start; start=$(date -d "$start + 1 day" "+%Y%m%d"); done > DATES

#get the inventory files
rm -rf JSON
mkdir JSON
time cat DATES | parallel --eta 'wget -q https://storage.googleapis.com/data.gdeltproject.org/gdeltv3/iatv/visualexplorer/RUSSIA1.{}.inventory.json -P ./JSON/'
rm IDS; find ./JSON/ -depth -name '*.json' | parallel --eta 'cat {} | jq -r .shows[].id >> IDS'
wc -l IDS
rm -rf JSON

#and make the LABELS subdirectory where we will write all of the object detections to
mkdir LABELS
Now we'll create a modified version of yesterday's YOLO runner script. This one does not create the annotated images and writes all of the label annotations to a single shared "LABELS" subdirectory. It also allows the images directory to be passed as a command line option.
Save the following script to "run_yololabel.py":
import torch
import os
import sys

#load the model...
model = torch.hub.load('ultralytics/yolov5', 'yolov5x')

#run a directory of images...
directory = sys.argv[1]
for filename in os.listdir(directory):
    f = os.path.join(directory, filename)
    fout = os.path.join('./LABELS/', filename)
    if os.path.isfile(f):
        results = model(f)
        f = open(fout + '.labels', 'w'); print(results.pandas().xyxy[0], file=f); f.close();
Now we'll create a shell script that automates the workflow of downloading the Visual Explorer ZIP file for a given broadcast, unpacking it, running all of its images through the YOLO runner Python script above and cleaning up.
Save the following script to "run_downlabelshow.sh":
#!/bin/sh
rm -rf $1.IMAGES
mkdir $1.IMAGES
wget -q https://storage.googleapis.com/data.gdeltproject.org/gdeltv3/iatv/visualexplorer/$1.zip -P ./$1.IMAGES/
unzip -n -q -j -d ./$1.IMAGES/ ./$1.IMAGES/$1.zip
rm $1.IMAGES/$1.zip
python3 ./run_yololabel.py ./$1.IMAGES/
rm -rf $1.IMAGES
And make it executable:
chmod 755 run_downlabelshow.sh
You can run the script over a single show like:
mkdir LABELS
time ./run_downlabelshow.sh RUSSIA1_20221123_220000_Sudba_cheloveka_s_Borisom_Korchevnikovim
And see how well it utilizes the GPU via:
nvidia-smi -l 1
In the case of our V100 GCE VM you can see the specific configuration we are using:
YOLOv5 🚀 2022-11-23 Python-3.7.3 torch-1.12.1+cu102 CUDA:0 (Tesla V100-SXM2-16GB, 16161MiB)
Finally, to run the entire 14 day collection of broadcasts (171 distinct broadcasts in all totaling 587,529 images at 1280×720 resolution):
time cat IDS | parallel --eta -j 4 './run_downlabelshow.sh {}'
On this quad-core V100 GCE VM, we found that running 4 processes in parallel allowed us to achieve 75-85% GPU utilization and process the more than half million images in just under 1 hour 55 minutes – around 85 images per second, including the time taken to download and unzip each Visual Explorer ZIP file. Note that this represents an entirely unoptimized pipeline designed for maximal simplicity for the sake of demonstration.
You can download the complete set of all annotations:
In all, 293,760 out of the 587,529 images (49.99%) contained at least one recognized object and there were 1,547,085 total recognized objects of 81 types. Just under 86% of airtime contained at least one person, capturing the centrality of people to television news. Ties were found in 28% of airtime, reflecting the density of formal suit-and-tie dress, with 15.5% of airtime containing a chair, 9.2% a cup and 3.9% a potted plant, reflecting its ubiquity as decor.
To examine the labels in more detail, we'll create a Perl script to parse the results.
Save the following script to "parseyololabels.pl":
#!/usr/bin/perl

opendir(DIR, $ARGV[0]);
while(readdir(DIR)) {
    if ($_!~/\.labels/) { next; };
    ($date) = $_=~/_(\d\d\d\d\d\d\d\d)_/; $DATES{$date}++;
    my $buf; open(FILE, "$ARGV[0]/$_"); read(FILE, $buf, (-s FILE)); close(FILE);

    my %hash;
    while($buf=~/\d+\s+([a-z].*)/g) { $label = $1; $label=~s/\s+$//; if ($label=~/\]/) { next;};  $LABELSBYDATE{$date}{$label}++; $LABELS{$label}++; $hash{$label}=1; $CNT_LABELSTOT++; };
    #there might be multiple "person" labels per image, so make a tally that is per-image/airtime as well.
    foreach (keys %hash) { $LABELSBYDATE_AIRTIME{$date}{$_}++; $LABELS_AIRTIME{$_}++; }; #counts each label once per image...
    $CNT_FRAMES++;

    if ($counter++ % 10000 == 0) { print "Processing Labels $counter...\n"; };
    #if ($counter > 10000) { last; };
}
closedir(DIR);

print "Writing Output...\n";
@DATES = sort {$a <=> $b} keys %DATES;
@LABELS = sort keys %LABELS;

open(OUT, ">./TOTALS_BYLABEL.csv");
print OUT "TOTAL,$CNT_LABELSTOT\n";
foreach (sort {$LABELS{$b} <=> $LABELS{$a}} keys %LABELS) {
    print OUT "$_,$LABELS{$_}\n";
}
close(OUT);

open(OUT, ">./TOTALS_BYAIRTIME.csv");
print OUT "TOTAL,$CNT_FRAMES\n";
foreach (sort {$LABELS_AIRTIME{$b} <=> $LABELS_AIRTIME{$a}} keys %LABELS_AIRTIME) {
    print OUT "$_,$LABELS_AIRTIME{$_}\n";
}
close(OUT);

open(OUT, ">./TIMELINE_BYLABEL.csv");
my $row; foreach (@DATES) { $row.=",$_"; }; print OUT $row . "\n";
foreach $label (@LABELS) {
    my $row = $label; foreach $date (@DATES) { $row.=",$LABELSBYDATE{$date}{$label}"; }; print OUT $row . "\n";
}
close(OUT);

open(OUT, ">./TIMELINE_BYAIRTIME.csv");
my $row; foreach (@DATES) { $row.=",$_"; }; print OUT $row . "\n";
foreach $label (@LABELS) {
    my $row = $label; foreach $date (@DATES) { $row.=",$LABELSBYDATE_AIRTIME{$date}{$label}"; }; print OUT $row . "\n";
}
close(OUT);
And run it:
chmod 755 ./parseyololabels.pl
time ./parseyololabels.pl ./LABELS/
It generates several files, including label-level summaries and a timeline:
- Label Histogram By Total Recognized Appearances.
- Label Histogram By Airtime (Number Of Images Containing At Least One Appearance).
- Daily Timeline Of Total Recognized Appearances.
- Daily Timeline Of Airtime (Number Of Images Each Day Containing At Least One Appearance).
You can see a treemap breakdown of the labels by number of appearances:

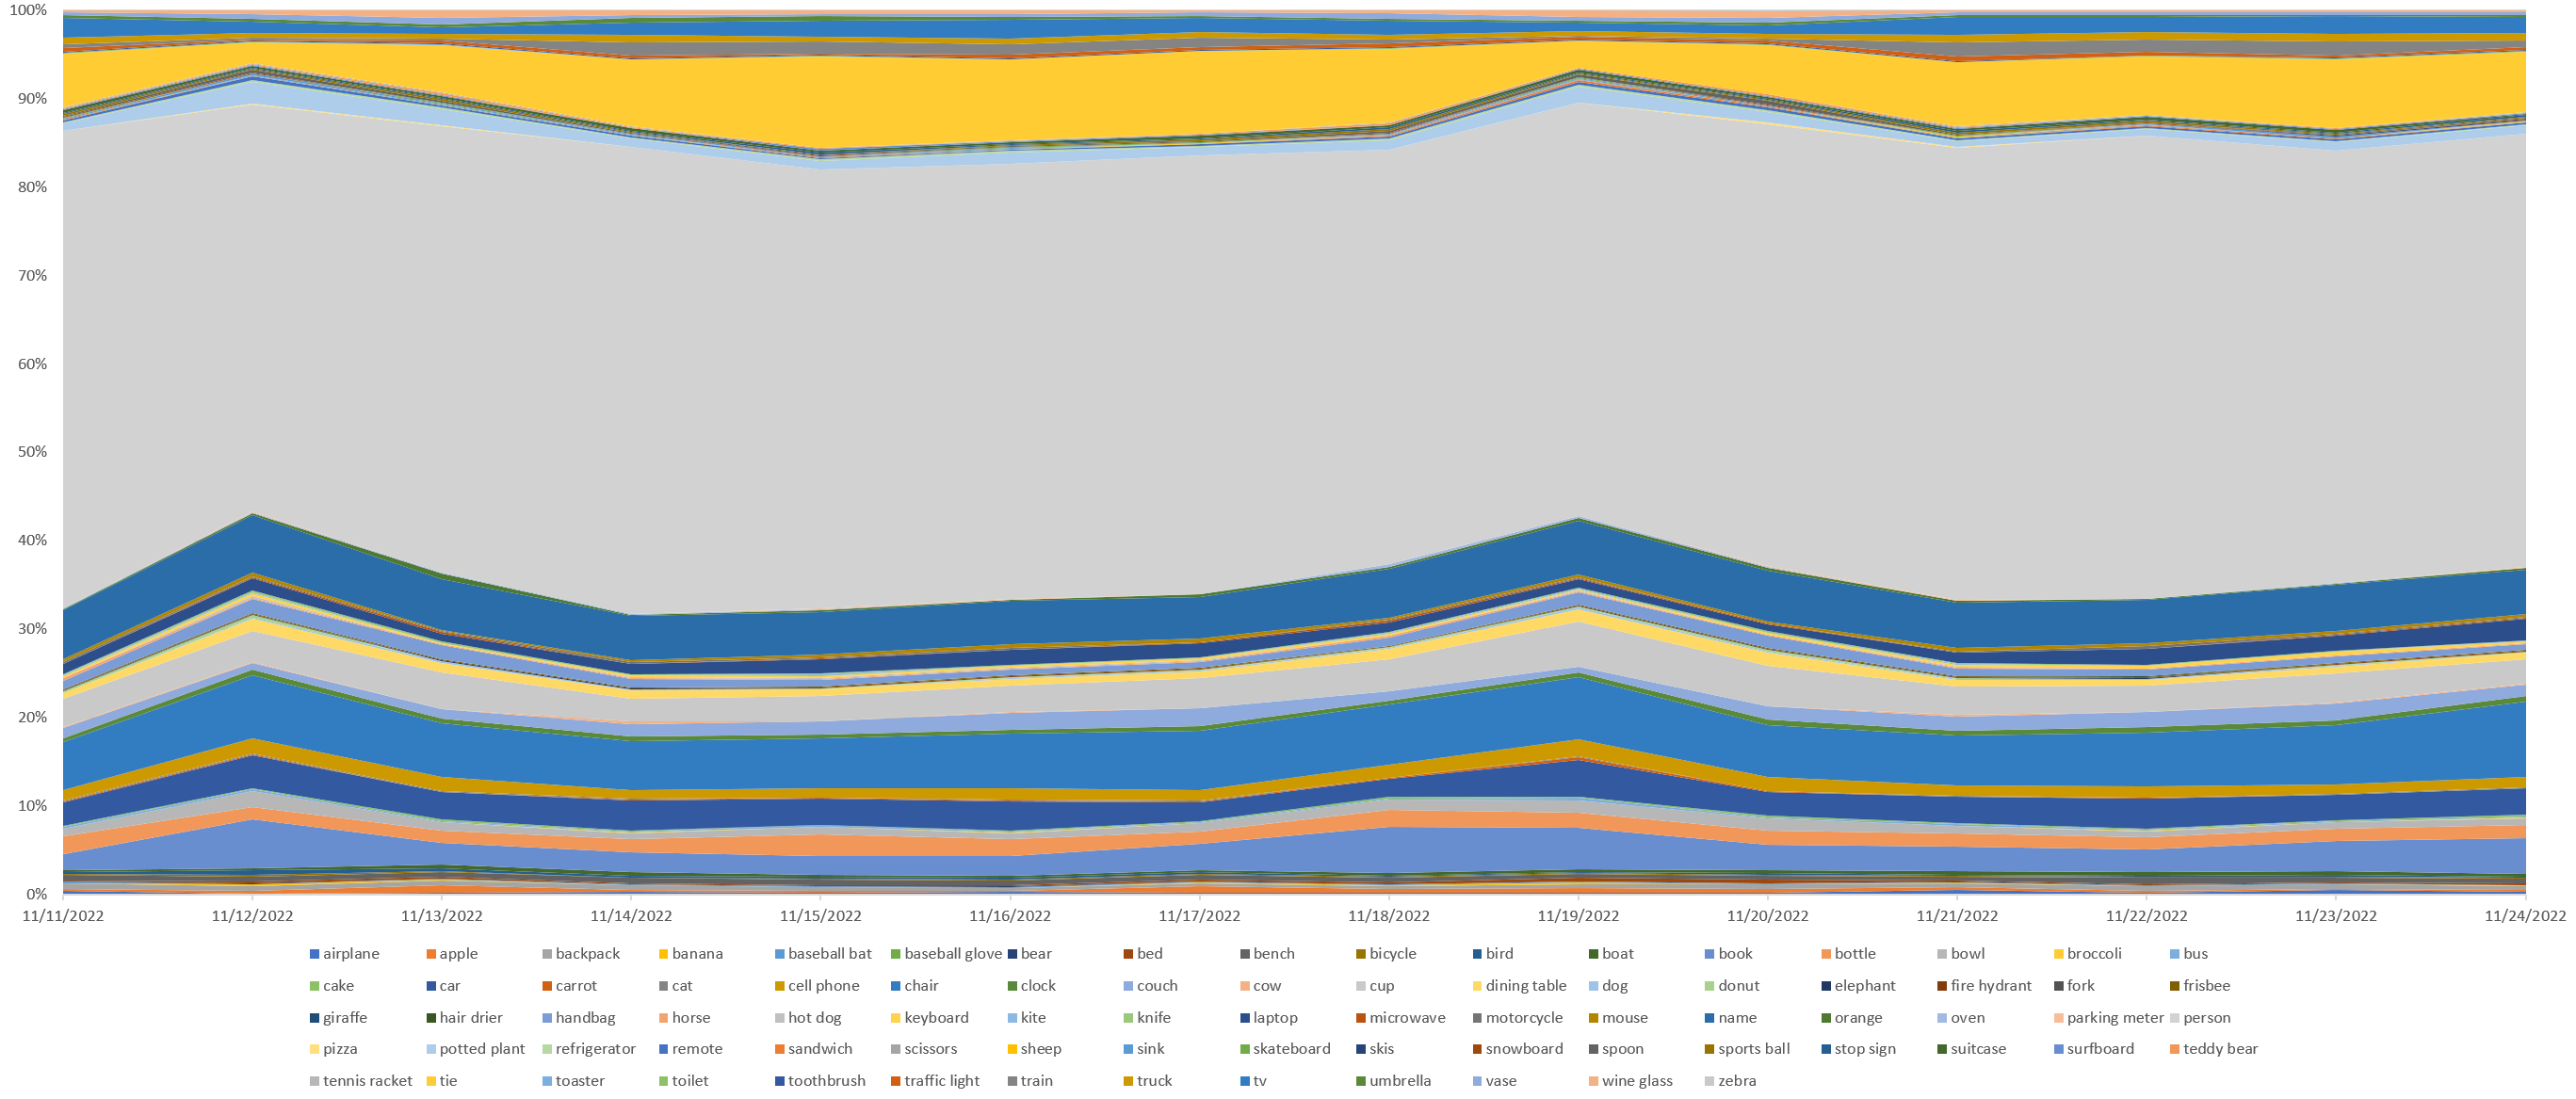
Looking at the labels over time as a percentage of labels each day in a stacked area graph, the dominance of "person" remains relatively consistent over time, though "tie" does fade on certain days and "book" seems to have high and low-density days.
We hope this gives you an idea of just how easy it is to run highly advanced computer vision analyses at scale over television news using the Visual Explorer!