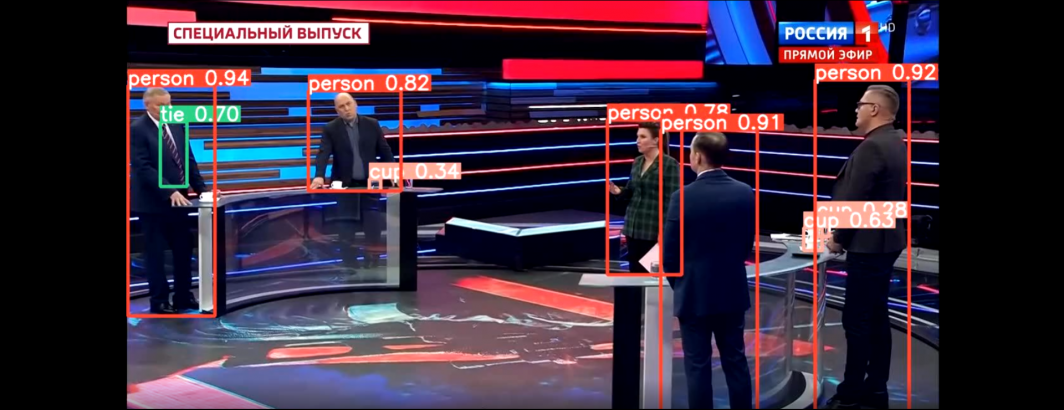
Last year, in collaboration with the Internet Archive, we demonstrated using the open source YOLO object detection package to analyze two weeks of Russian television news coverage. Today we are excited to showcase a powerful new experiment in collaboration with the Archive applying the new YOLOv8's pretrained image classifier to one year of Russia 1's "60 Minutes" series, cataloging how the core visual narratives of one of Russia's most high-profile news shows have changed over the course of the invasion. Using the Visual Explorer's "video ngrams" that extract one frame every 4 seconds from each broadcast we used YOLOv8's image classification mode to analyze all 321 episodes of 60 Minutes captured in the Archive's holdings from May 19, 2022 through February 17, 2023 (due to technical issues there have been several monitoring outages, so some episodes are not captured in the archive). Note that the Archive's Russia 1 collection actually stretches back to March 26, 2022, but EPG data (which tells which show corresponds to which minute of airtime) was not available until May 19th so that is the earliest we can filter for specific shows.
In all, YOLOv8 running on a GCE VM with a Tesla T4 GPU was used to scan 714,188 total video ngram frames from 60 Minutes, representing 2.85 million seconds of airtime (796 hours), with YOLO reporting a categorical visual inventory for every image. The end result is a complete inventory of the core visual narratives (as seen through the lens of the the pretrained ImageNet taxonomy) of one of Russia's foremost domestic news programs at 4 second resolution over nearly a year of war.
As just one example of the immense power of this approach, what if we use this dataset to make a timeline of the density of military-related imagery on 60 Minutes by day from May 2022 to present? In the timeline below we compute the percentage of all analyzed frames each day that matched the search "("tank OR half_track OR rifle OR assault_rifle OR warplane OR missile OR projectile OR cannon OR military_uniform OR bulletproof_vest OR mortar OR aircraft_carrier OR submarine")", which are the most common military-related ImageNet tags that appear in the dataset. The Y axis below is the percentage of 60 Minutes airtime that day that depicted military-related imagery, meaning a value of "15" means that 15% of the 60 Minutes airtime that day contained at least one of the military-related themes above prominently onscreen.
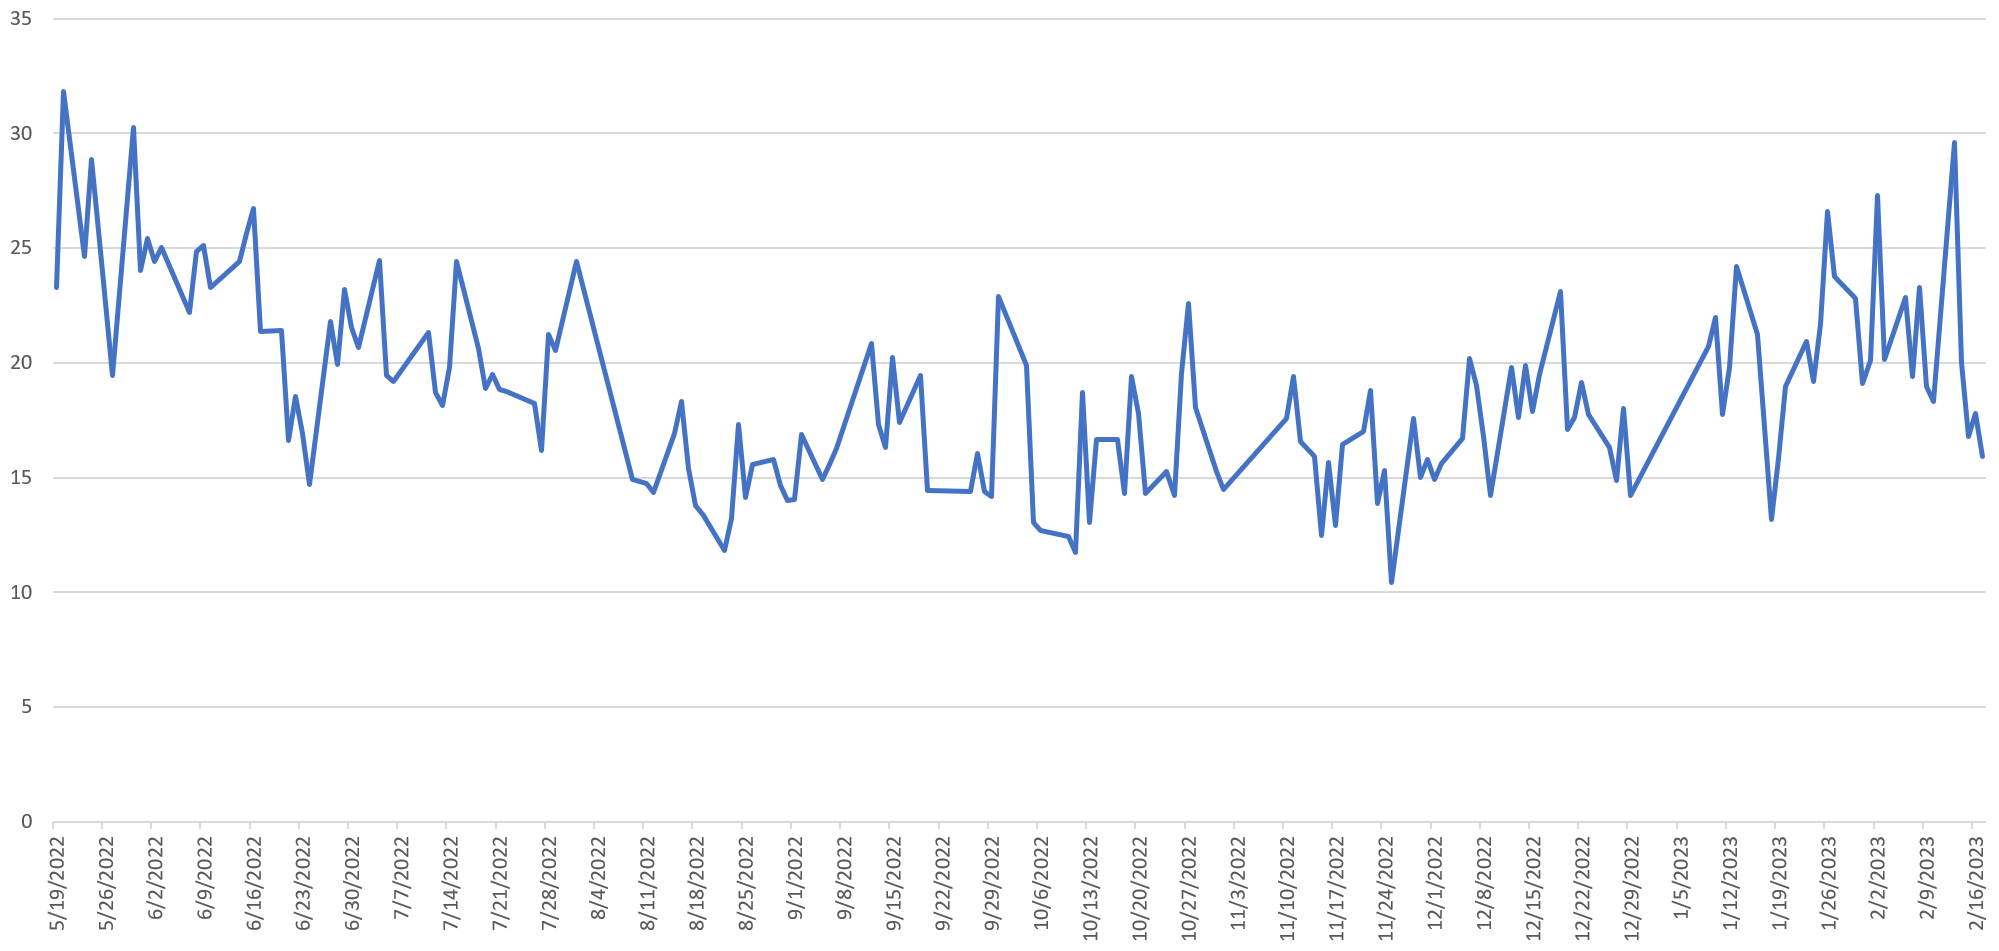
A clear trend is visible in the timeline above, but the spikiness of the data masks it slightly, so here is the same timeline, but smoothed using a 5-day rolling average:
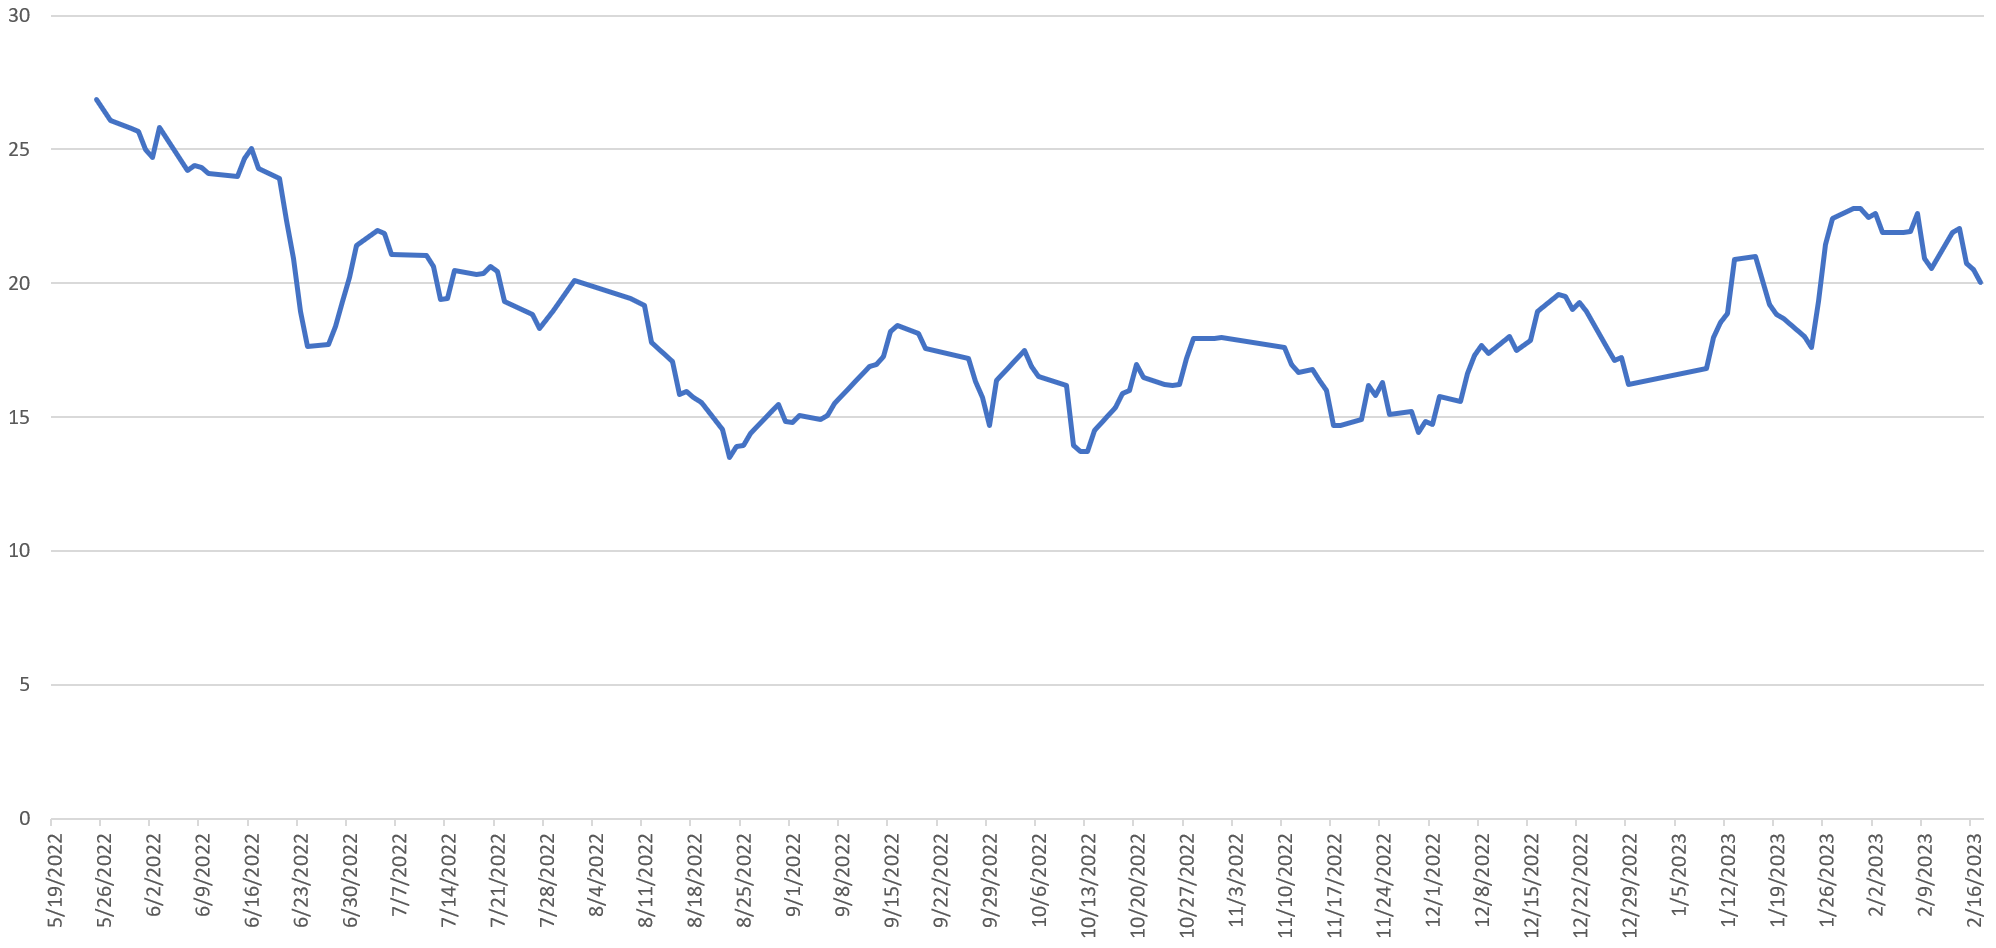
Here the trend is unmistakable. During the data's start in mid-May 2022, more than a quarter of 60 Minutes' daily airtime revolved around military imagery. This declined steadily through mid-August and remained level until early December 2022. It began climbing from mid-December 2022 through early this month, but has leveled off again and begun actually declining.
In that singular chart above lies the power of the combination of the Archive's TV News Archive, the Visual Explorer's "video ngrams" and applying tools like YOLO: the ability to catalog at scale visual narrative landscape of a nation's domestic narratives through the eyes of one of its most prominent news programs over nearly an entire year totaling more than 2.8 million seconds of airtime.
You can download the complete inventory:
- Complete YOLOv8M-CLS Annotation Dataset For Russia 1's 60 Minutes – May 19, 2022 – February 17, 2023. (87MB)
For the technically-minded, below is the step-by-step workflow we used. Our previous demo used the older YOLOv5, while the new YOLOv8 makes much of the workflow trivial to implement, vastly reducing the amount of effort required to run analyses of this scale. The instructions below rely on our previously configured 48-core Tesla T4 GCE VM, which has the necessary libraries and drivers installed.
Given the high IO load of this workflow with all of the parallel streaming downloads, rapid file creation through unzipping, and random file reading and writing, we recommend creating a GCE VM with ~300GB of RAM and working entirely in a RAM disk, but you could also run this workflow at reduced speed on an SSD disk. In this case, we used a VM with 300GB of RAM with a 150GB RAM disk. The entire workflow below was run out of "/dev/shm/YOLO" to absolutely maximize random IO.
First, install YOLOv8:
python3 -m pip install --upgrade pip
pip install ultralytics
And download a few helper utilities:
apt-get -y install parallel
apt-get -y install jq
Download the Archive's complete Russia 1 show inventory and filter it to extract just the list of 60 Minutes episodes (NOTE – as noted earlier, filtering like this requires EPG data, which was not added until May 19, 2022, excluding the first two months of the Archive's Russia 1 archive):
start=20220101; end=20230217; while [[ ! $start > $end ]]; do echo $start; start=$(date -d "$start + 1 day" "+%Y%m%d"); done > DATES
mkdir JSON
time cat DATES | parallel --eta 'wget -q https://storage.googleapis.com/data.gdeltproject.org/gdeltv3/iatv/visualexplorer/RUSSIA1.{}.inventory.json -P ./JSON/'
rm IDS.tmp; find ./JSON/ -depth -name '*.json' | parallel --eta 'cat {} | jq -r .shows[].id >> IDS.tmp'
grep '60_minut' IDS.tmp | sort > IDS
Now download all of the video ngram ZIP files and unpack them:
mkdir IMAGES
time cat IDS | parallel --eta 'wget -q https://storage.googleapis.com/data.gdeltproject.org/gdeltv3/iatv/visualexplorer/{}.zip -P ./IMAGES/'
time find ./IMAGES/ -depth -name '*.zip' | parallel --eta 'unzip -n -q -d ./IMAGES/ {} && rm {}'
And finally, run YOLOv8's pretrained ImageNet-based classifier model across each broadcast. After extensive experimentation, we found that the "medium" model yielded the best balance of speed and accuracy. Larger models in some cases had reduced accuracy on this specific dataset in terms of recognizing military-related imagery. With YOLOv8's CLI, this requires literally just a single line to run across the entire 714,000 image archive:
time cat IDS | parallel -j 1 --eta 'yolo classify predict model=yolov8m-cls.pt source="./IMAGES/{}/*.jpg" &> ./IMAGES/{}.CLASSIFY.M.TXT'
That's it! The end result will be a file ending with ".CLASSIFY.M.TXT" for each broadcast. Each file looks like the following, with an informational header and one row per image:
Ultralytics YOLOv8.0.43 🚀 Python-3.7.3 torch-1.13.1+cu117 CUDA:0 (Tesla T4, 14910MiB)
YOLOv8m-cls summary (fused): 103 layers, 17043656 parameters, 0 gradients, 42.7 GFLOPs

image 1/2262 /dev/shm/IMAGES/RUSSIA1_20220729_143000_60_minut/RUSSIA1_20220729_143000_60_minut-000001.jpg: 224x224 stage 0.19, television 0.11, vending_machine 0.04, home_theater 0.04, monitor 0.04, 7.5ms
image 2/2262 /dev/shm/IMAGES/RUSSIA1_20220729_143000_60_minut/RUSSIA1_20220729_143000_60_minut-000002.jpg: 224x224 car_wheel 0.29, Petri_dish 0.14, spotlight 0.13, electric_fan 0.09, water_bottle 0.04, 7.5ms
image 3/2262 /dev/shm/IMAGES/RUSSIA1_20220729_143000_60_minut/RUSSIA1_20220729_143000_60_minut-000003.jpg: 224x224 coil 0.43, maze 0.09, electric_fan 0.05, spotlight 0.04, car_wheel 0.02, 7.2ms
image 4/2262 /dev/shm/IMAGES/RUSSIA1_20220729_143000_60_minut/RUSSIA1_20220729_143000_60_minut-000004.jpg: 224x224 magnetic_compass 0.49, odometer 0.27, electric_fan 0.04, washer 0.02, car_wheel 0.02, 7.3ms
image 5/2262 /dev/shm/IMAGES/RUSSIA1_20220729_143000_60_minut/RUSSIA1_20220729_143000_60_minut-000005.jpg: 224x224 spotlight 0.11, fountain 0.10, theater_curtain 0.09, home_theater 0.07, cinema 0.06, 7.3ms
We then created a simple PERL script called "parse_yoloclassify.pl" to merge all of these files together and remove the headers and extraneous information from each line, translating them into a simple TSV file of "imagefilename,labels" and additionally creating a timeline of military-related imagery for the graph above:
#!/usr/bin/perl

open(FILE, $ARGV[0]); binmode(FILE, ":utf8");
open(OUT, ">$ARGV[0].PARSED.TXT"); binmode(OUT, ":utf8");
while(<FILE>) {
   $image = ''; $labels = ''; ($image, $labels) = $_=~/\/([^\/]+\.jpg): \d+x\d+ (.*), /;
   if ($image ne '') {
      $date = ''; ($year, $mon, $day) = $image=~/_(\d\d\d\d)(\d\d)(\d\d)_/; $TIMELINE_TOT{"$mon/$day/$year"}++;
      if ($labels=~/tank|half_track|rifle|assault_rifle|warplane|missile|projectile|cannon|military_uniform|bulletproof_vest|mortar|aircraft_carrier|submarine/) { $TIMELINE_MATCH{"$mon/$day/$year"}++; };
      print OUT "$image\t$labels\n";
   }
}
close(FILE);
close(OUT);

open(OUT, ">./TIMELINE.TXT");
foreach $date (keys %TIMELINE_TOT) {
   $tot = $TIMELINE_TOT{$date} + 0;
   $match = $TIMELINE_MATCH{$date} + 0;
   print OUT "$date\t$match\t$tot\n";
}
close(OUT);
And run:
cat ./IMAGES/*.TXT > ./MERGED.TXT
time ./parse_yoloclassify.pl ./MERGED.TXT
Analyzing 2.8 million seconds of airtime via 714,000 video ngram images is quite literally that simple using YOLOv8!