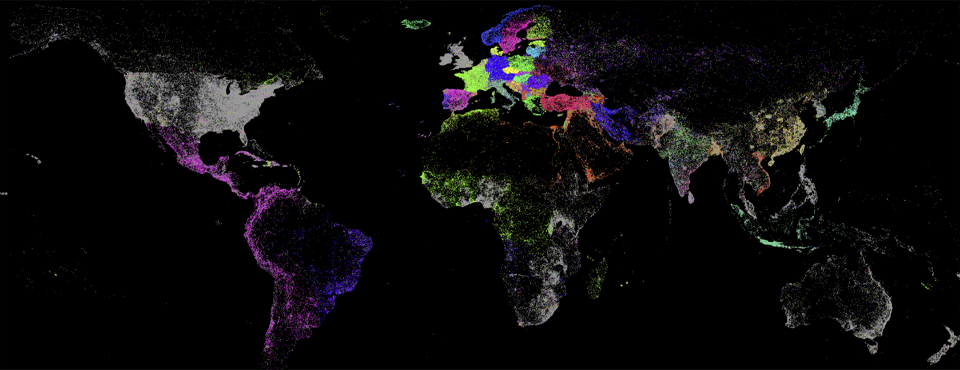
Today's look back comes from a 2016 GDELT Blog post summarizing the massive complexities and unique needs inherent in analyzing GDELT's planetary-scale catalog of global society. It offers a reminder that exploring datasets of GDELT's magnitude and complexity involves intrinsically different processes and mindsets from traditional "small data" studies of human society.
What would it look like to use massive computing power to see the world through others’ eyes, to break down language and access barriers, facilitate conversation between societies, and empower local populations with the information and insights they need to live safe and productive lives? By quantitatively codifying human society’s events, dreams and fears, can we map happiness and conflict, provide insight to vulnerable populations, and even potentially forecast global conflict in ways that allow us as a society to come together to deescalate tensions, counter extremism, and break down cultural barriers? That’s the vision of the GDELT Project.
Creating this vision starts with data. At the most fundamental level, GDELT is a realtime open data index over global human society, inventorying the world’s events, emotions, images and narratives as they happen through mass live data mining of the world’s public information streams. Creating one of the world’s largest social sciences datasets that spans news, television, images, books, academic literature and even the open web itself, mass machine translating it all from 65 languages, codifying millions of themes and thousands of emotions, leveraging algorithms from simple keyword matches to massive statistical models to deep learning approaches, GDELT leverages the full power of today’s bleeding edge technologies to create a computational view of the world that makes it possible to understand what’s happening across the planet.
Cataloging local events requires using local sources in their original languages. GDELT today operates one of the world’s largest open programs to catalog, monitor and translate the media of the non-Western world, ensuring that it is able to peer deeply into the most remote regions of the earth and help those voices to be heard. This is in stark contrast to the majority of all other monitoring initiatives today, which rely primarily on Western sources and very small samples of translated local content.
Taken together, the various collections that make up GDELT represent one of the largest open archives of codified human society today. The dataset’s unique scale, scope, and coverage means working with GDELT requires special attention to analytic methodology, given the number of data modalities contained within that span spatial, temporal and network attributes, text and imagery, narratives and emotions, active and contextual dimensions, content and citation graphs, and so on. The dataset’s global focus means it captures the chaotic and conflicting nature of the real world, from false and conflicting information to shifting narratives and baselines to a constant exponential increase in monitoring volume, requiring analytic constructs that are capable of not only coping with this environment, but ideally conveying the resident uncertainty to end users. There is a need not only for polished print-ready visualizations optimized for consumption by policymakers and the general public that summarize macro-level patterns, but also for interactive displays that allow hypothesis testing and live “speed of thought” exploration of massive multi-modality data.
For example, could one build a dashboard that displays macro-level “bursts” of unrest using the news data, bringing to bear the human rights data to highlight those pockets of unrest occurring in areas prone to human rights abuses, leveraging the academic literature to identify the underlying influencing factors and top academic experts on that area based on the citation graph, and finally using the television data to show how American domestic television is portraying the evolving situation. Visualizations that combine the spatial, temporal, and network dimensions are of especial interest, as are those that examine the data in innovative ways that help uncover new and nonobvious underlying patterns.