In 2014 Kalev wrote a thought piece for the Knight Foundation's blog on the power of measuring the emotional undercurrents of the news. A decade later, these thoughts are ever more relevant and central to understanding global societal behavior in an ever more uncertain world.
The world’s news media isn’t merely a clinical chronology of global events: It is a lens onto the dreams and fears of our global world. As journalists report on events from the mundane to the extraordinary, they do so through the lens of their own experiences, beliefs and views. Each unfolding detail is contextualized through the stories of those participating and affected. Coverage of a labor protest goes beyond the impersonal who, when and where, to the what and why, capturing the rich tapestry of emotional undercurrents that define human life.
What if we could quantitatively measure and visualize the emotion of the world’s news? Identifying areas where reporting on a disease outbreak devolves from concern to panic or where a previously downtrodden region suddenly finds a euphoric new vision for the future? Creating a global “happiness” ranking of the world’s cities and identifying the topics that appear in the most positive and most negative light in every corner of the globe? In short, what if we could reimagine the news not as a simple conveyer of facts, but as a coarse reflection onto the emotions, the dreams and fears, of global society? Last week we released a dataset that does just that. Here’s how we got there.
It was just over half a century ago that the first computerized content analysis software, General Inquirer, debuted in the era of punch card computers. In the decades since tens of thousands of software packages and dictionaries have been developed to measure the intensity of nearly every imaginable emotion from a collection of text. Indeed, the computational measurement of emotion from news and social media has emerged as one of the hottest applications of the Big Data era. Yet, emotion is not measured merely as “positive” and “negative”; today’s tools can assess everything from “abashment” to “wrath” and hone in on the most subtle of emotional responses captured in a given document. Each emotion is output as a numeric score assessing its intensity in that document, allowing precise quantitative assessment over millions of documents in just a few minutes to visualize the ebbs and flows of the emotions of the news.
To explore what this might look like, we processed all 540,000 hours of English-language broadcasts held by the Internet Archive’s Television News Archive on the archive’s Virtual Reading Room as part of the Reimagining Libraries project using the GDELT Project’s new Global Content Analysis Measures system, which uses 18 major content analysis packages to assess 2,238 emotional and thematic dimensions of each broadcast. A timeline visualizer allows you to select an emotion and visualize its intensity by day over the last four years of American television news, as well as a breakdown of which television networks use it more frequently.
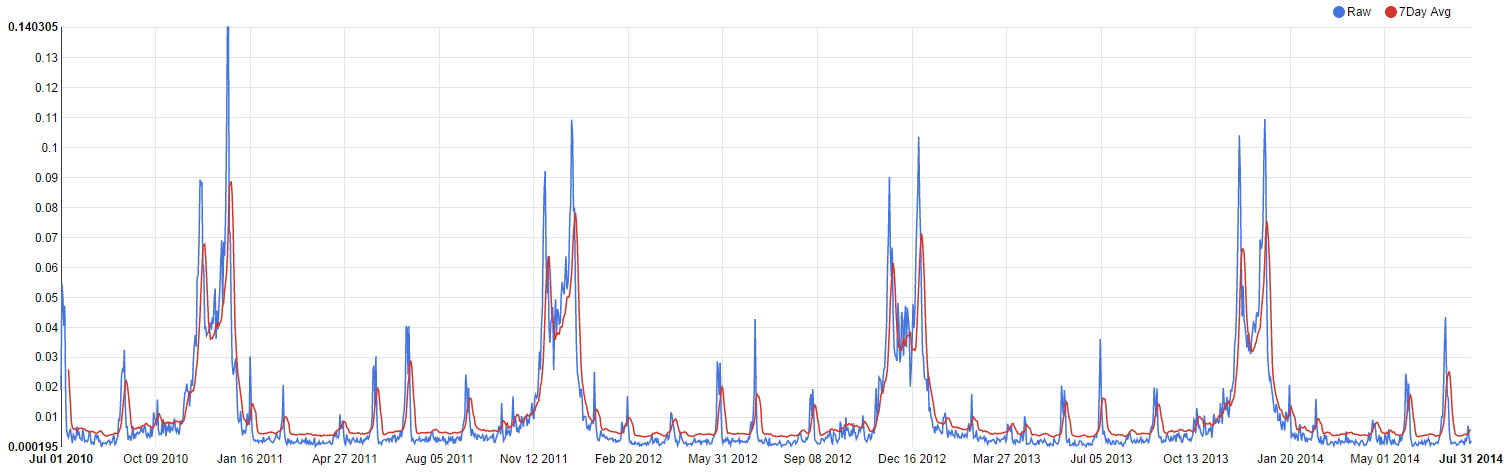
The graph at the top of this blog post charts the intensity of the emotion “anxiety” in American television news over the past four years (see the live timeline). The greatest intensity of the emotion occurred on June 29, 2012, as a massive thunderstorm complex swept the nation and left 3 million people in the dark. The October 2013 U.S. government shutdown is also starkly visible, with the buildup of anxiety beginning in mid-September and not fully returning to normal until late December. On a happier note, the cyclic discussion of the holidays reflects their importance in societal life. Such graphs, while only approximations, yield a powerful view into the emotional reaction of a nation as it undergoes everything from extraordinary tragedies to the annual arrival of the holiday seasons.
In the coming weeks, the GDELT Project, which monitors print, broadcast and Web-based news from across the world, will begin assessing all 2,238 emotions from every news report it finds as part of its daily global trends analysis, creating the world’s first global emotional assessment of the world’s news every day. In the meantime we have released the complete set of emotional scores from the Internet Archive’s Television News Archive on the GDELT Project website.
One can only imagine the possibilities as we peer beyond the factual details of the world’s news each day and take the first steps towards measuring, visualizing and exploring the emotional undercurrents of society: our global dreams and fears.