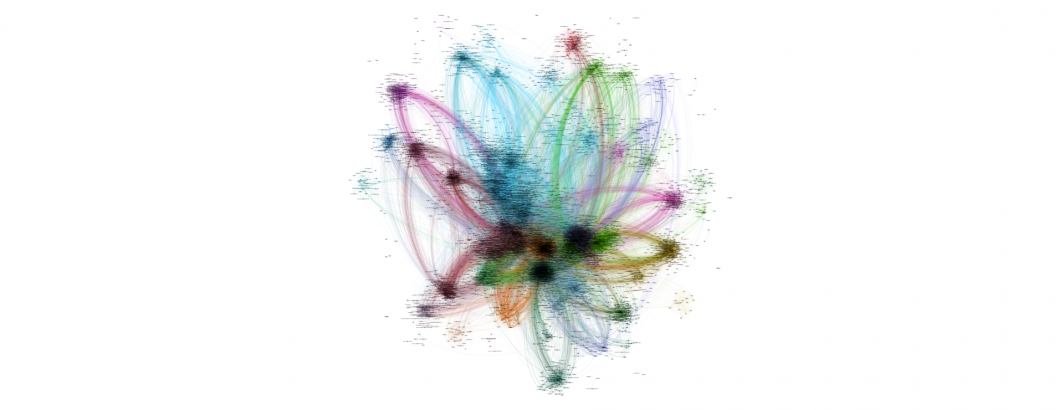
Increasing the threshold from the top 10,000 edges to the top 100,000 edges, the visualization below shows the top 0.0026% of the full 3.8-billion-edge graph.
You can download the visualization files for this graph below:

Increasing the threshold from the top 10,000 edges to the top 100,000 edges, the visualization below shows the top 0.0026% of the full 3.8-billion-edge graph.
You can download the visualization files for this graph below:
The Official GDELT Project Blog