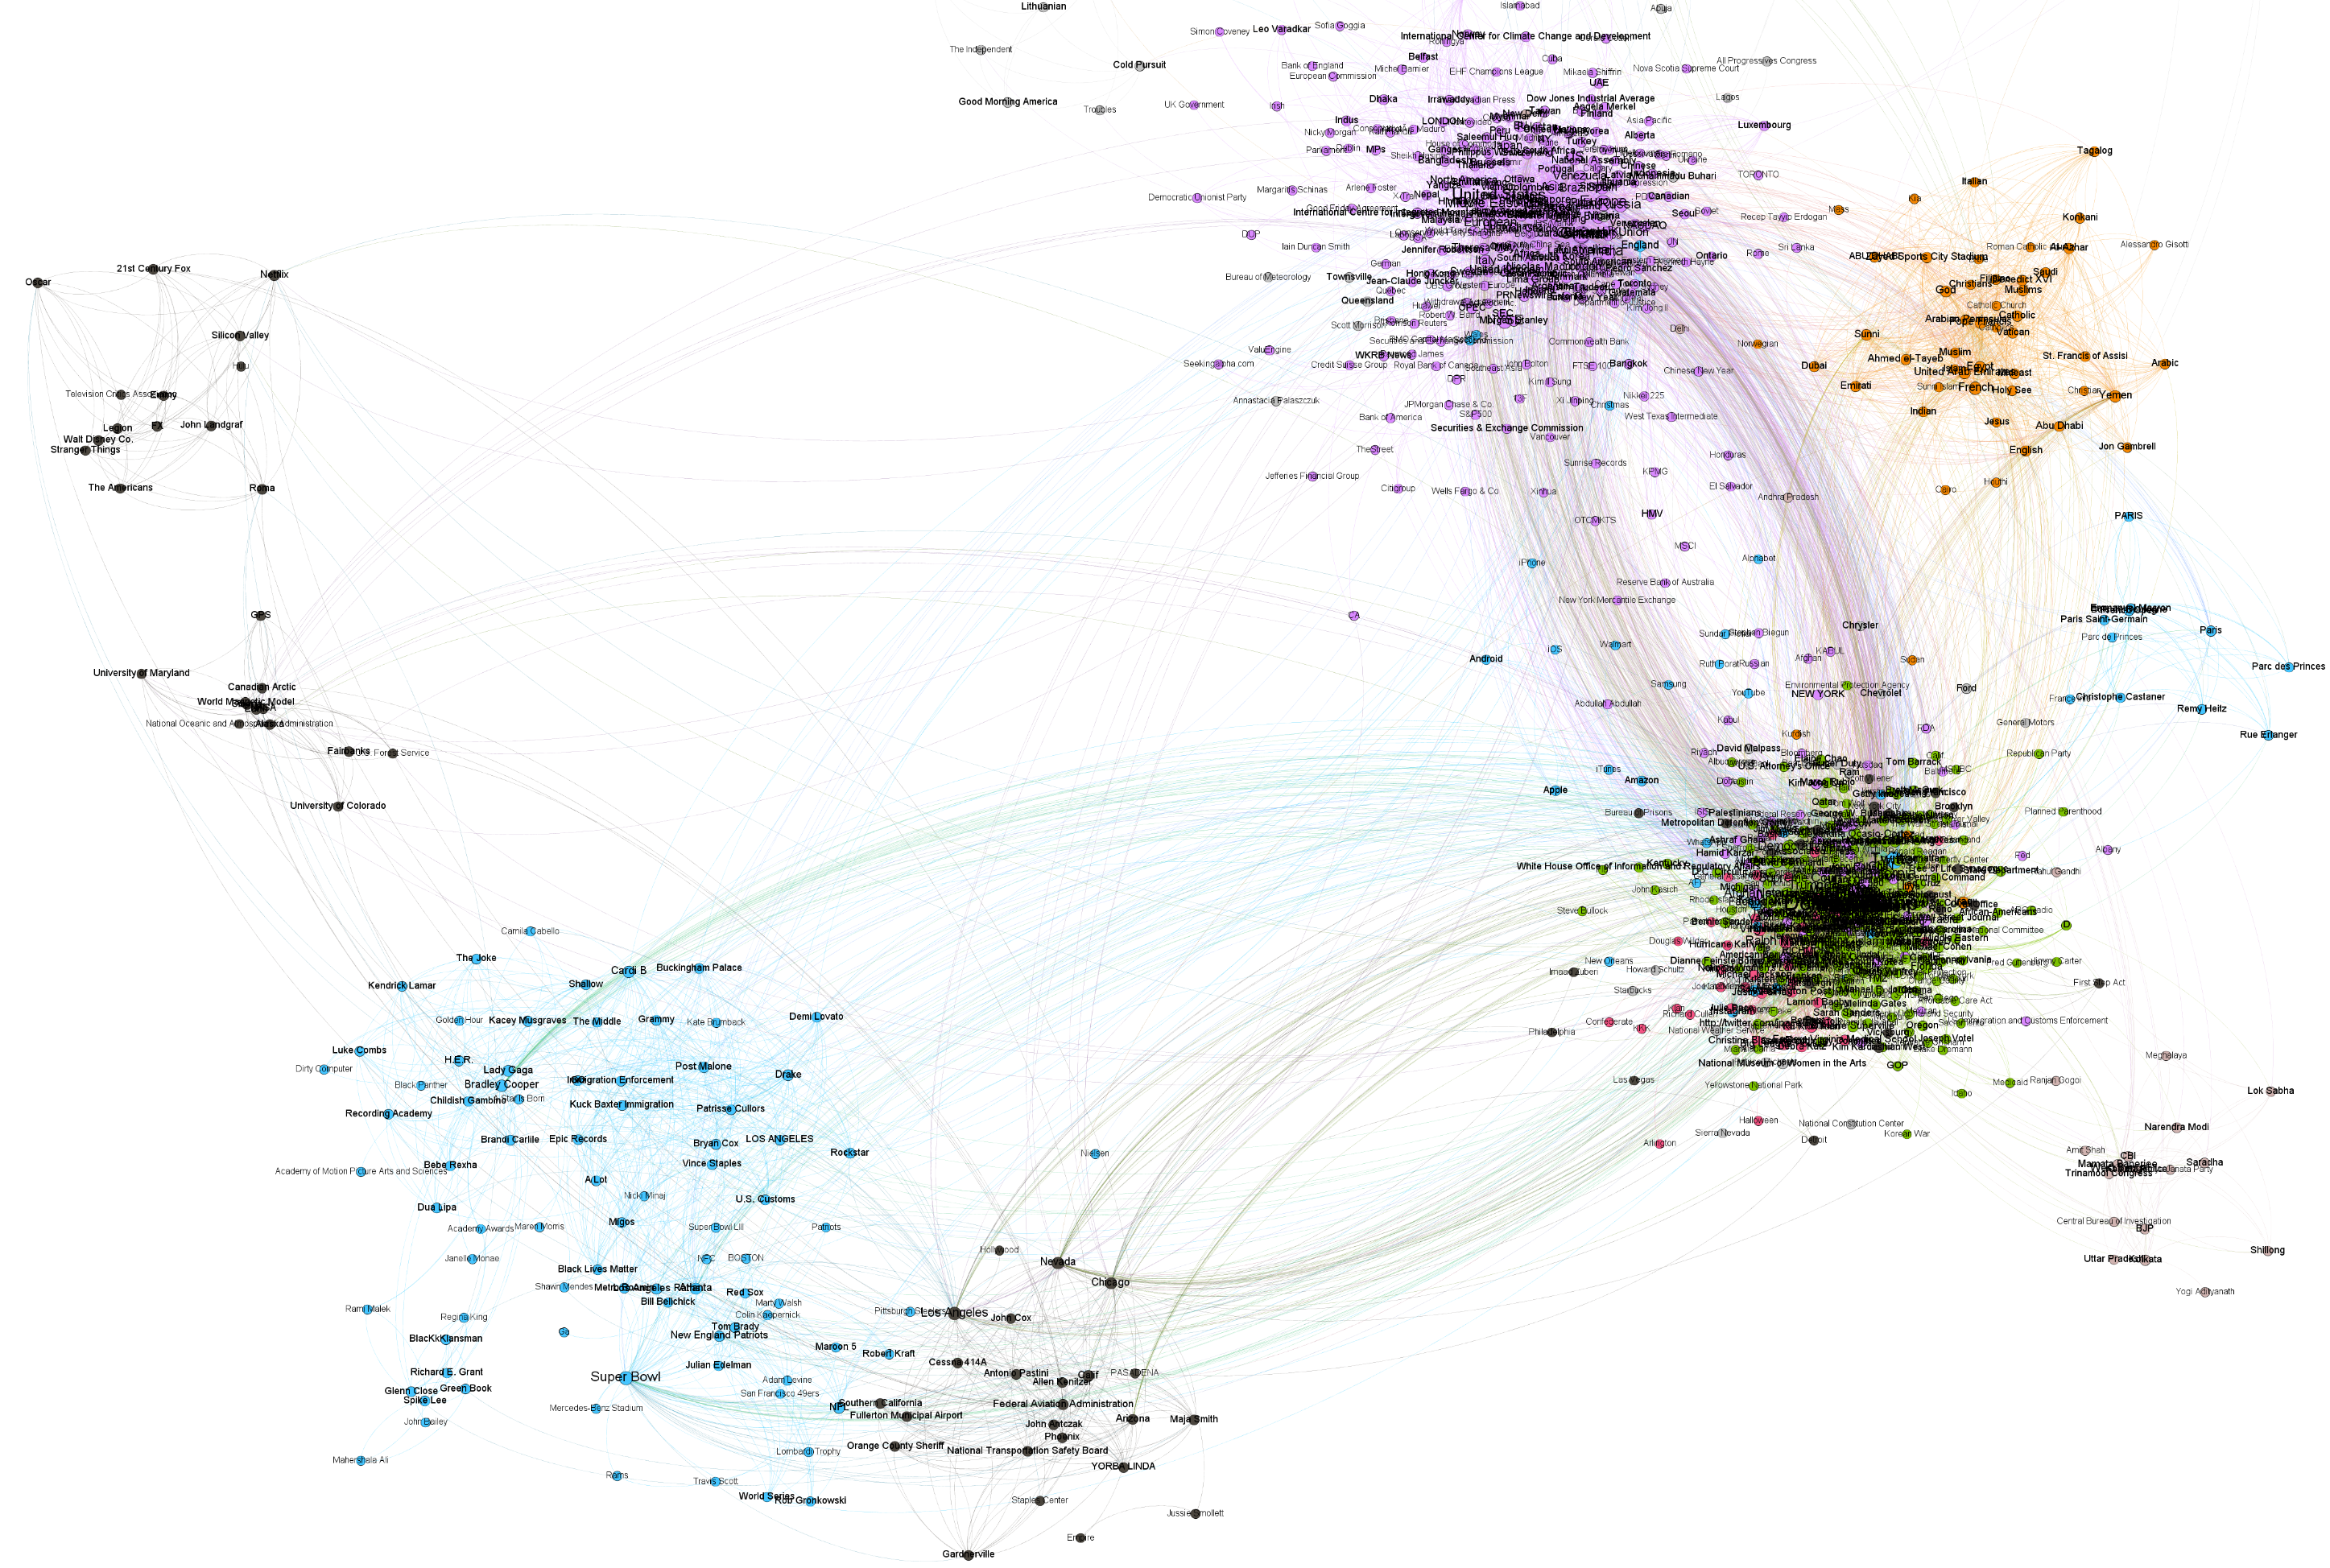
What would it look like to visualize the co-occurrences of the 11 billion entities from more than 100 million English language articles spanning the last three years in the GDELT Global Entity Graph extracted by Google's Cloud Natural Language API? With BigQuery and Gephi, creating beautiful visualizations of Cloud Natural Language API's extracted entities requires just a single SQL query that in 7.7 minutes constructs a graph encoding more than 24.5 billion co-occurrences among entities that have assigned MID IDs, reduces it to the top 1,500 strongest edges and outputs a weighted edge graph suitable for one-click import directly into Gephi, where it can be rendered into a final visualization in less than a minute.
The ability to start with a simple linear per-document entity list, permute it into a 24.5-billion co-occurrence graph and then reduce to the strongest 1,500-edge subgraph that can be readily visualized, all with a single SQL query that takes just a few minutes to run, really drives home the immense power of BigQuery to tackle any problem, even non-traditional tasks like graph construction and analysis.
To reduce the graph to the most meaningful entities, only those entities with non-null MID IDs were selected.
A special thanks to Felipe Hoffa for the original version of the SQL query.
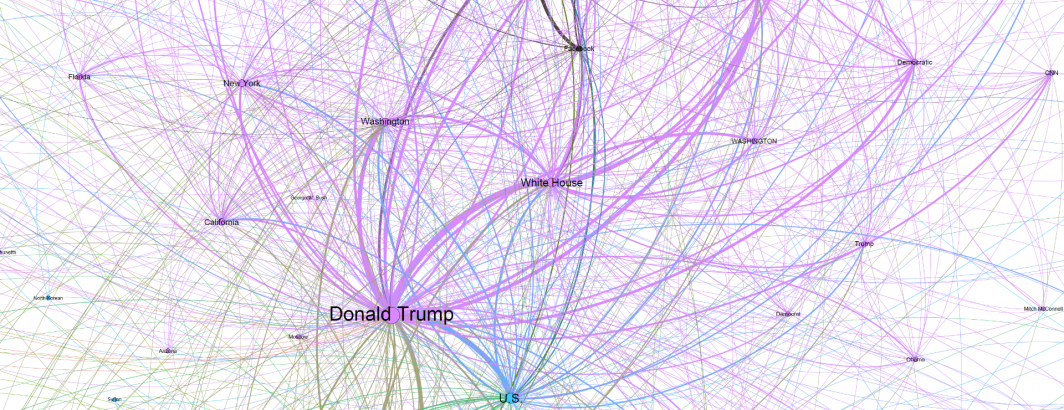
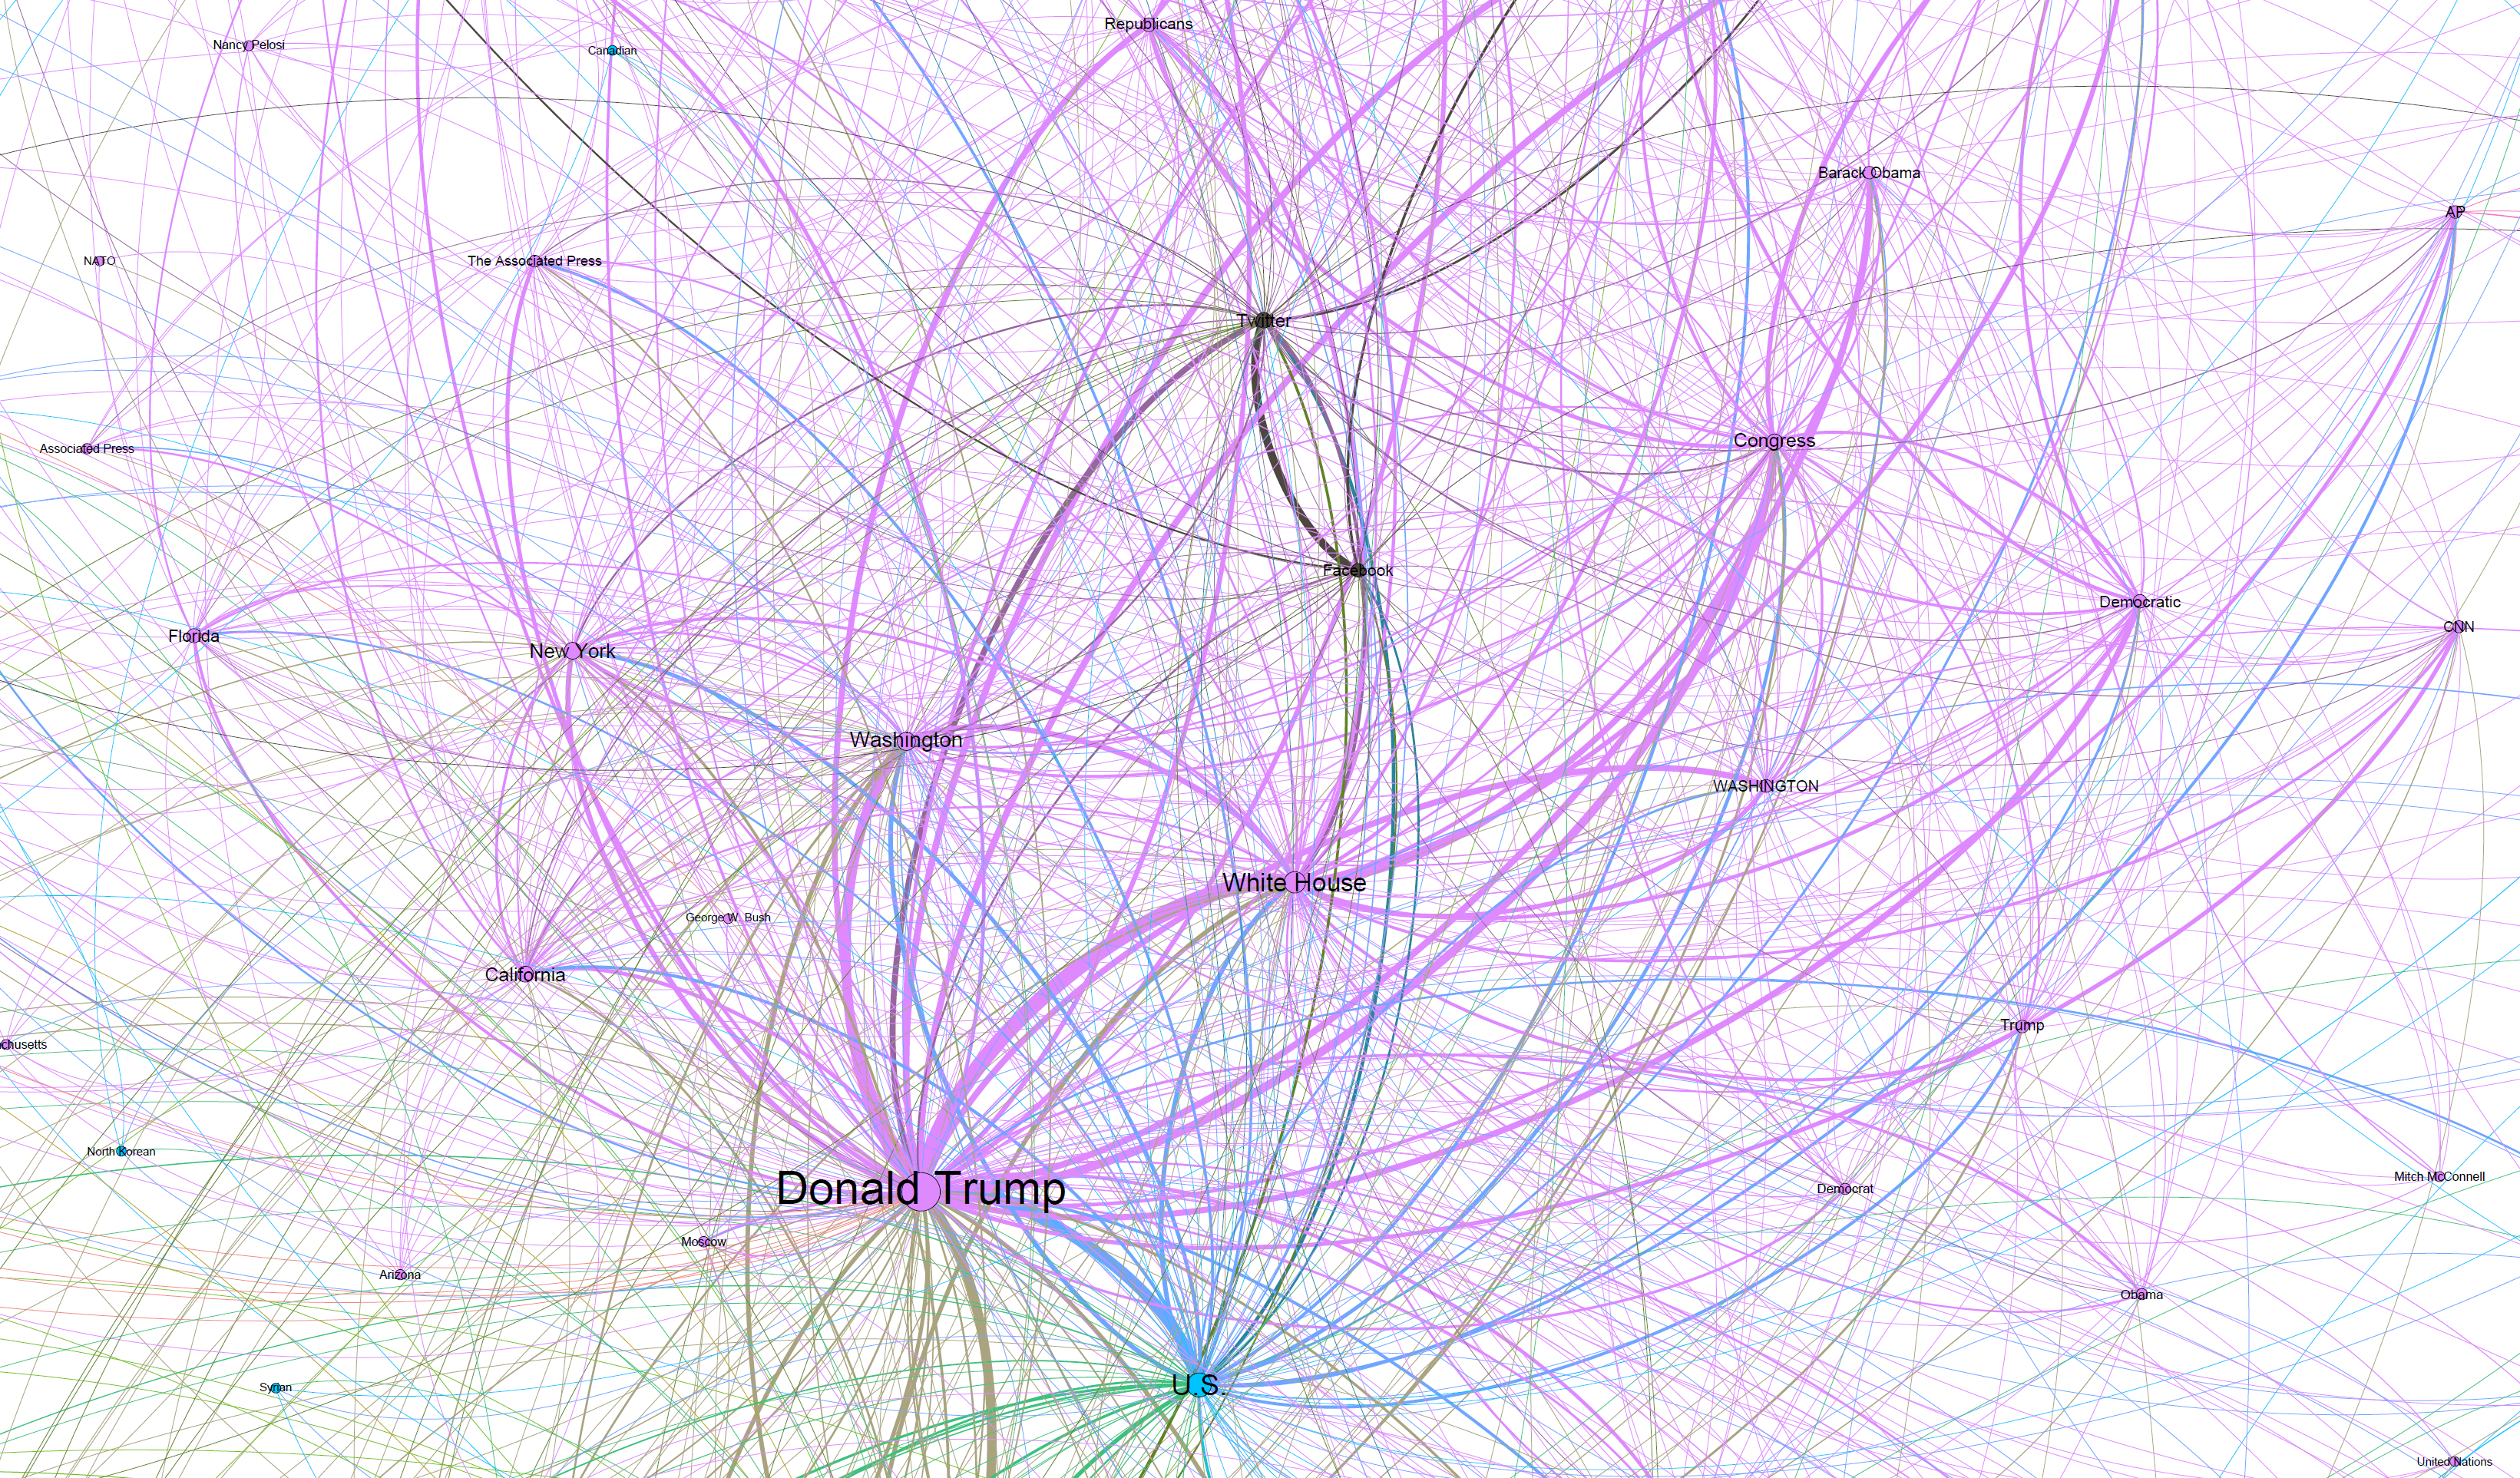
A zoomed version of the graph showing Donald Trump's centrality to the English-language press of the last three years can be seen below.

The complete graph can be downloaded in several different formats below:
- Preview Zoomed PNG (3K x 2K) Graph White Background.
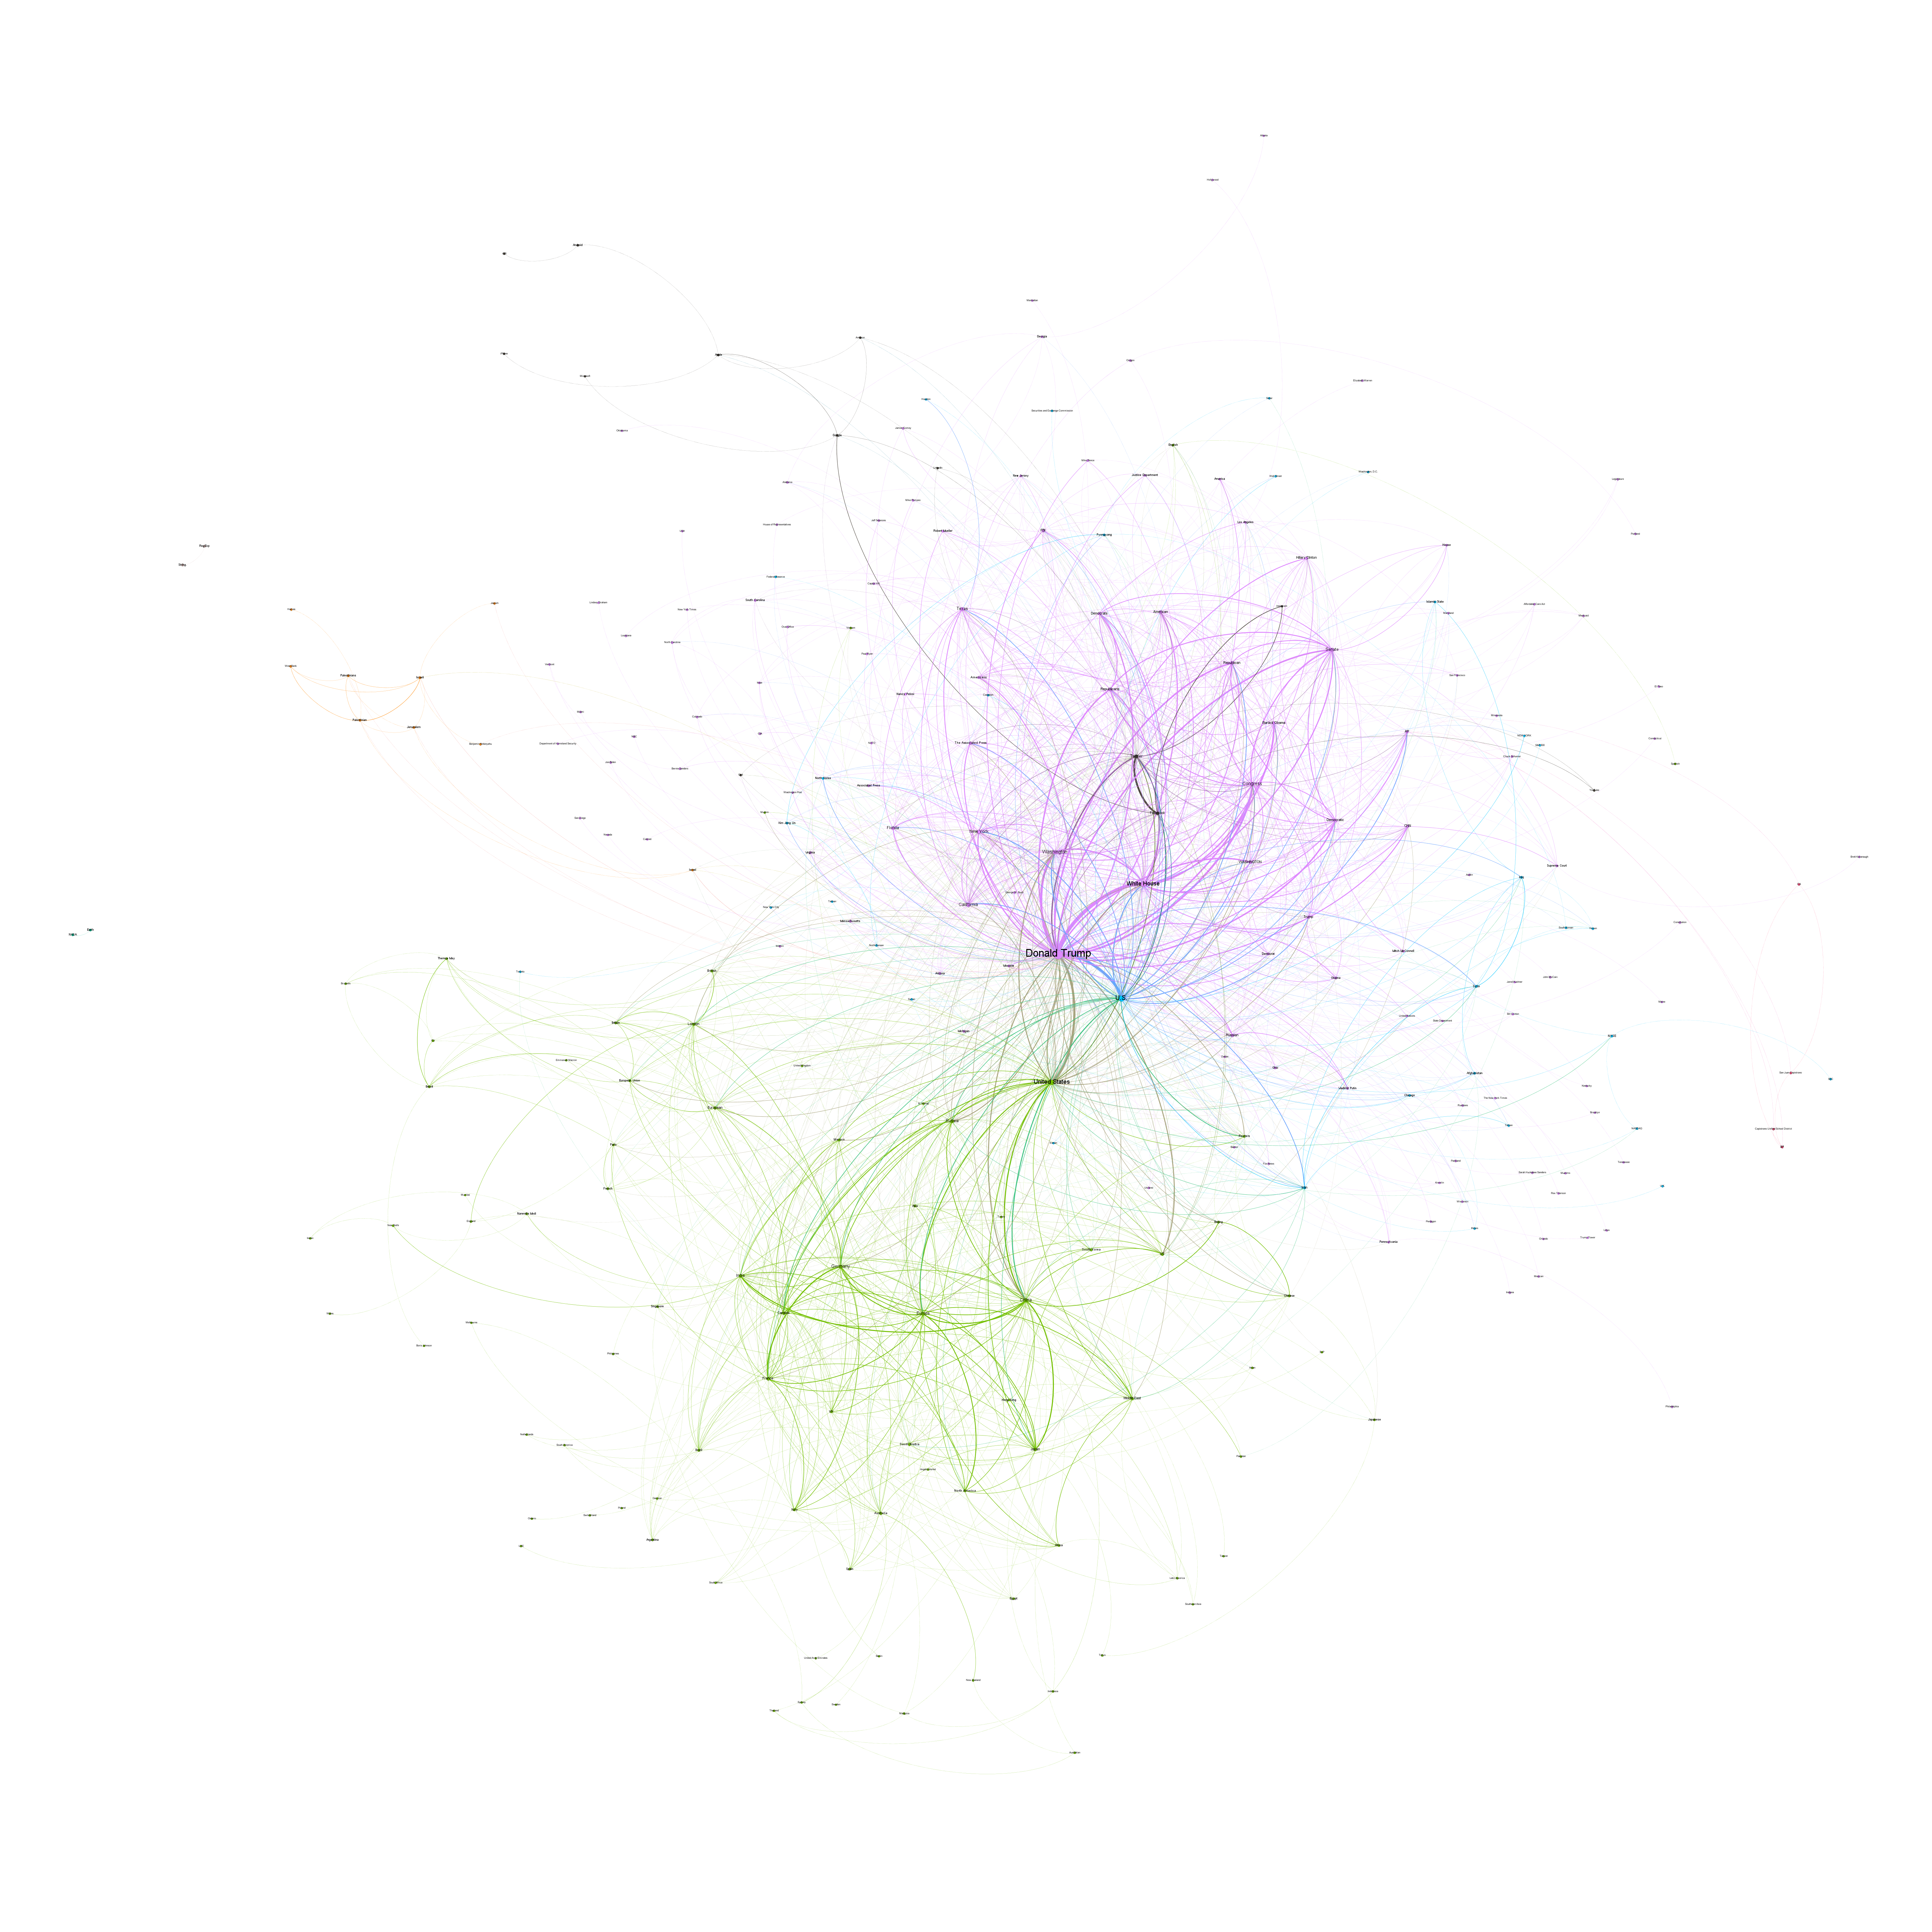
- Full Resolution PNG (6K x 6K) Graph White Background.
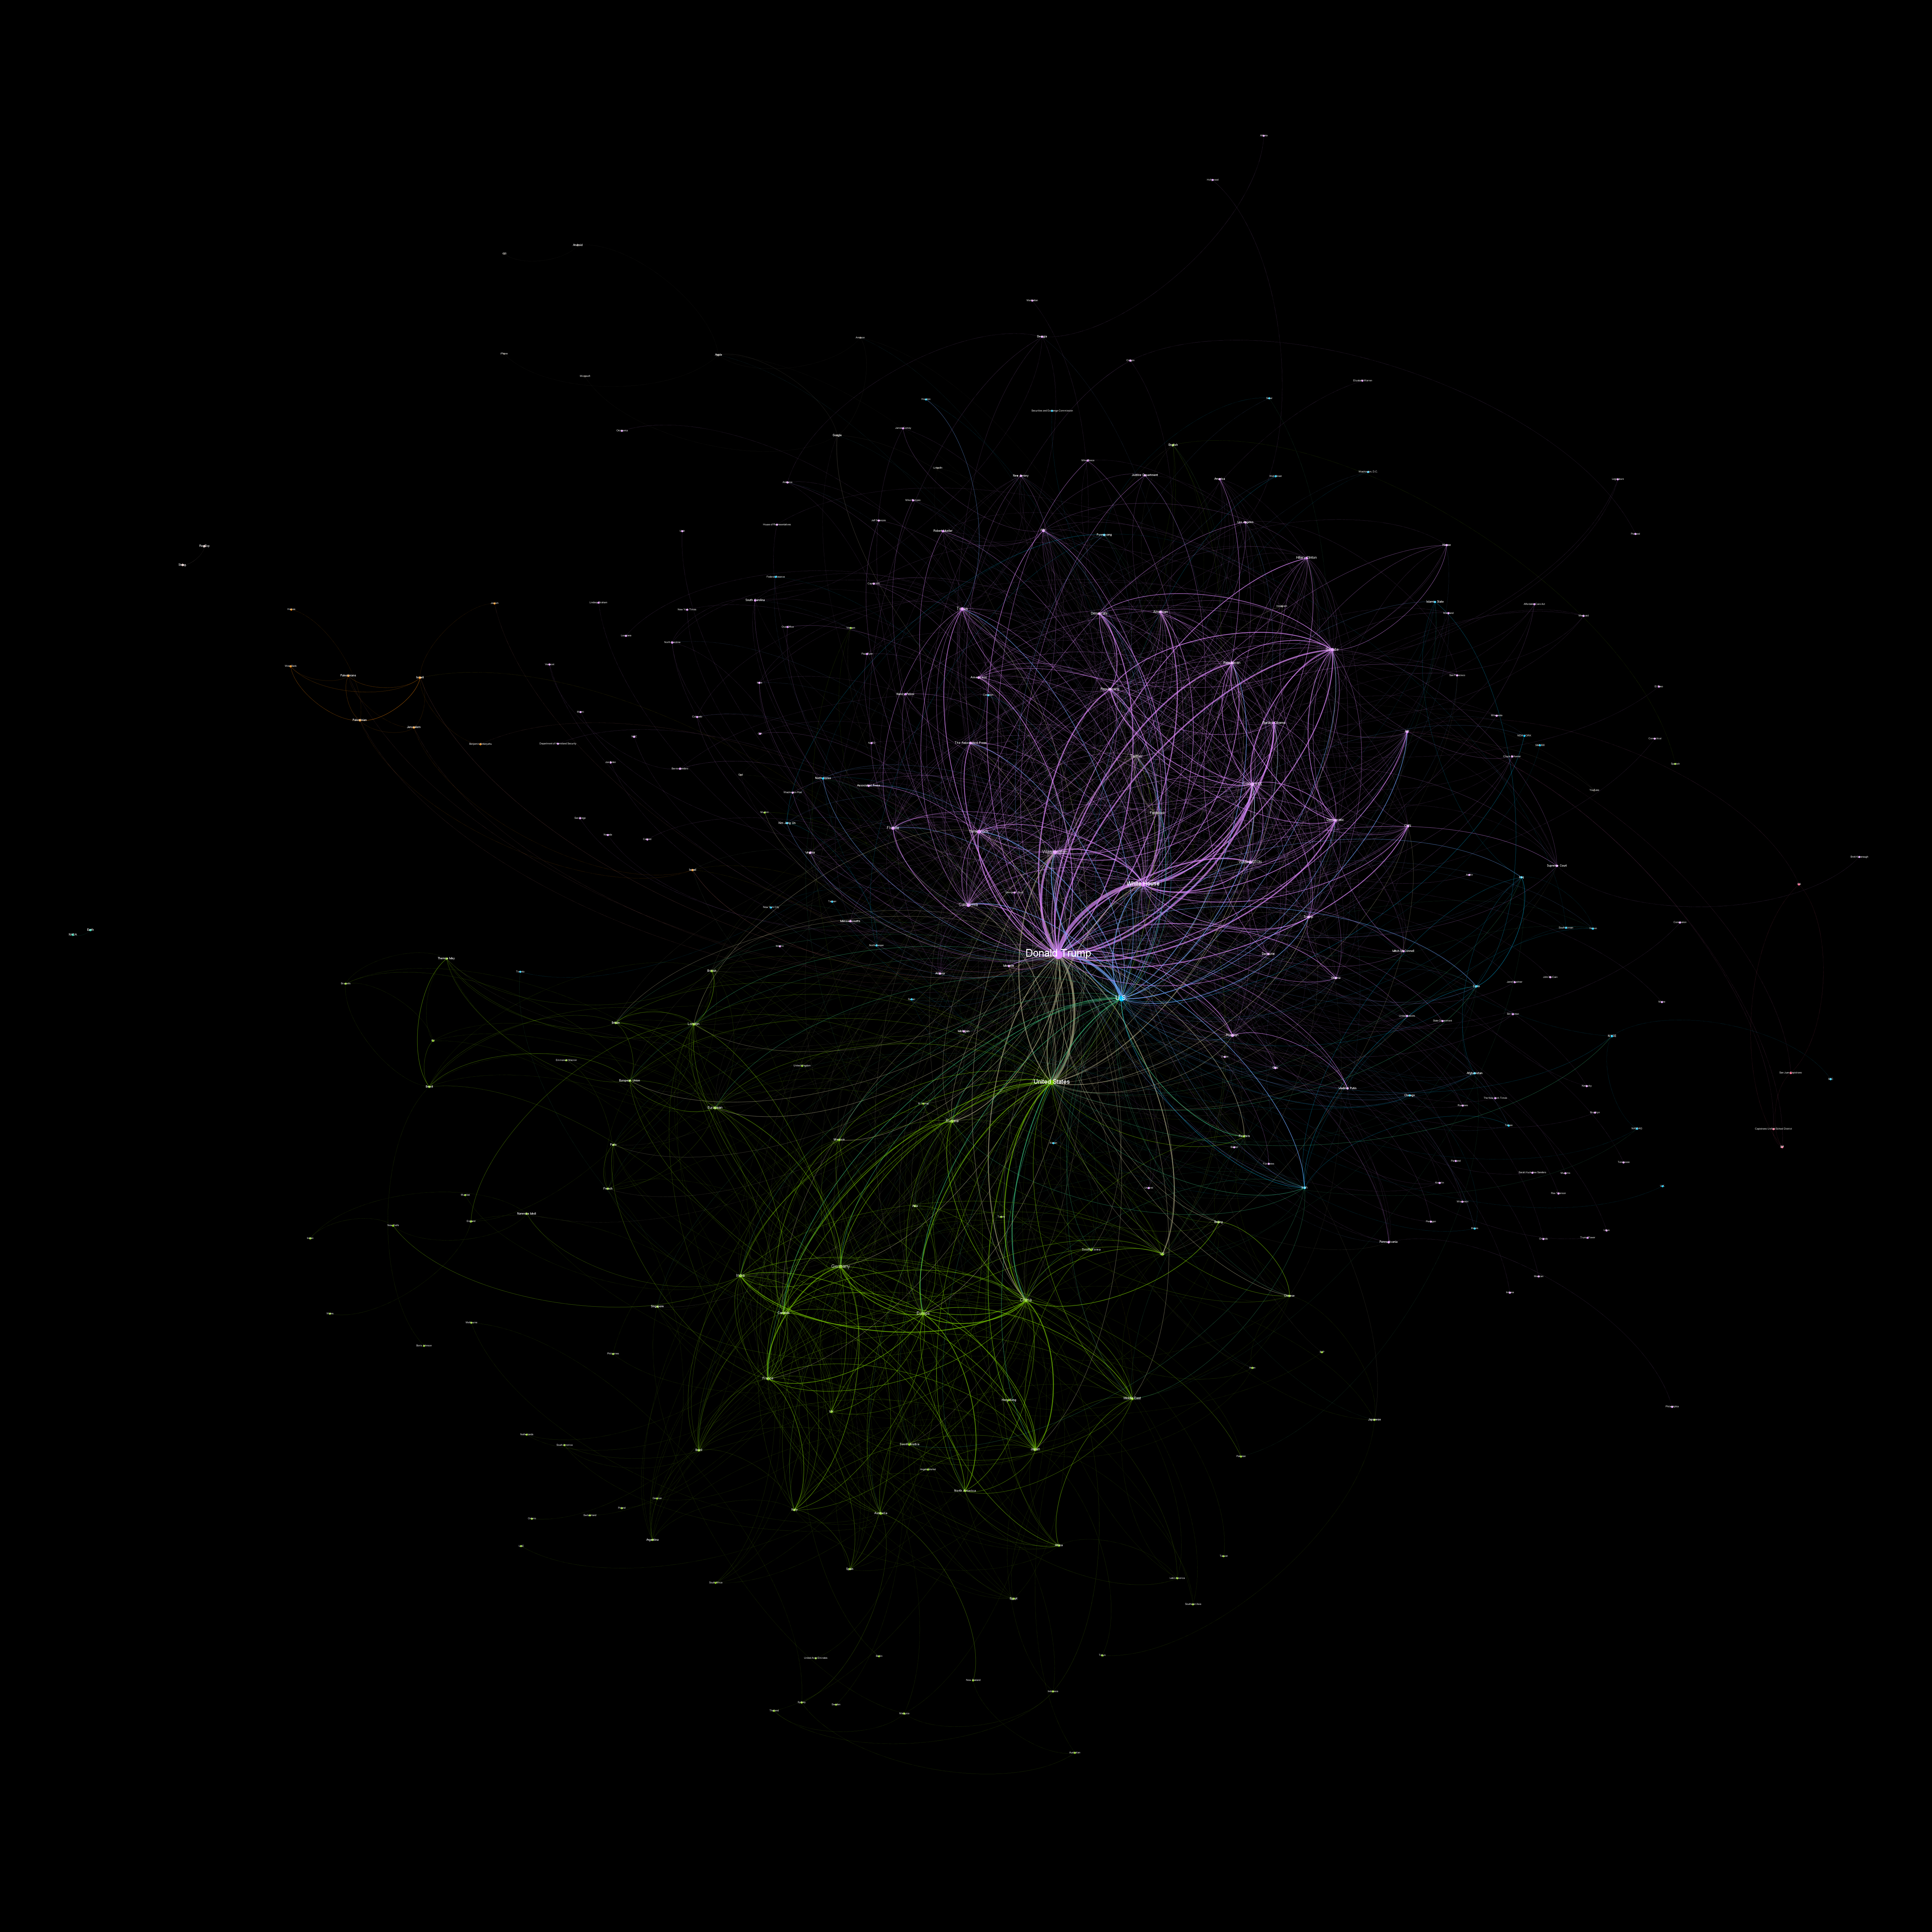
- Full Resolution PNG (6K x 6K) Graph Black Background.
- Full Resolution PDF Graph.
- Gephi File.
- CSV Edge File.
There is also an alternative edge file that contains the top 10,000 edges, available for download below. Note that this yields an overly dense graph with excessive connectivity that makes patterns difficult to discern:
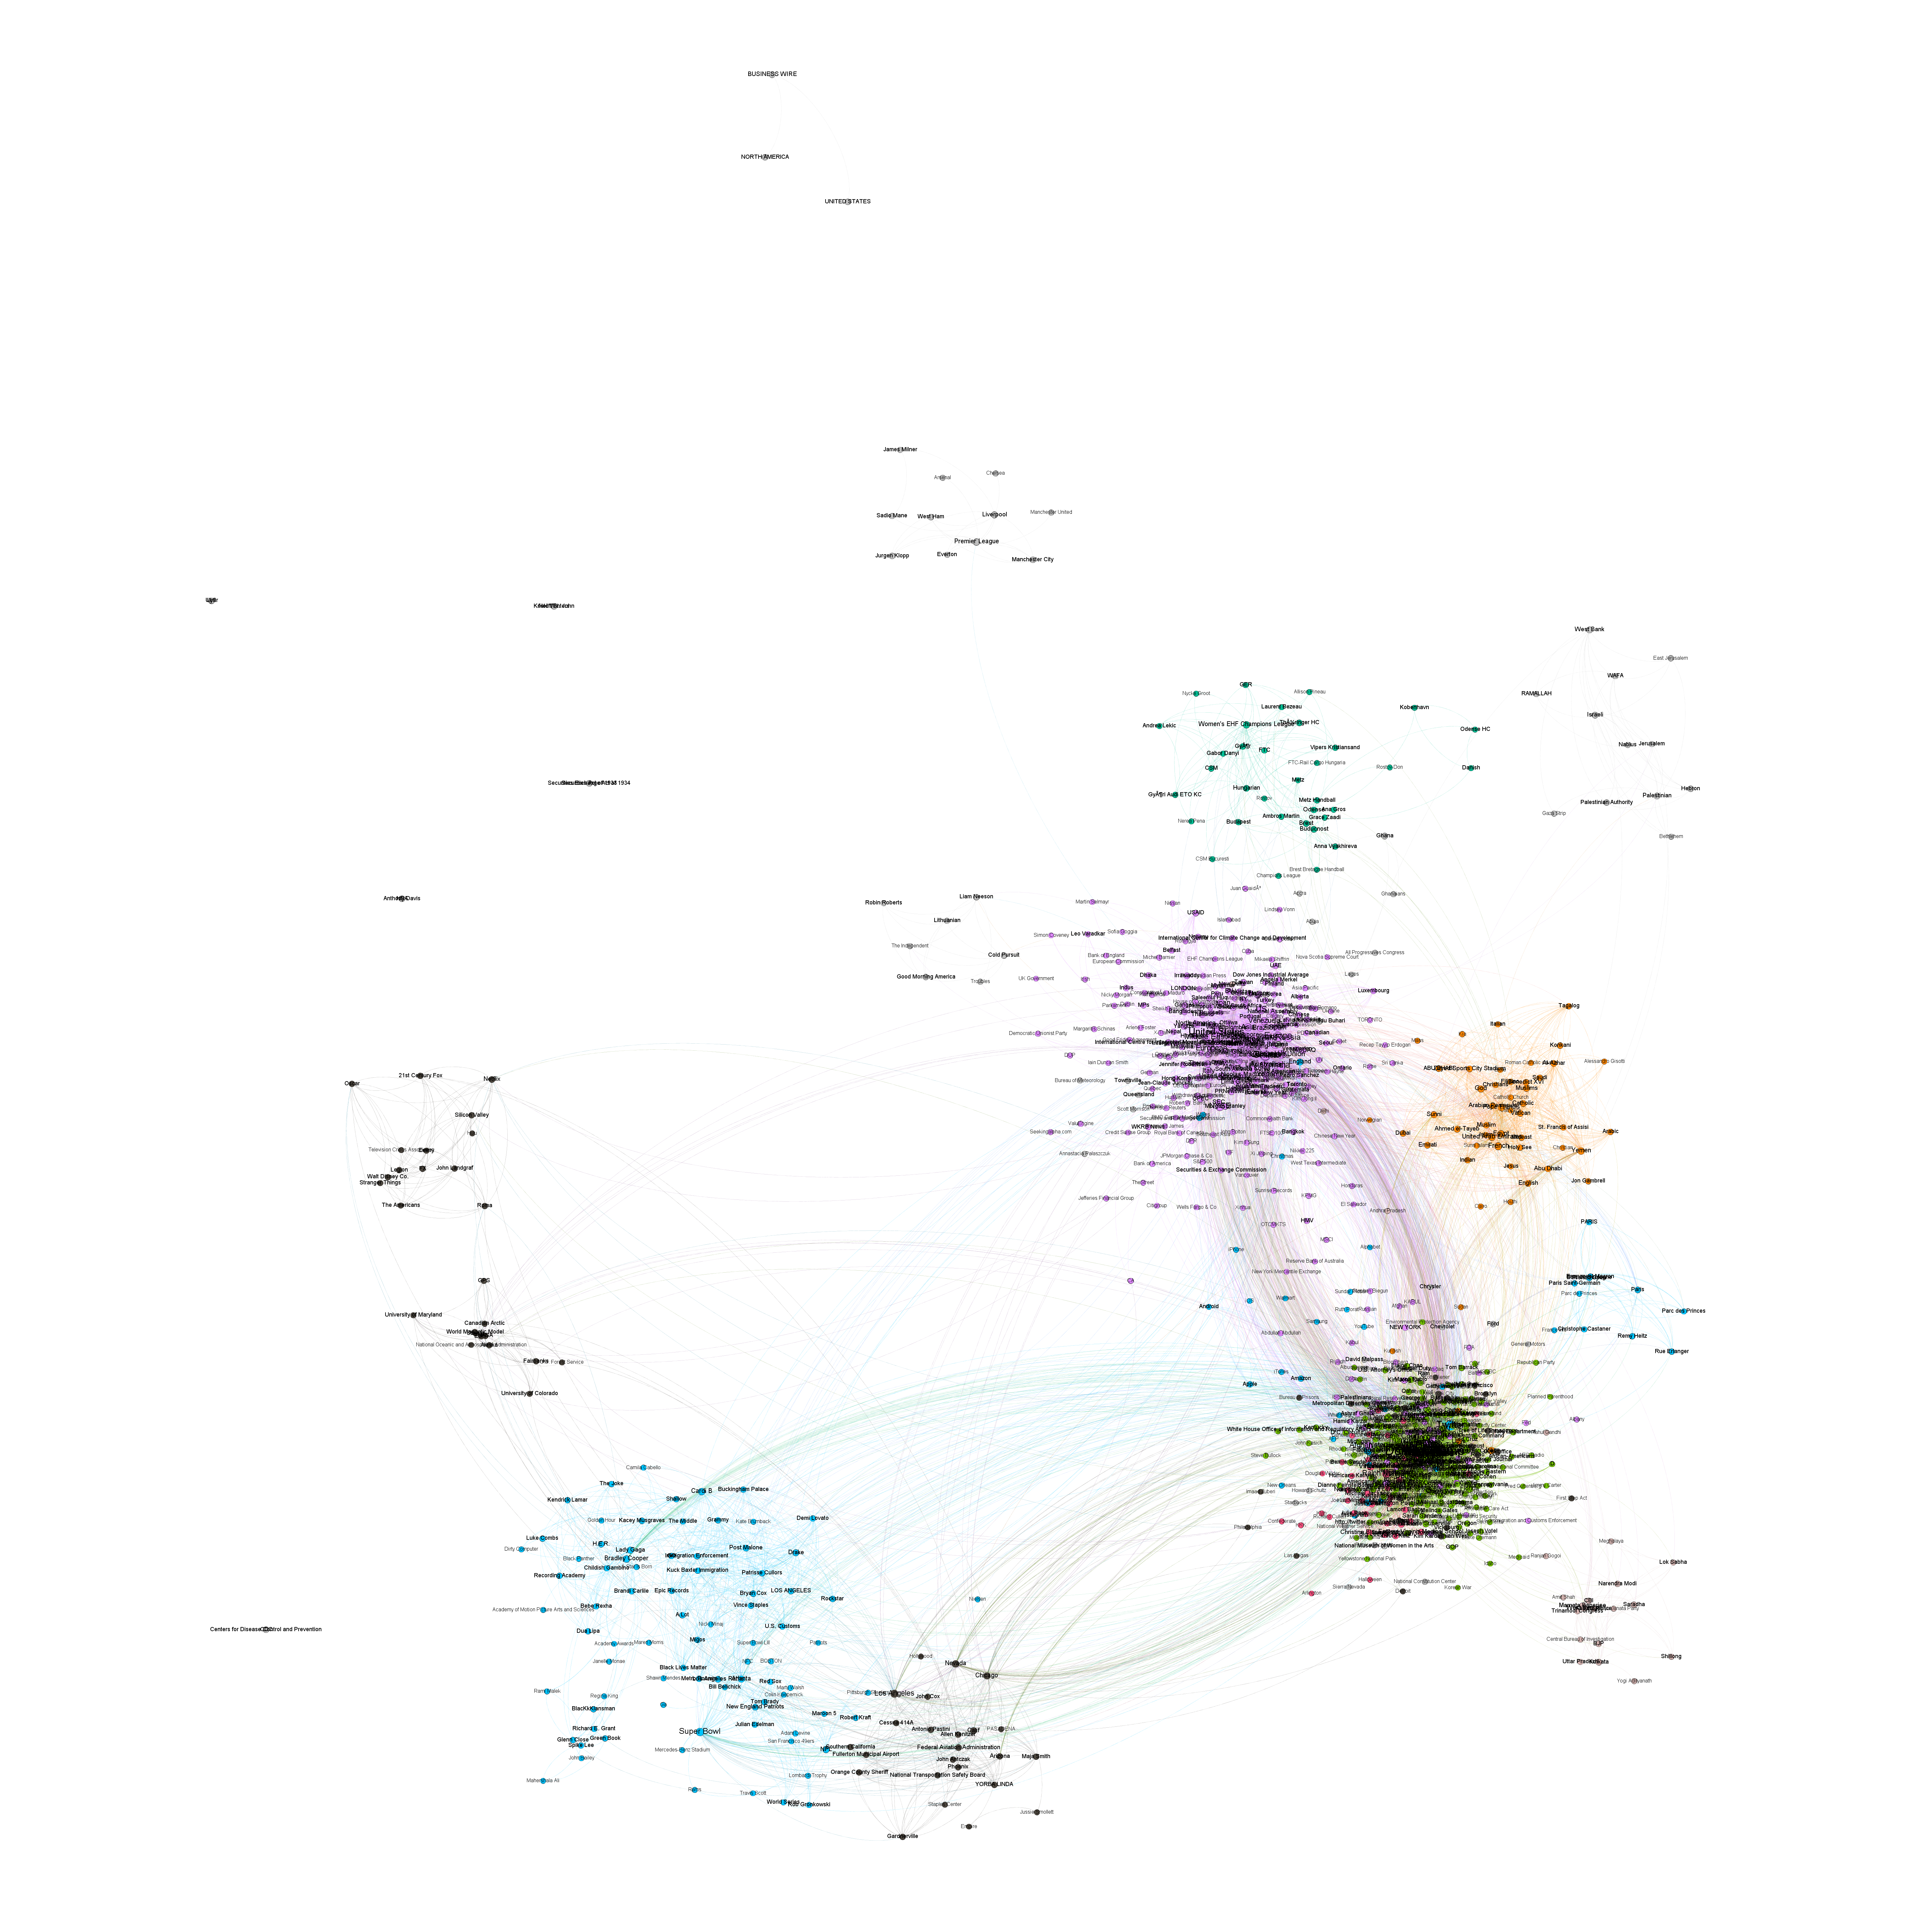
The graphs above consider all three years of data, meaning only the most consistent co-occurrences are surfaced. The zoomed preview image below shows the results of the same process applied to a single day's worth of data, which takes just 11 seconds to process.
The complete graph can be downloaded in several different formats below:
- Preview Zoomed PNG (3K x 2K) Graph White Background.
- Full Resolution PNG (6K x 6K) Graph White Background.
- Full Resolution PDF Graph.
- Gephi File.
- CSV Edge File.
Generating the graphs above was done with the following SQL query. With the date selector below this query takes just 11 seconds and consumes just 150MB of data and yields the single-day graph above. To generate the full-dataset graph, remove the date selectors but NOTE that this will consume several hundred GB of query quota.
SELECT Source, Target, Count RawCount, "Undirected" Type, ( Count/SUM(Count) OVER () ) Weight FROM (
SELECT a.entity Source, b.entity Target, COUNT(*) as Count
FROM (
 (SELECT url, entities.name entity FROM `gdelt-bq.gdeltv2.geg_gcnlapi`, unnest(entities) entities where entities.mid is not null and date >= "2019-02-05 00:00:00" AND date < "2019-02-06 00:00:00")
) a
JOIN (
 (SELECT url, entities.name entity FROM `gdelt-bq.gdeltv2.geg_gcnlapi`, unnest(entities) entities where entities.mid is not null and date >= "2019-02-05 00:00:00" AND date < "2019-02-06 00:00:00")
) b
ON a.url=b.url
WHERE a.entity<b.entity
GROUP BY 1,2
ORDER BY 3 DESC
LIMIT 1500
)
order by Count Desc