
Earlier this year we explored in depth Twitter's evolution from 2012 to 2018. Many of you have asked how Twitter has continued to evolve in the year since that study's data, which ended in October 2018. Today we're excited to release updated versions of all of the key figures, running January 2012 through September 2019, showing how Twitter has progressed in the year since.
Executive Summary
From Nov 2018 to March 2019, the total daily Twitter volume increased around 20 million tweets a day, reversing its 5-year decline.
Roughly 10% of all tweets each day are still either by verified users or retweets of verified tweets. Retweet volume has remained steady at 50% of total Twitter volume since Jan. 2018. Replies have been trending up since July 2017, hitting around 25% of total volume, though decreasing sharply over the last few months. Tweets mentioning other users have reached 75%. Tweets containing a URL of any kind have remained stable at 40% since July 2018. Average tweet size in characters has decreased slightly, with both chars and bytes (for multibyte characters) decreasing since June 2018. English continues to decline as a percentage of the Twitterverse. Average account age from registration continues to grow, though median age has leveled off as of July 2018.
For those mapping Twitter, the percentage of tweets with GPS coordinates (rather than city/landmark-centroid coordinates) continues to plunge – as of September less than 0.08% of tweets were GPS-tagged, compared with around 1.2% of tweets having a Place centroid (down from 3.5% combined seven years ago).
For those text mining Twitter, the total size of non-RT textual content (excluding user references and hyperlinks) has continued to decline, reaching around 11GB of text posted to Twitter each day in September 2019 – slightly less than was posted daily seven years ago in January 2012.
Tweets Per Day
The total number of daily tweets has remained largely identical through 2019, though intriguingly from November 2018 through March 2019 the total number of daily tweets increased from around 320 million a day to around 340 million a day.
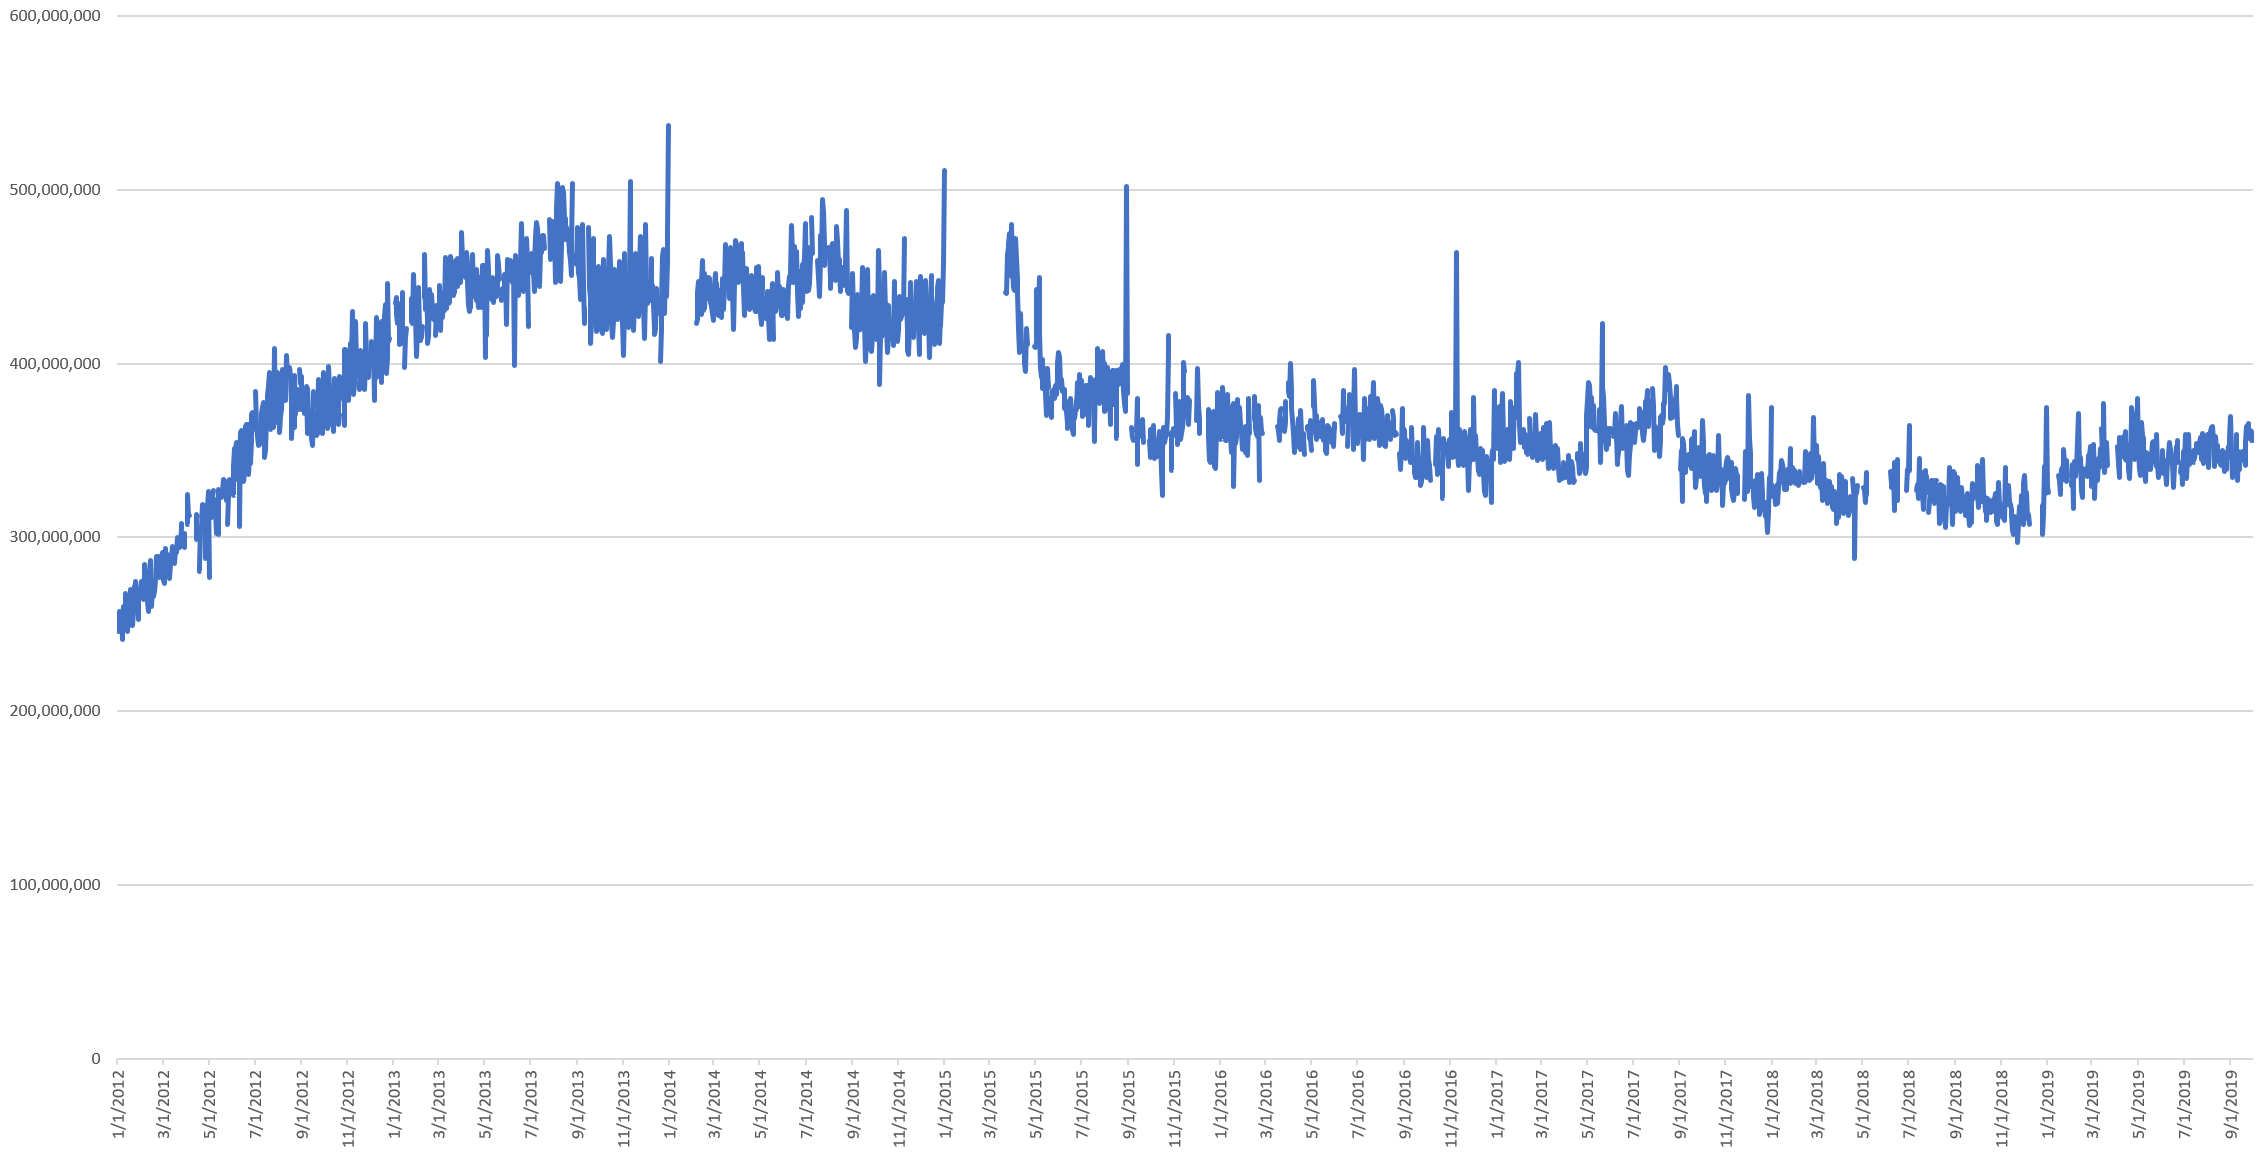
The November 2018 to March 2019 increase is particularly interesting in that in the midst of this sharp surge in new tweets, in February, Twitter announced a new way of calculating active users, suggesting once again that metric redefinitions are often closely linked to underlying changes in the data streams invisible to most users.
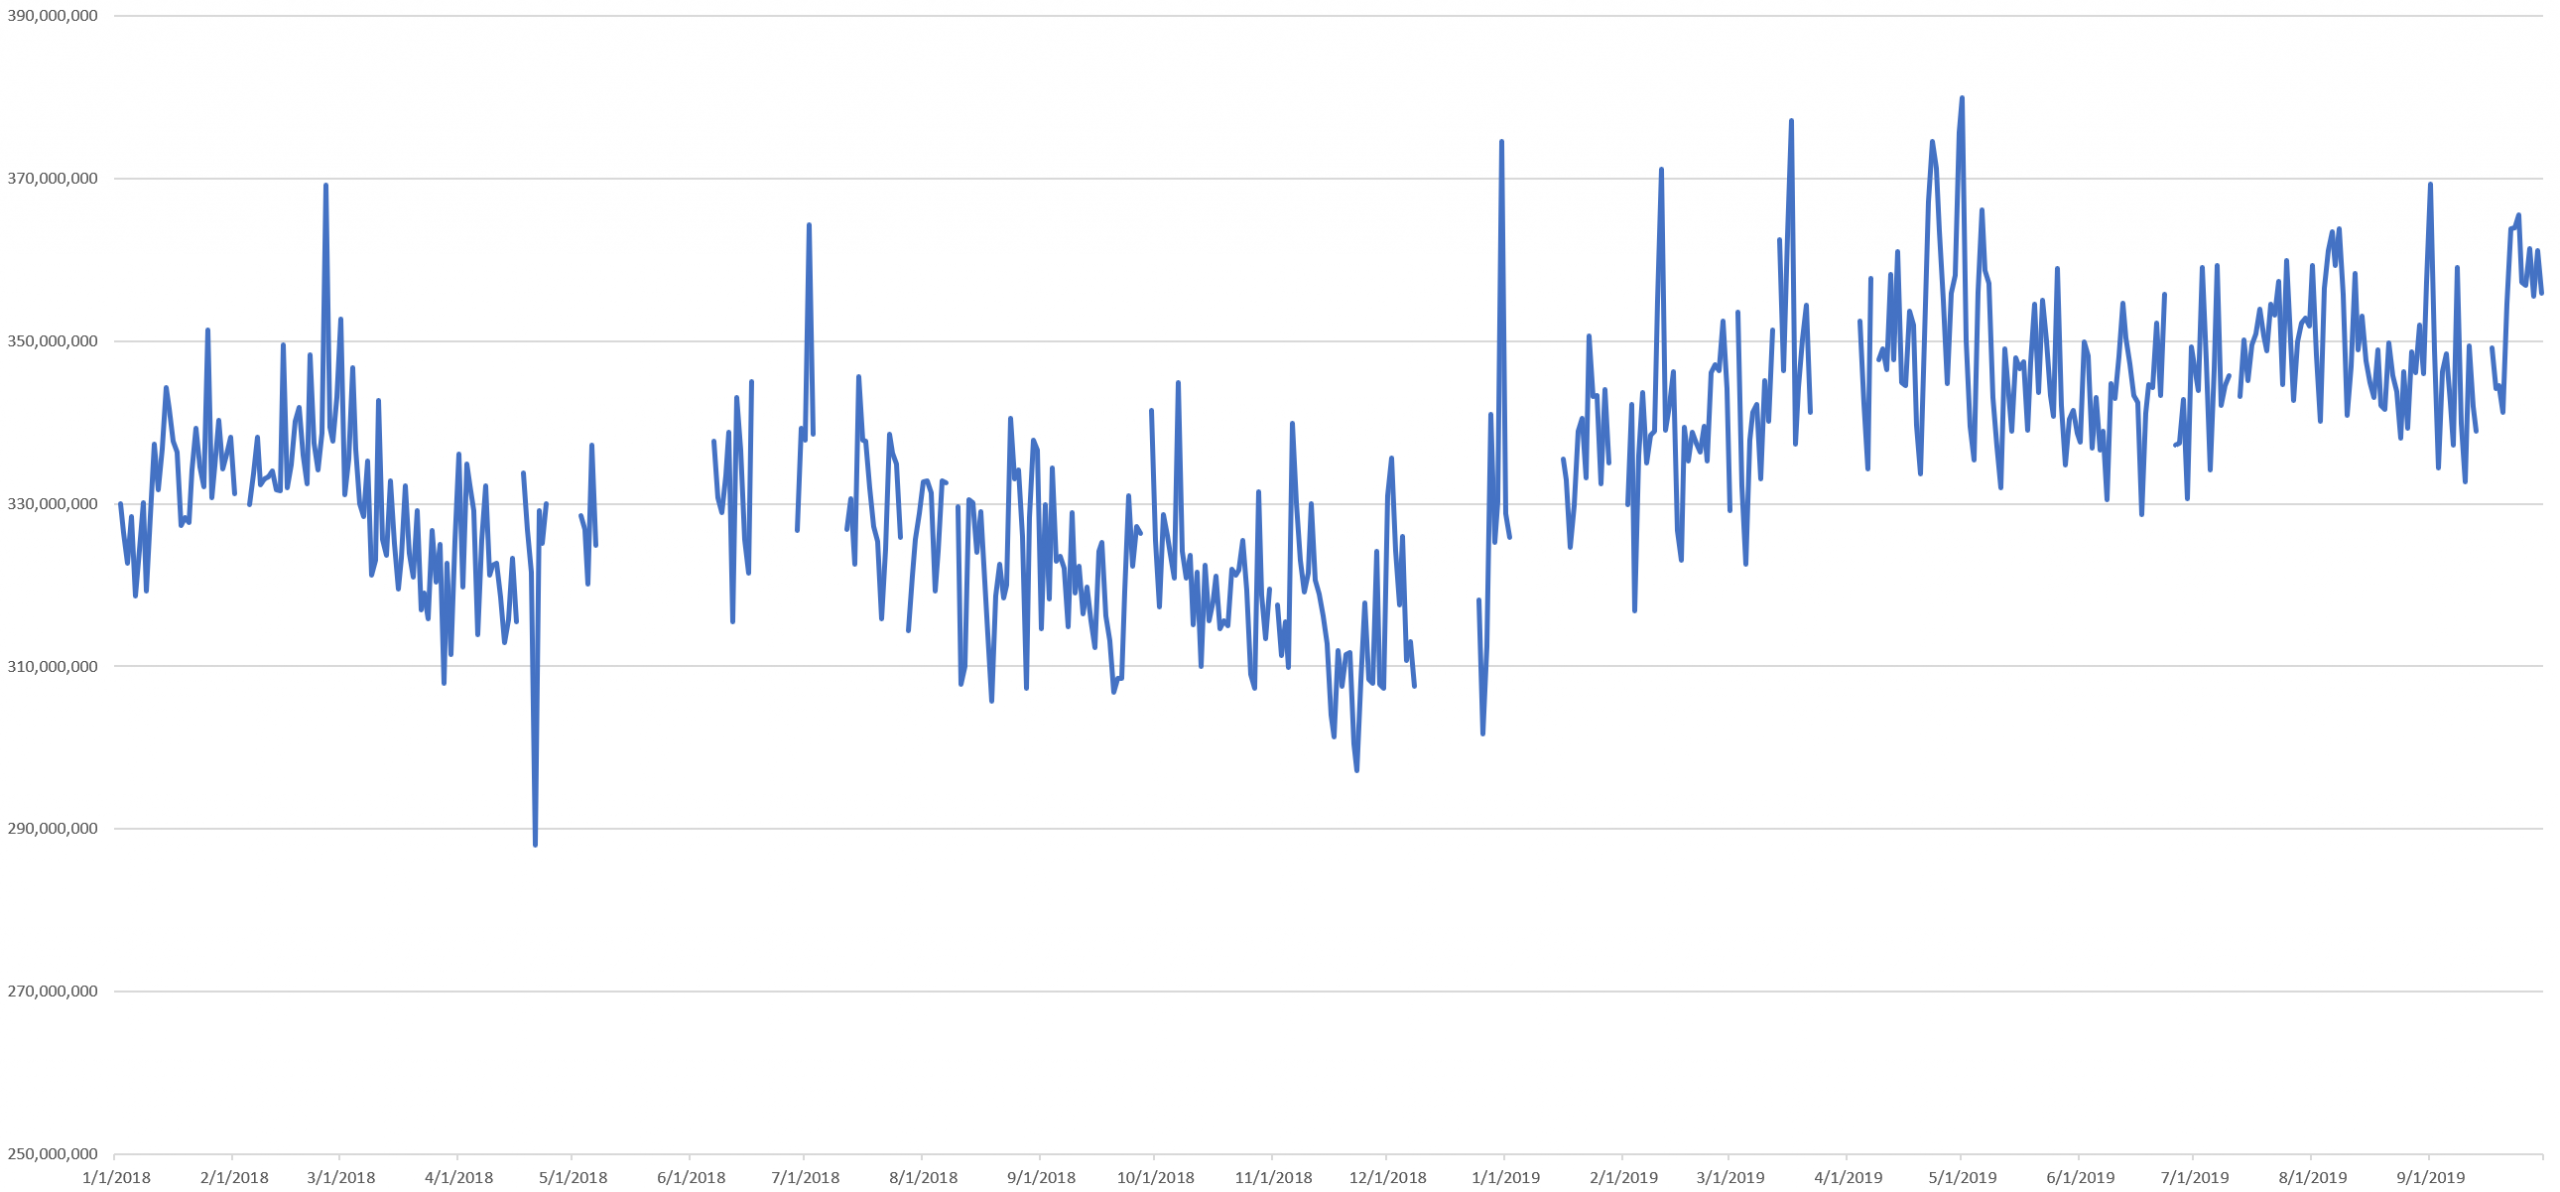
The graph below zooms into the Jan. 2018 to Sept. 2019 period, showing how the steady decrease in daily tweet volume that began in July 2013 reached its end on November 16, 2018. Beginning the following day through December 1st it increased then leveled off around 320 million tweets a day through December 27th. On December 28th it jumped vertically and then climbed slowly over the next three months till around March 20, 2019 at which point it leveled off around 340 million tweets a day – a point at which it has remained steady ever since.
Tweeting Users
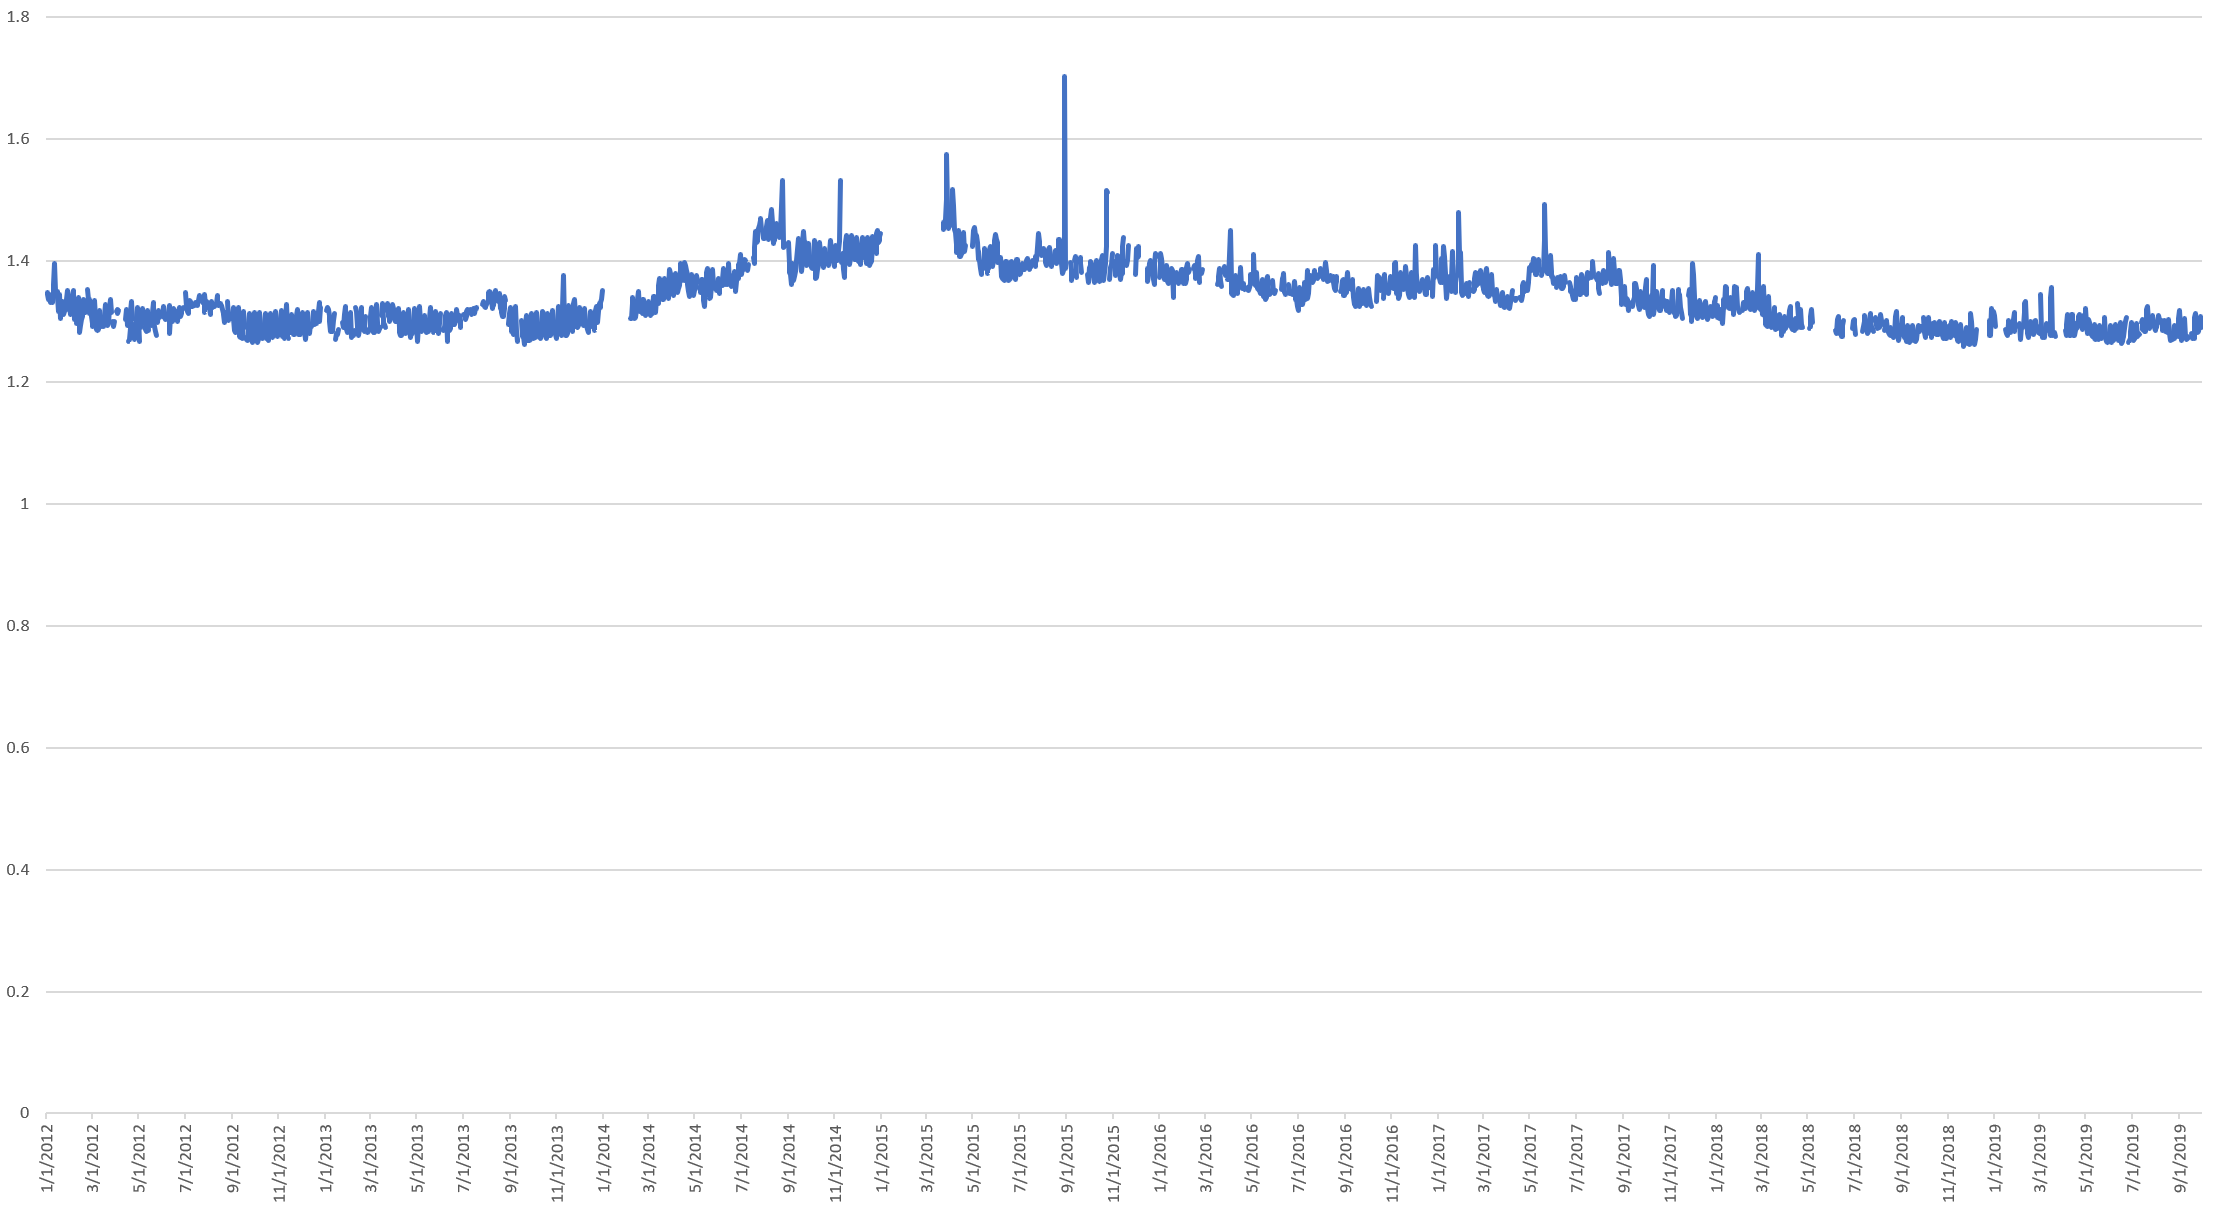
Looking to the users sending all of those tweets, the graph below shows the average number of tweets per user over the time period, calculated by dividing the total number of tweets each day by the total number of distinct usernames sending one or more tweets that day.
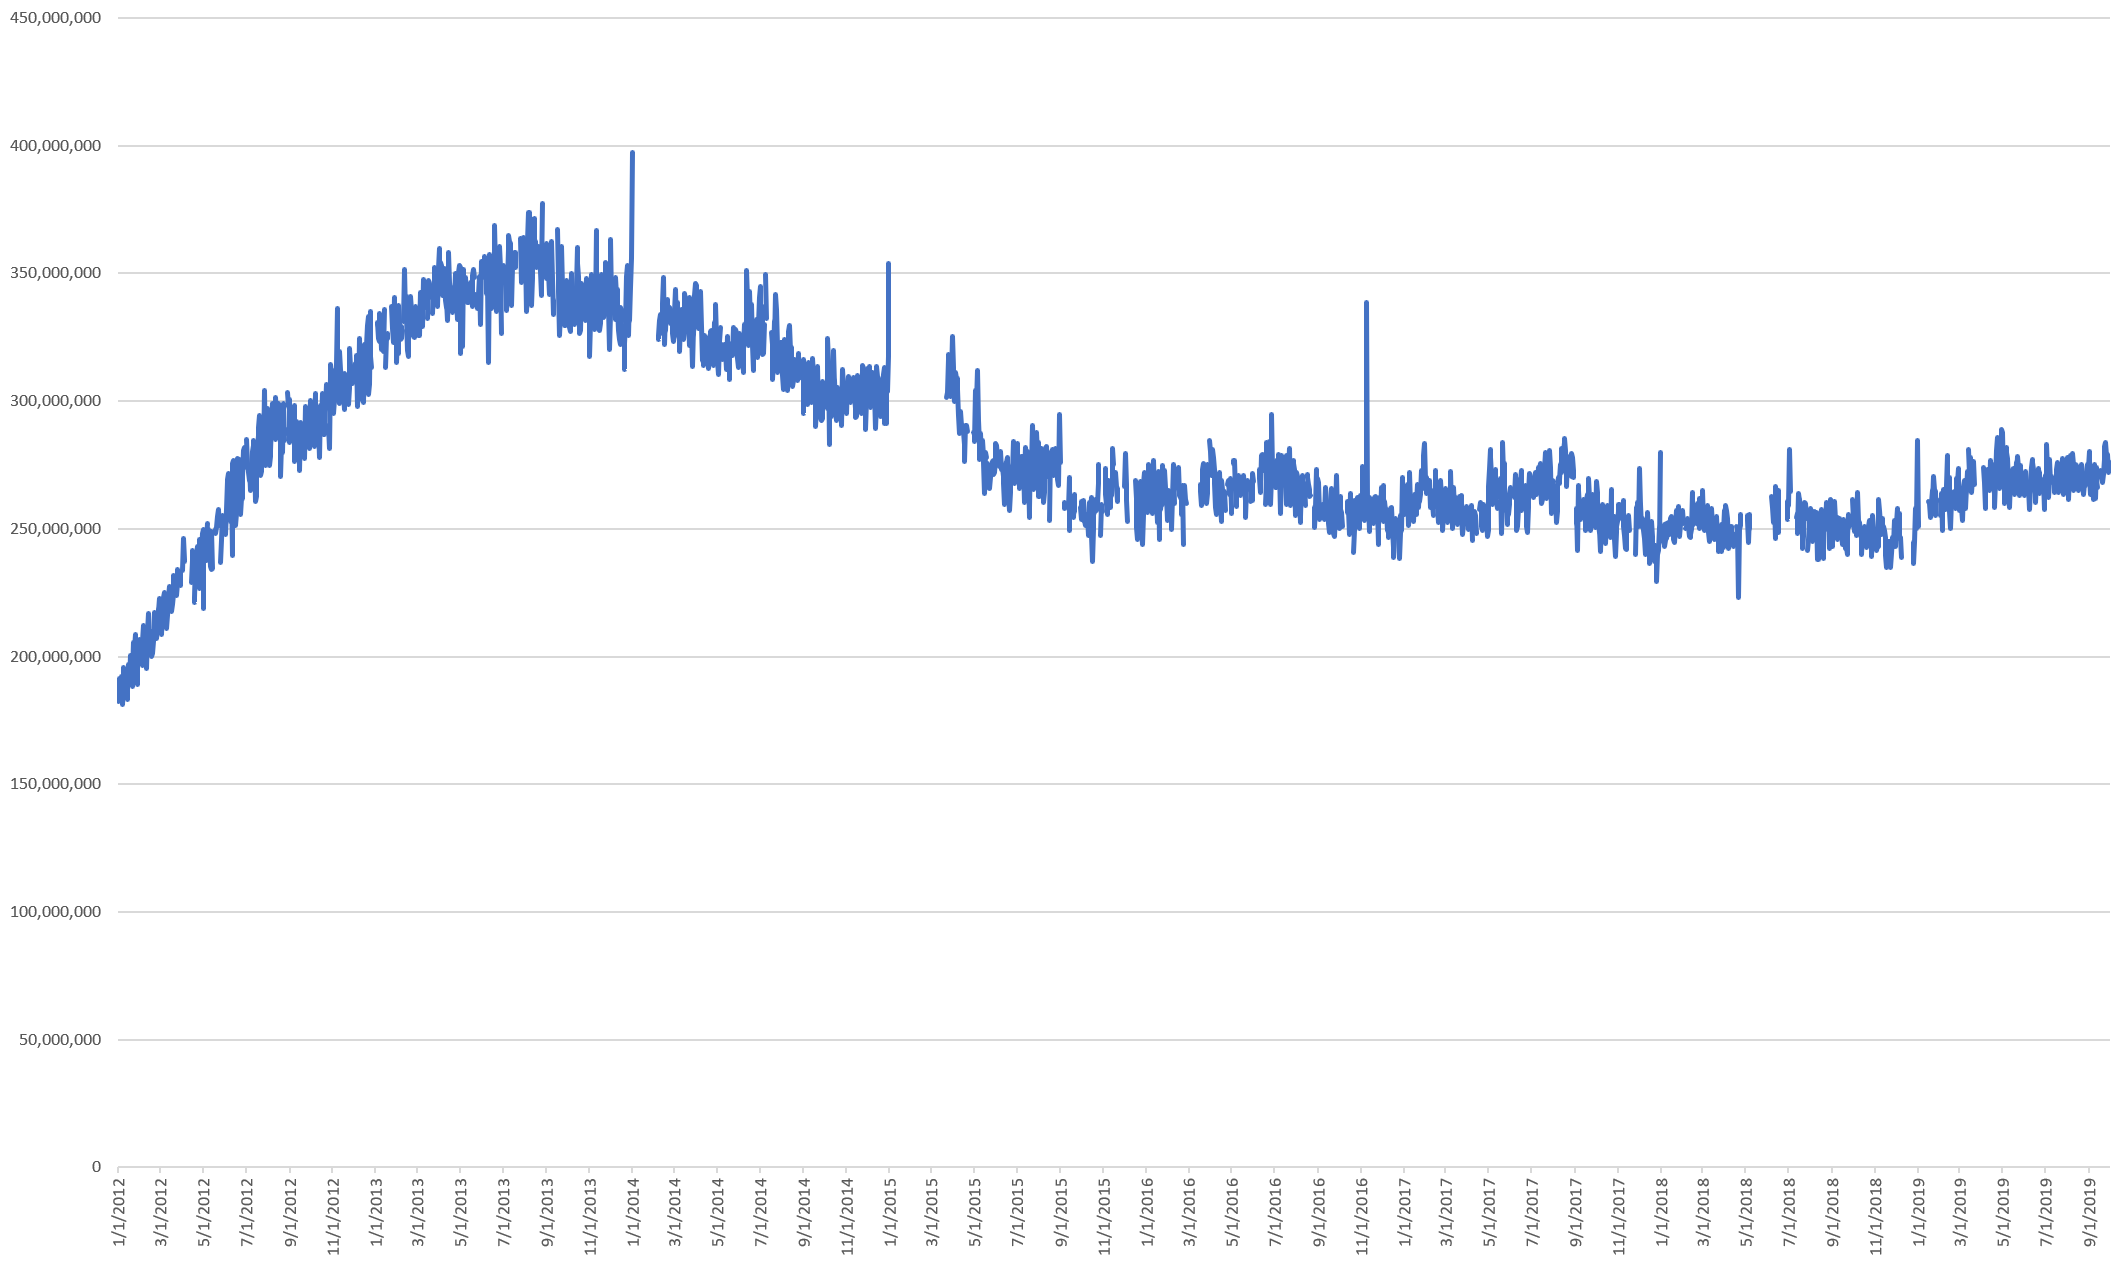
The graph below shows the total number of distinct users sending one or more tweets per day. Unlike other metrics commonly used to assess social platforms, the community of tweeting users is the most important, in that the content produced by these users is what draws the rest of users in.
Verified Users
What percent of all tweets and users sending those tweets are verified users?
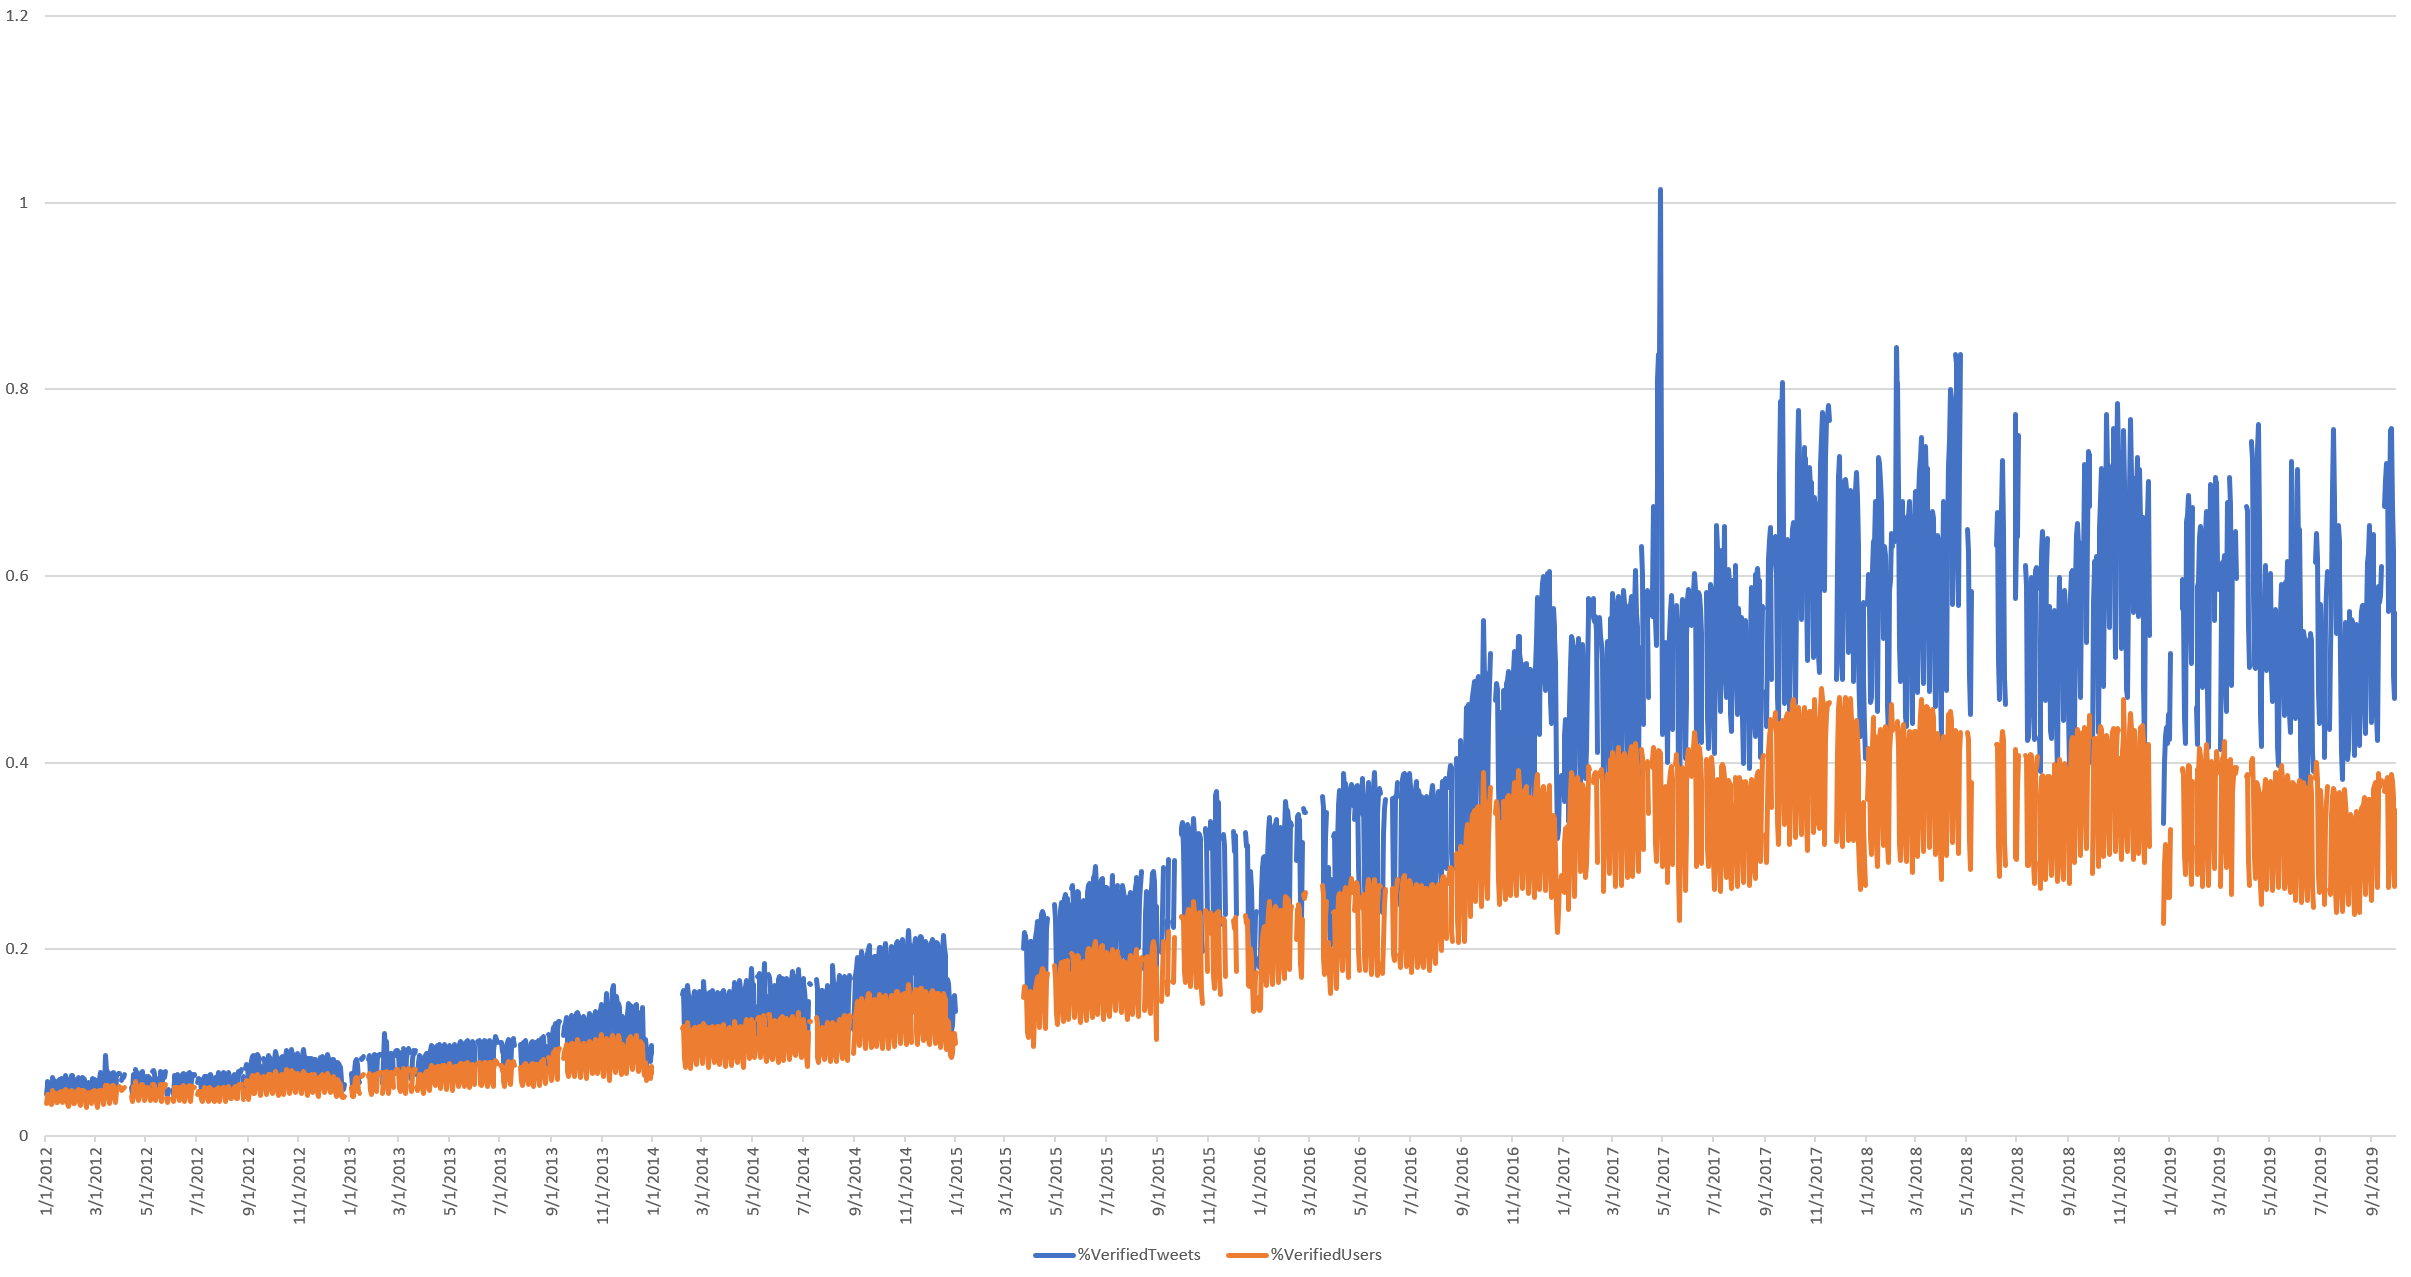
Of course, Twitter largely paused its verified users program in November 2017, which can be clearly seen above. More to the point, given their exceptional rarity on Twitter, it would not be expected that they would account for an outsized percentage of total tweet volume. Instead, a better metric to assess their influence over the Twittersphere would be to measure the combined volume of original tweets sent by verified users and all retweets of those tweets.
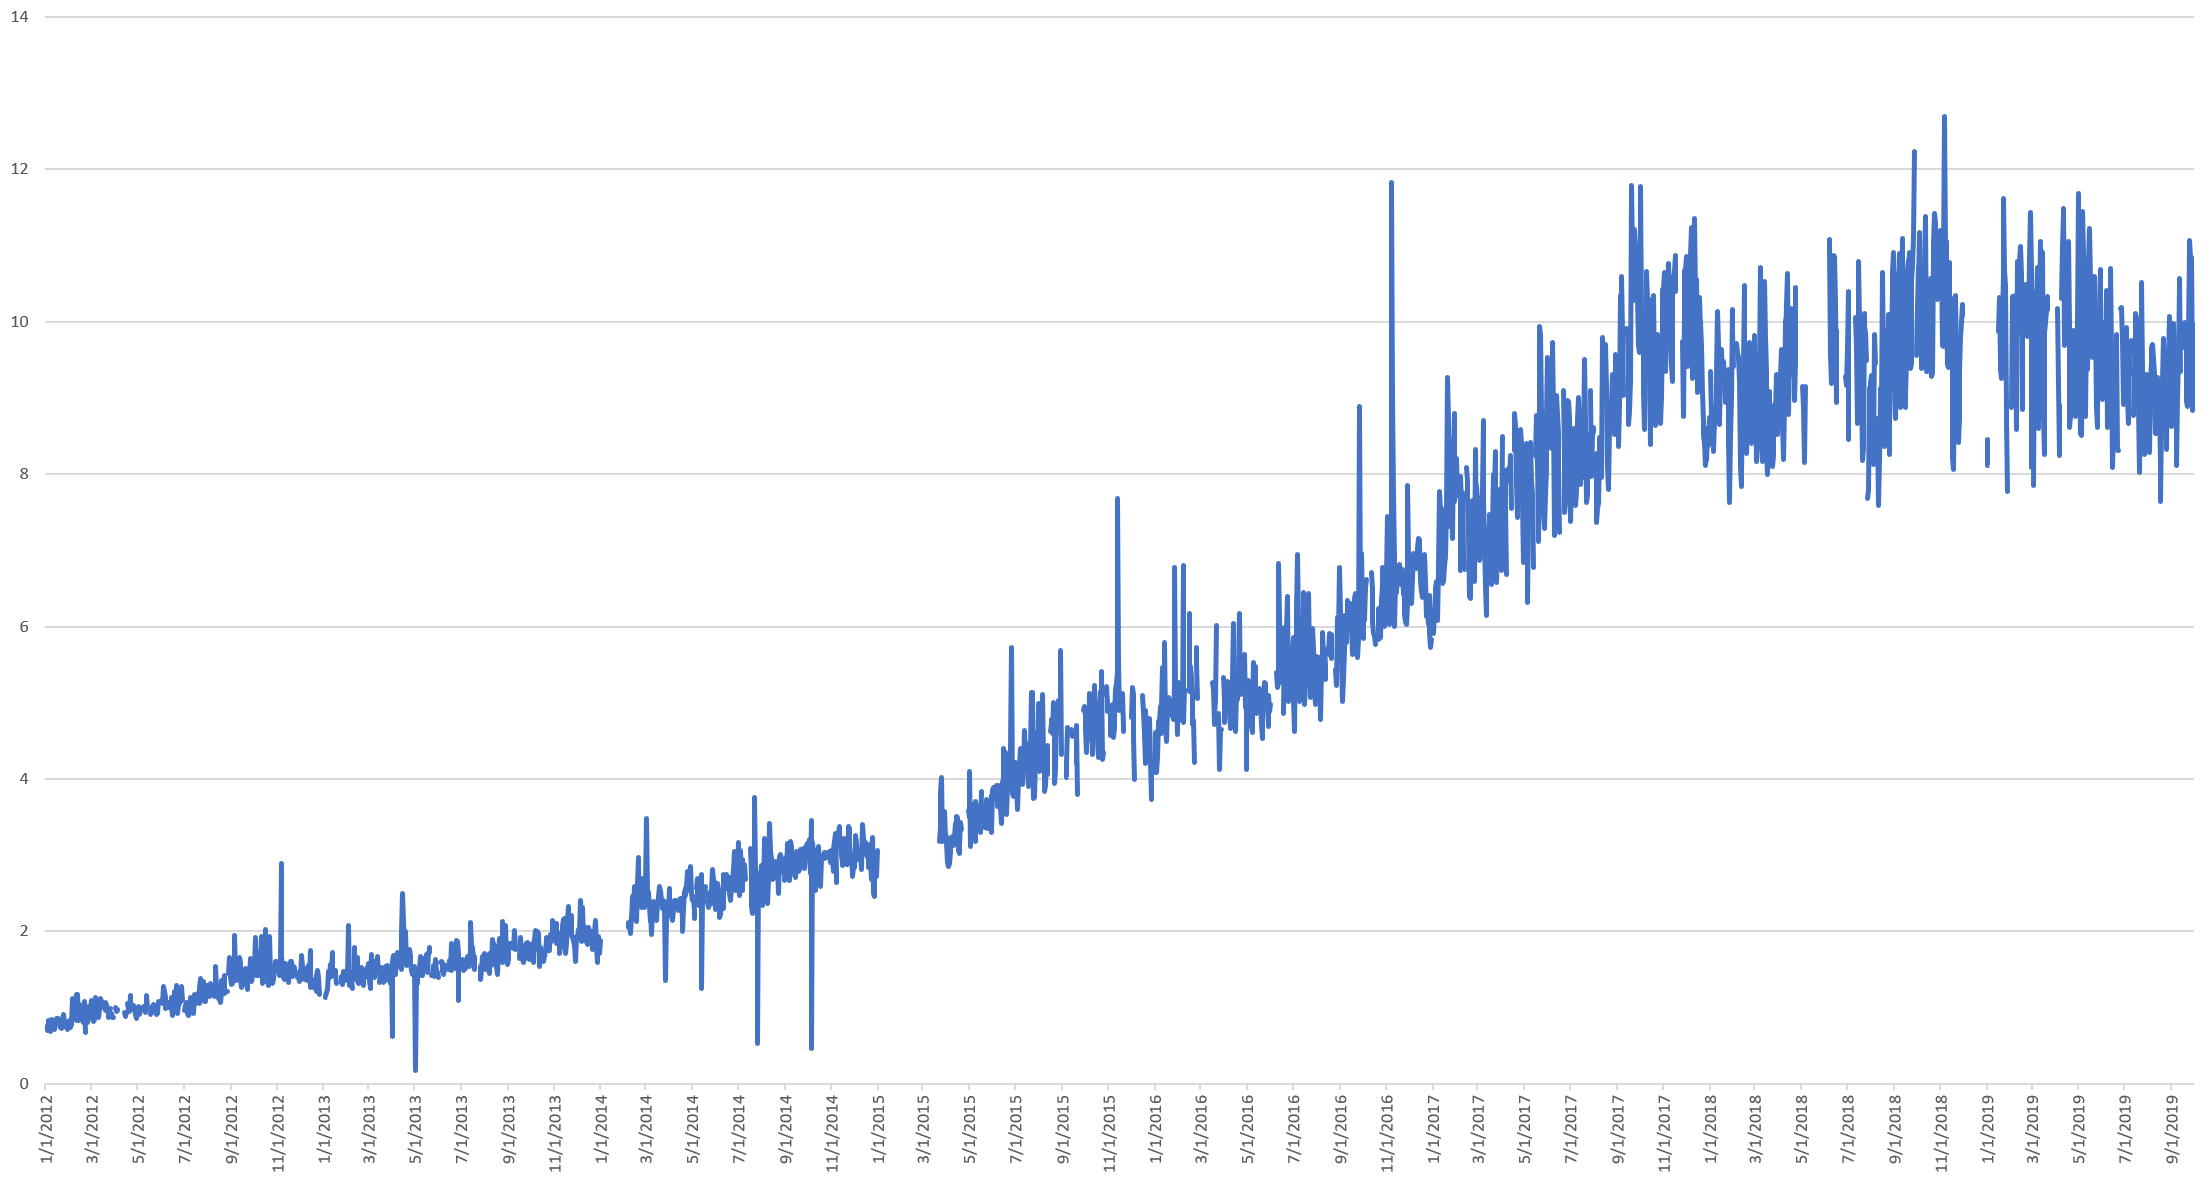
This yields the timeline below, showing that a steady 10% of total Twitter volume, or roughly 32 million tweets a day, are either produced by a verified user or are an ordinary user's retweet of a verified user's tweet.
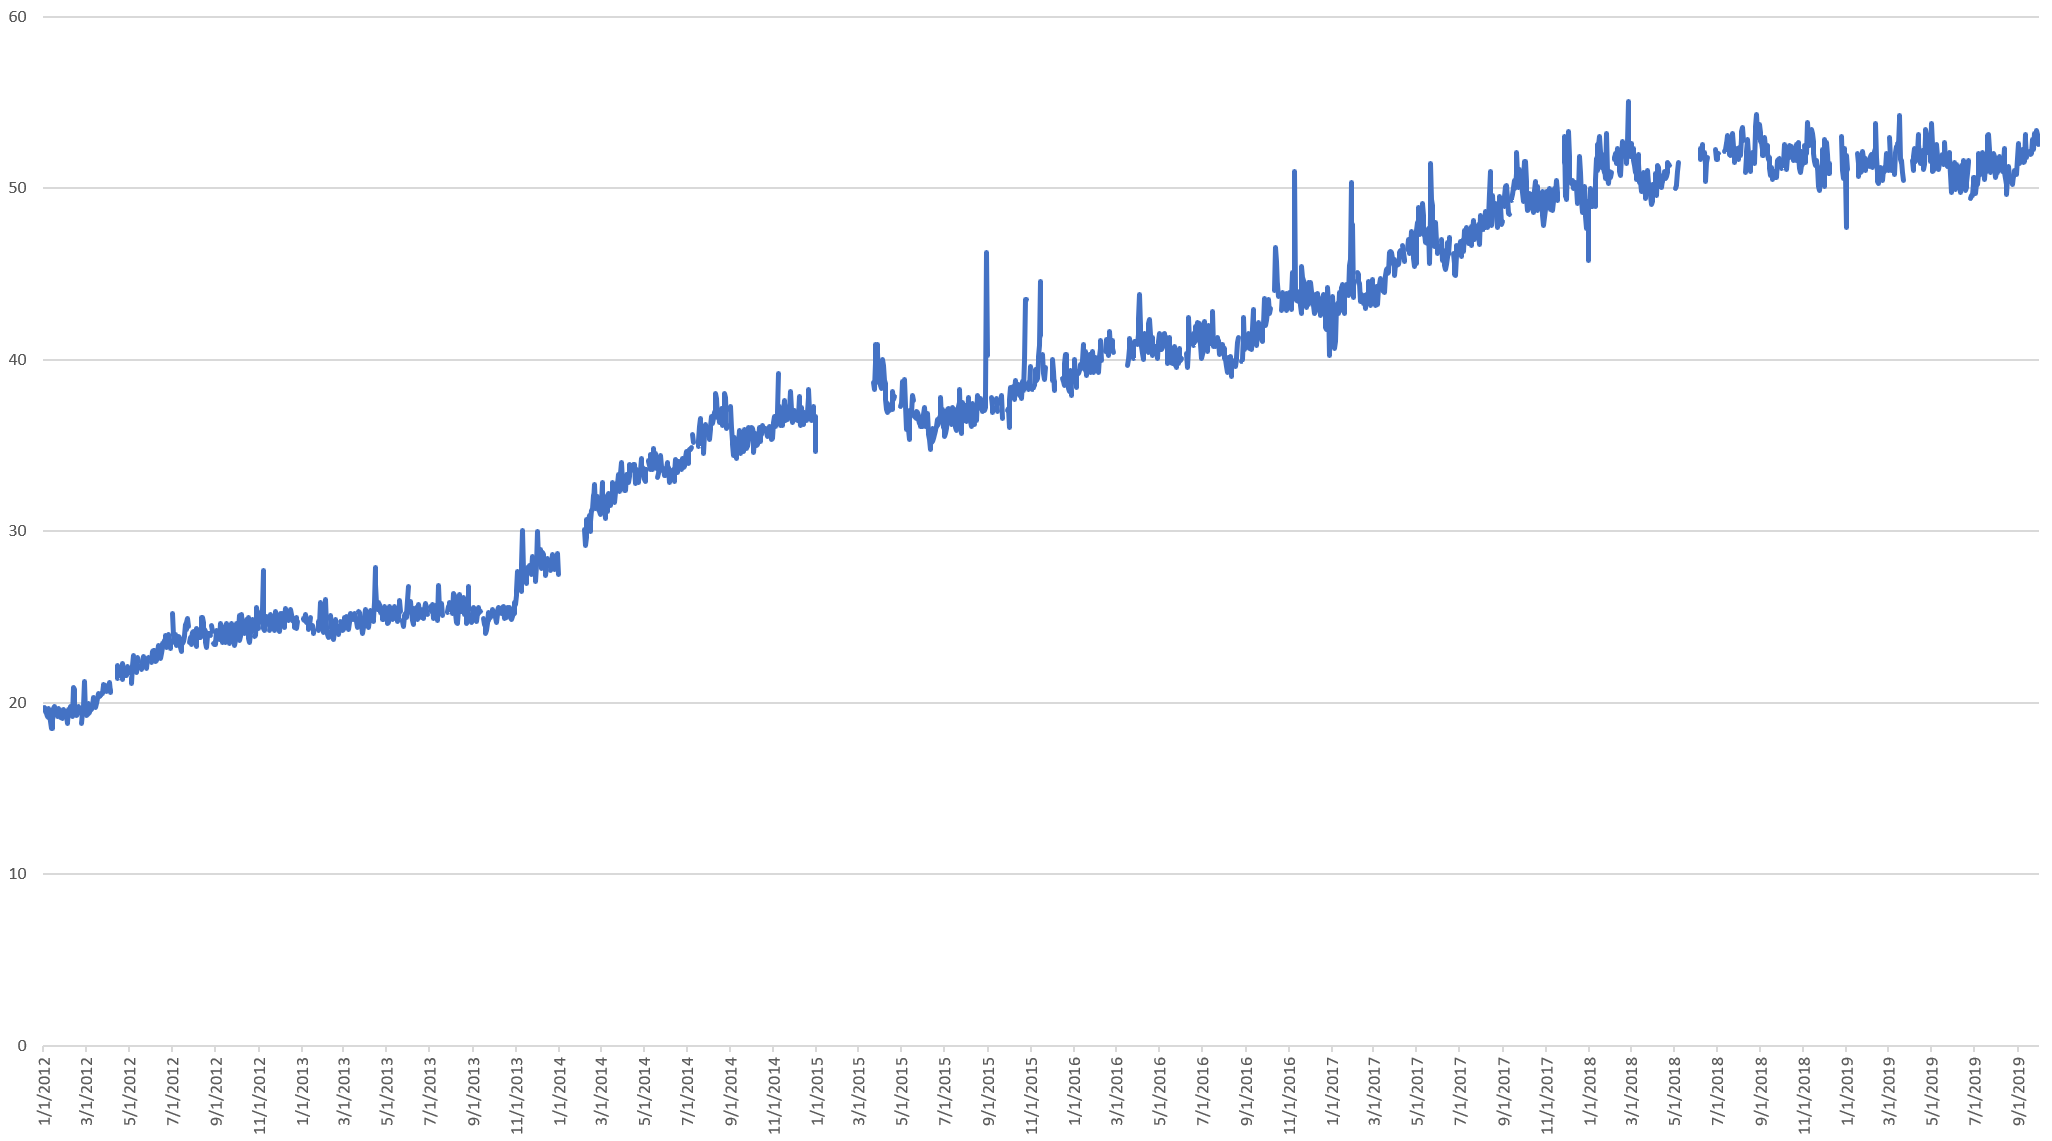
Retweets
What percentage of the total daily tweet volume are retweets? It turns out more than half of all tweets are retweets, though interestingly this has leveled off as of March of this year.
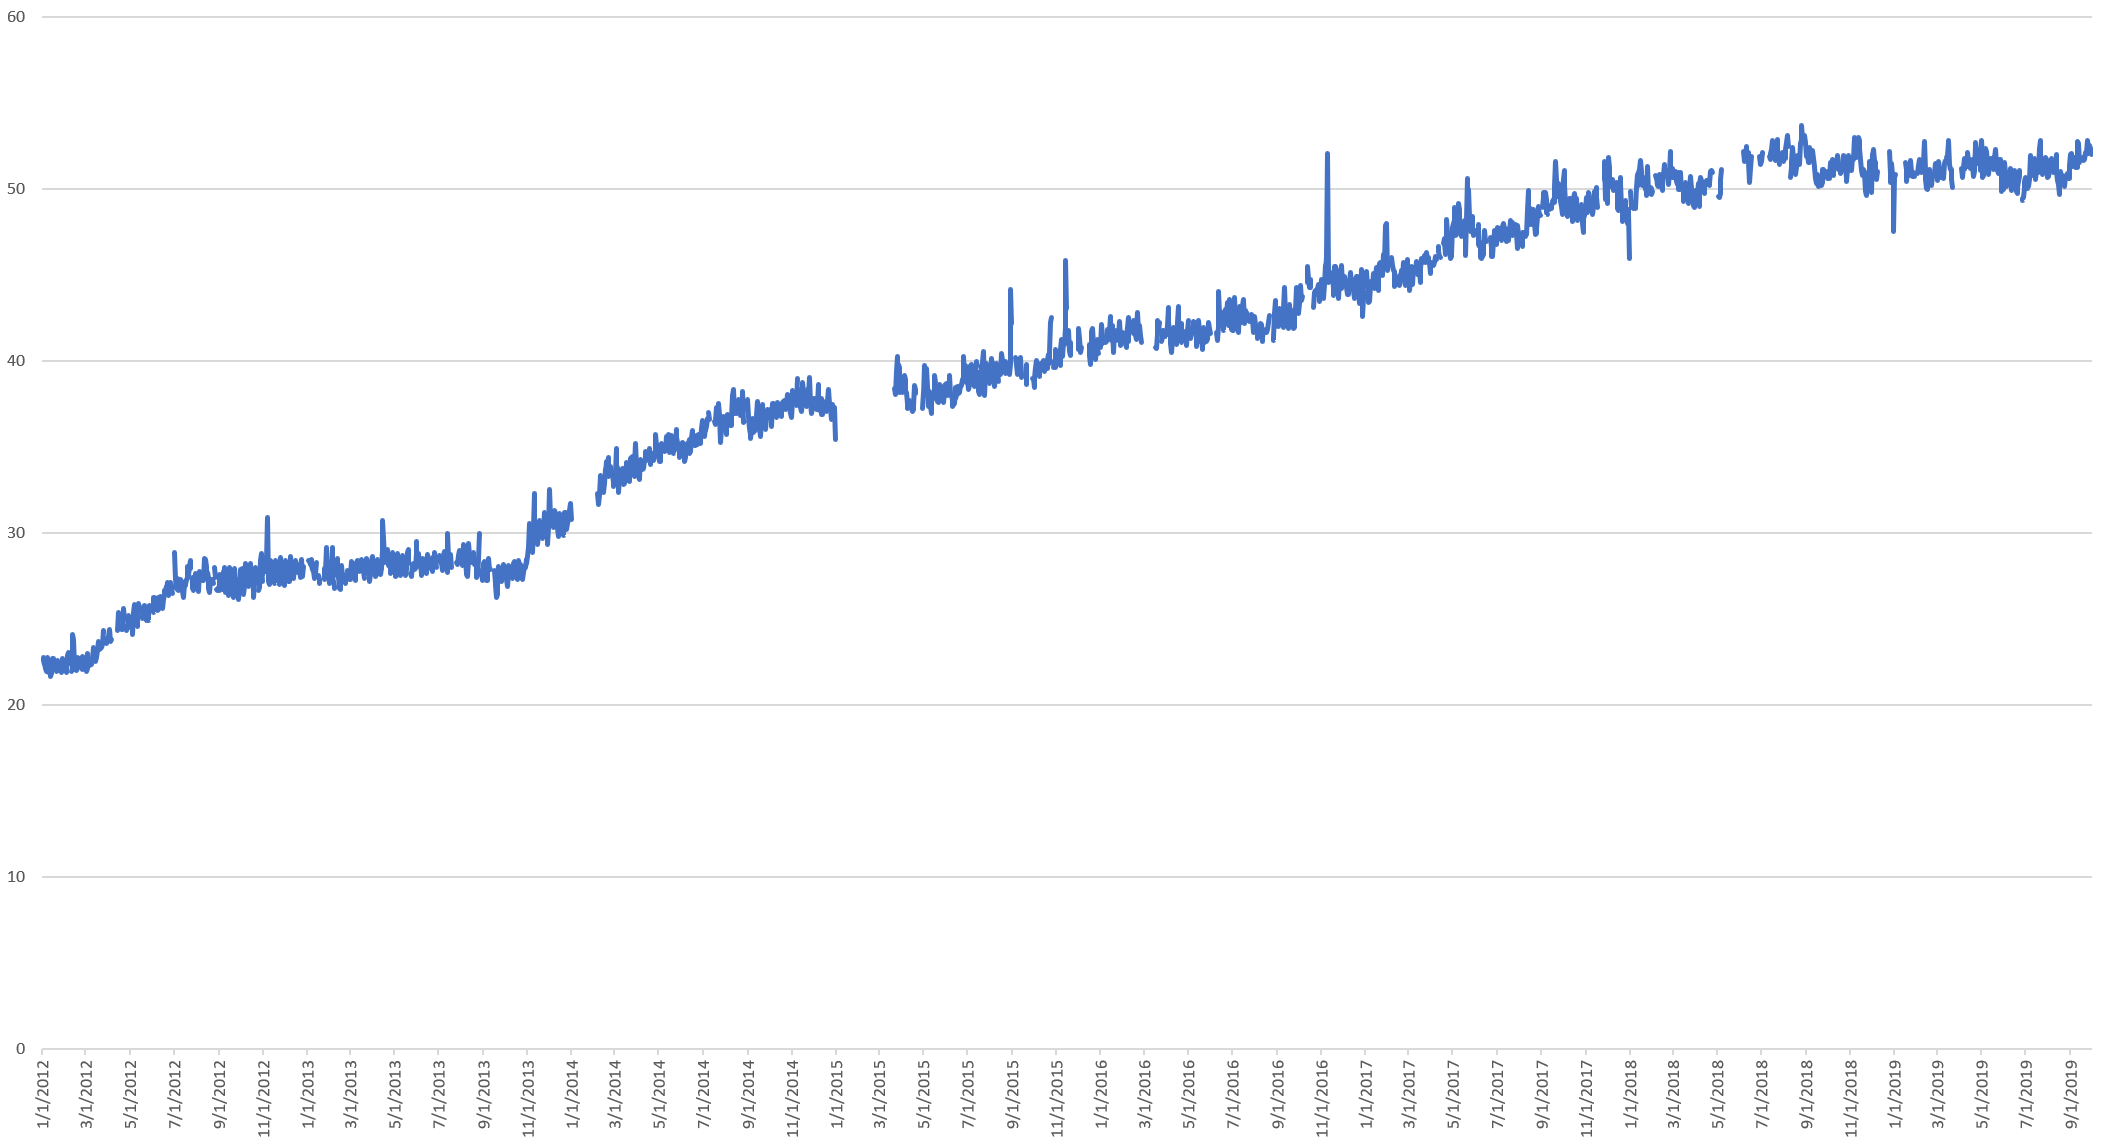
In terms of the percentage of unique users posting retweets, the timeline below is largely identical to the one above, suggesting that retweet behavior is evenly distributed across the platform's total user base rather than being centralized in a small number of users.
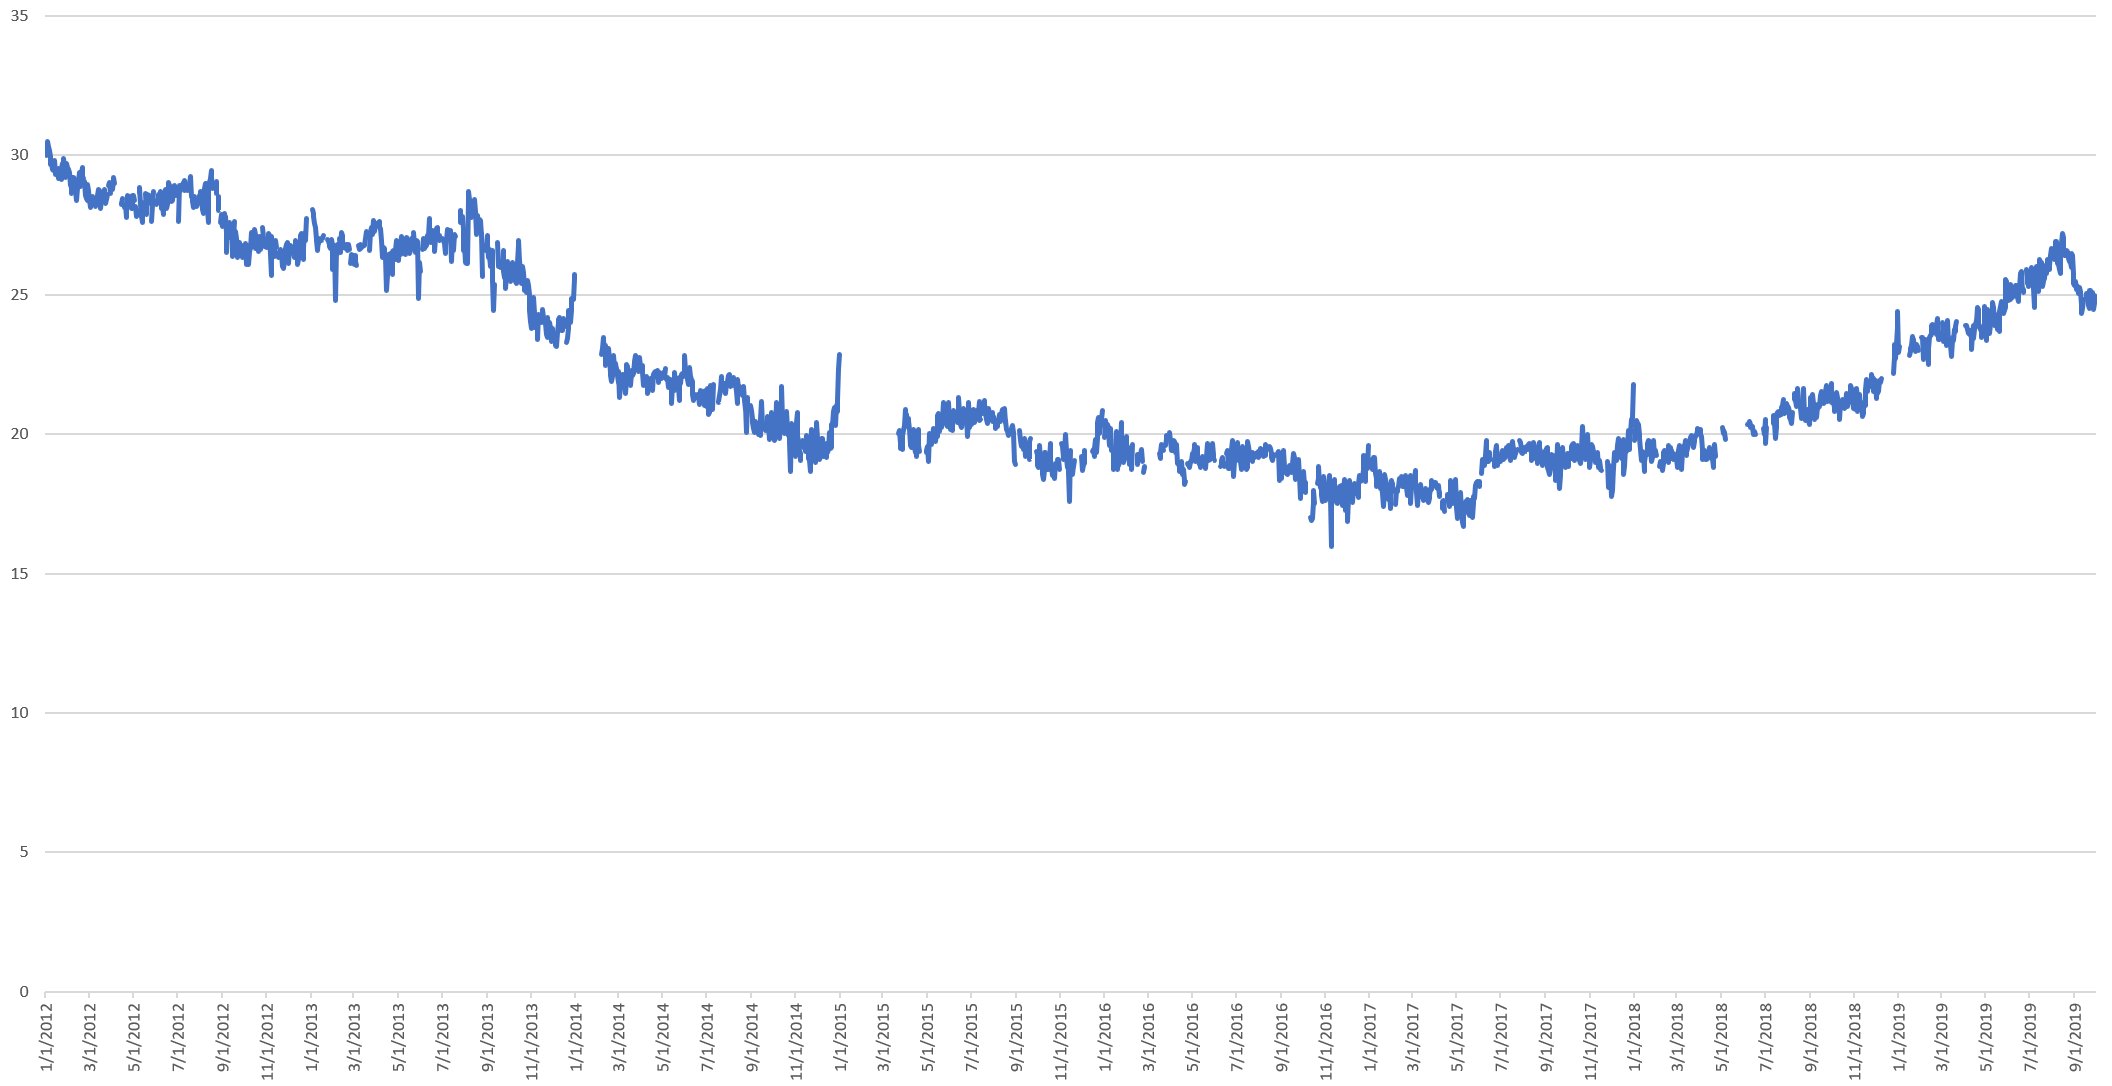
Replying To Other Users
How often are tweets a reply to another user, suggesting a conversation?
What percentage of users each day reply to another user?
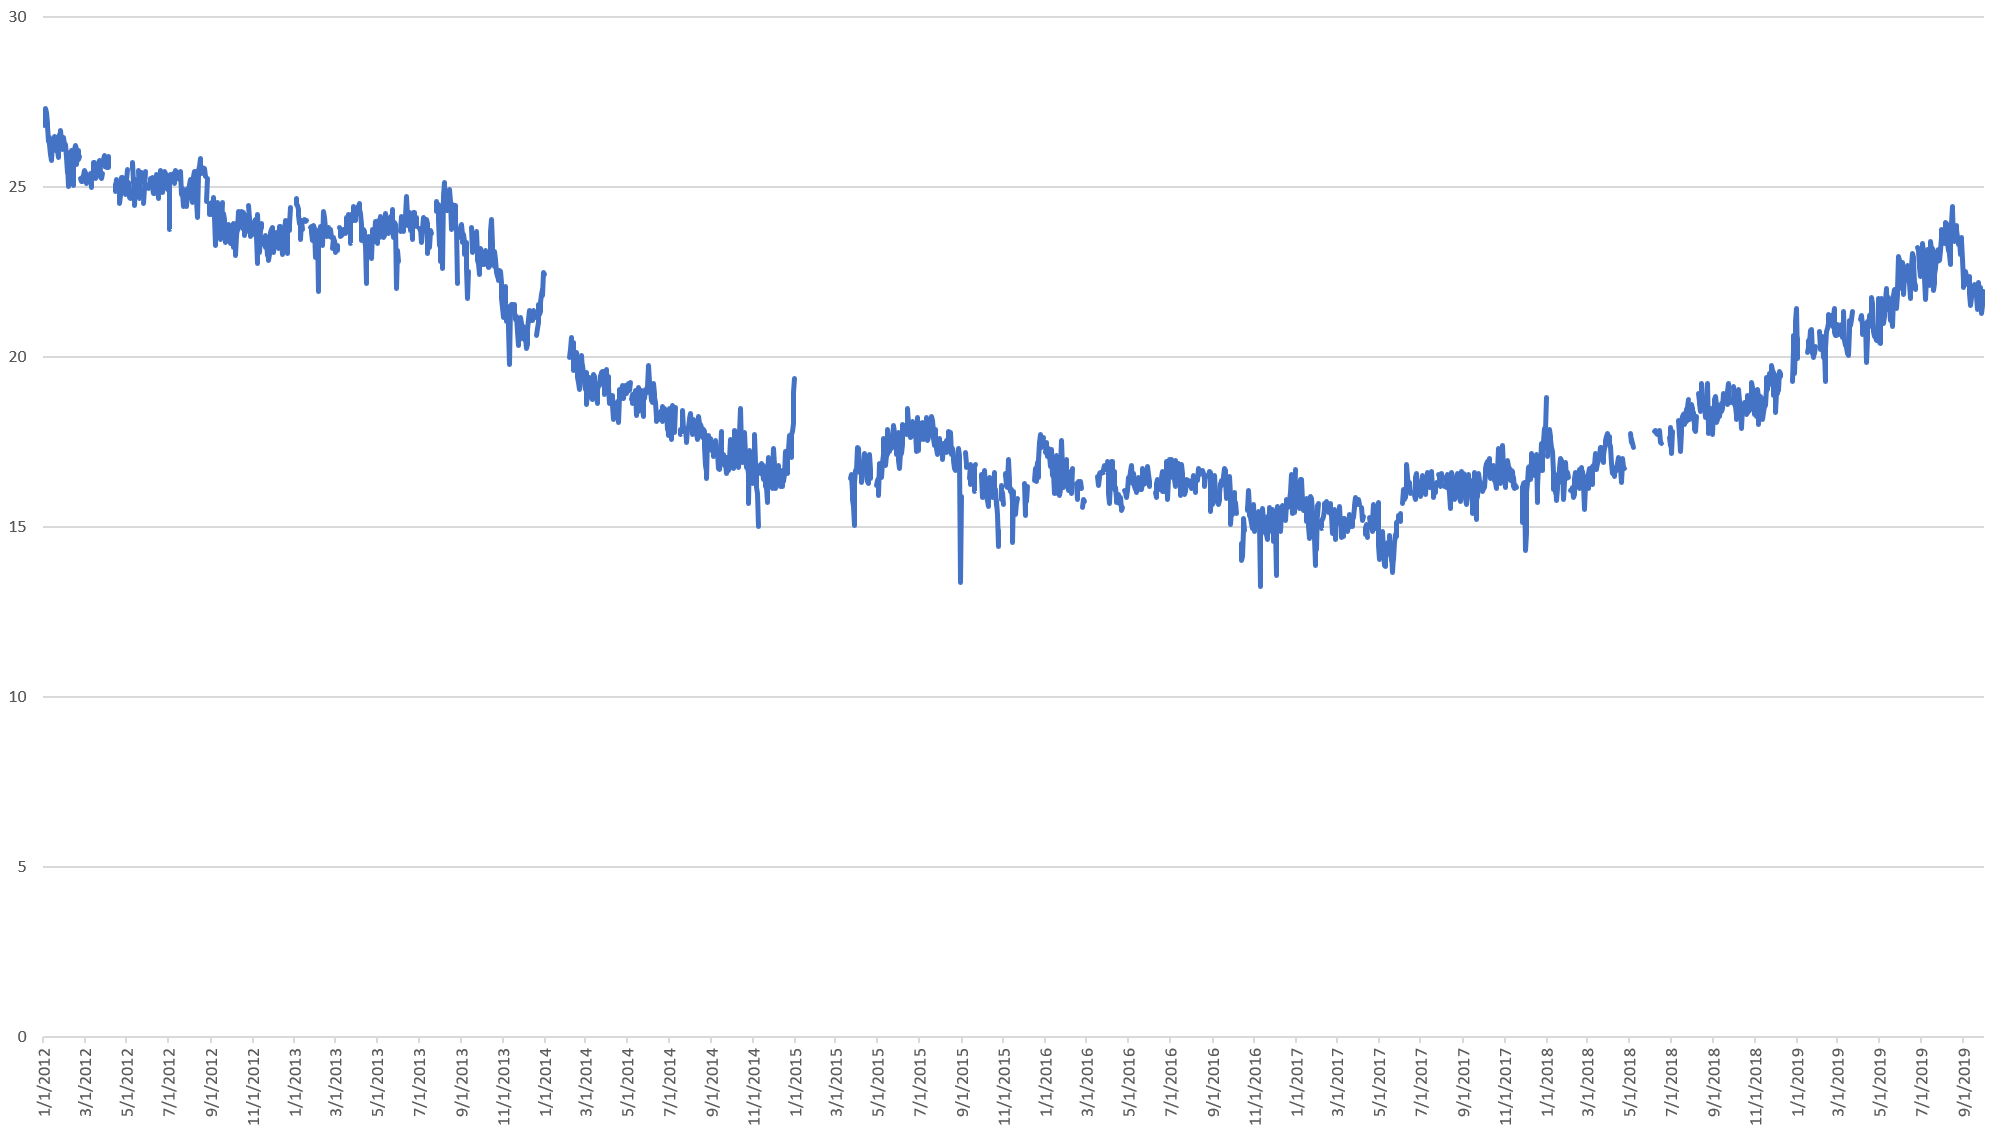
Tweets Mentioning Other Users
What percentage of all tweets mention another Twitter user in any way? This continues to rise steadily from early 2017, suggesting more and more Twitter is about targeted discussion with users attempting to reach specific other users with their tweets, rather than generalized broadcasts to the world.
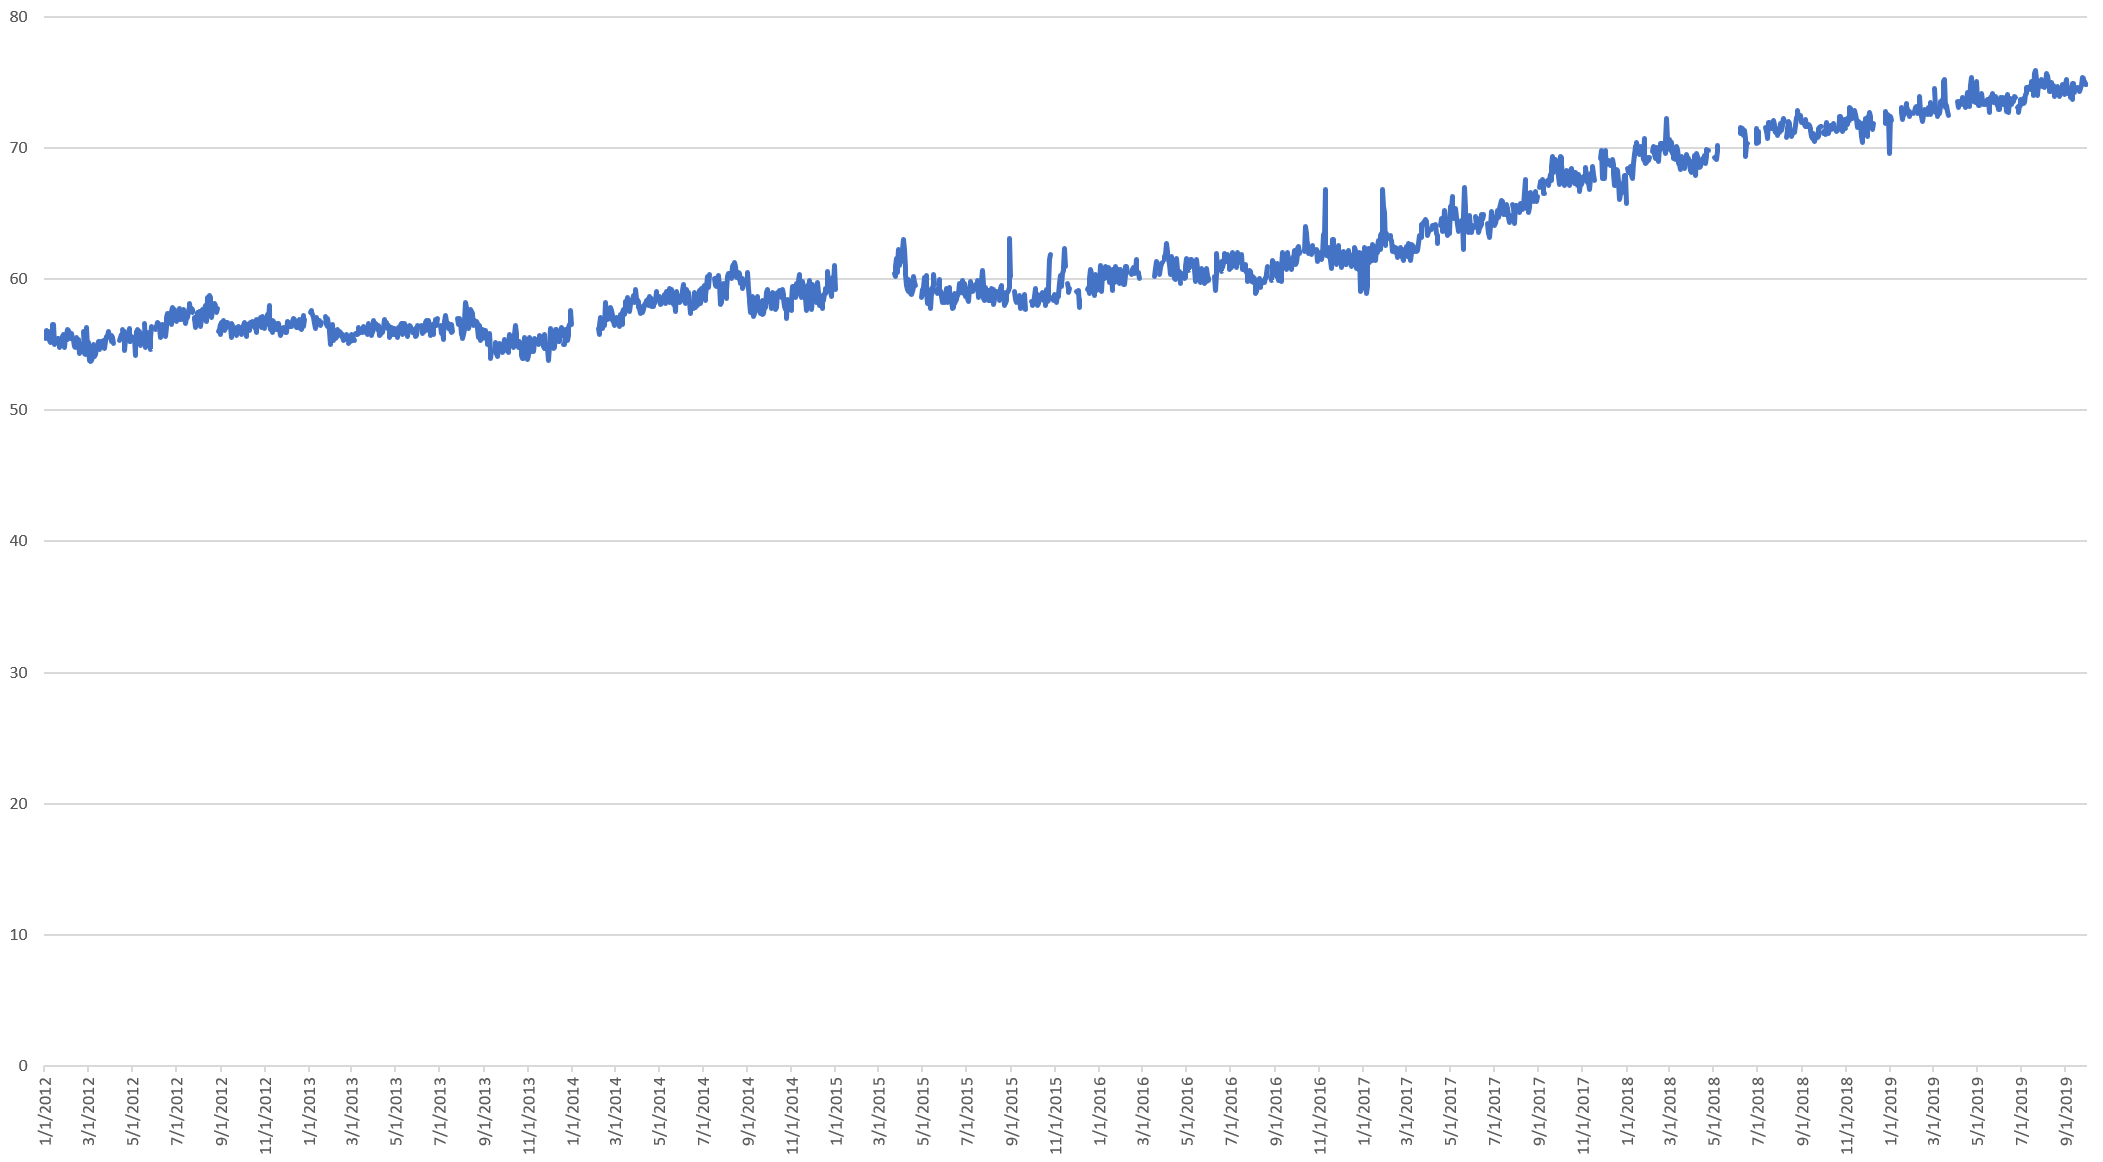
Tweeting Links
What percentage of daily tweets contain a URL of any kind?
The Total Daily Size Of The Twitterverse In Characters & Bytes
Just how big is the Twitterverse?
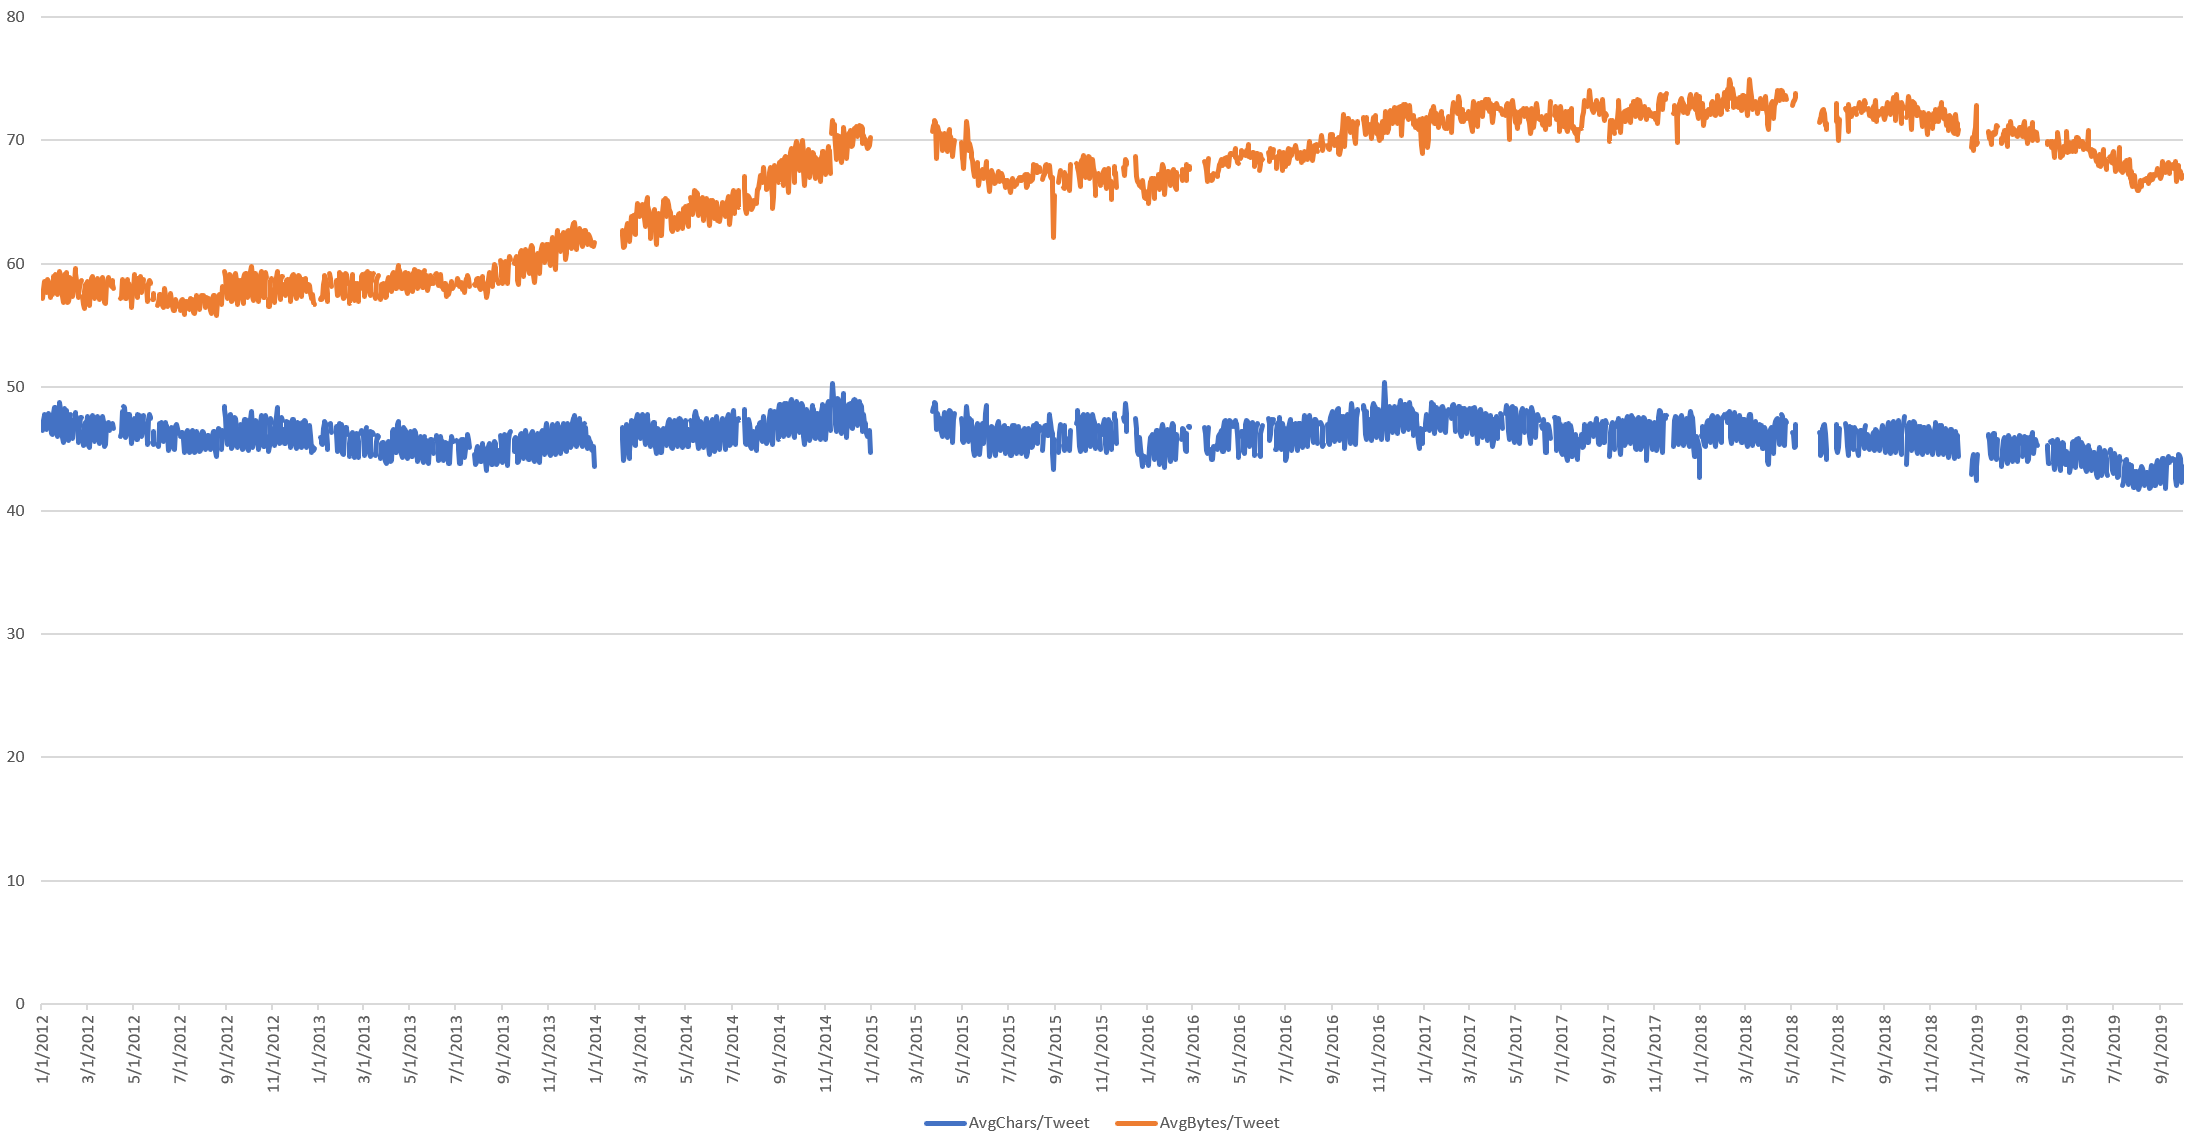
The size of the average tweet in terms of characters and bytes (in the case of multibyte charactersets) after removing retweets, username references and hyperlinks has remained relatively stable over time. Though interestingly, the average tweet size has decreased steadily since late 2016, suggesting tweets are increasingly short messages.
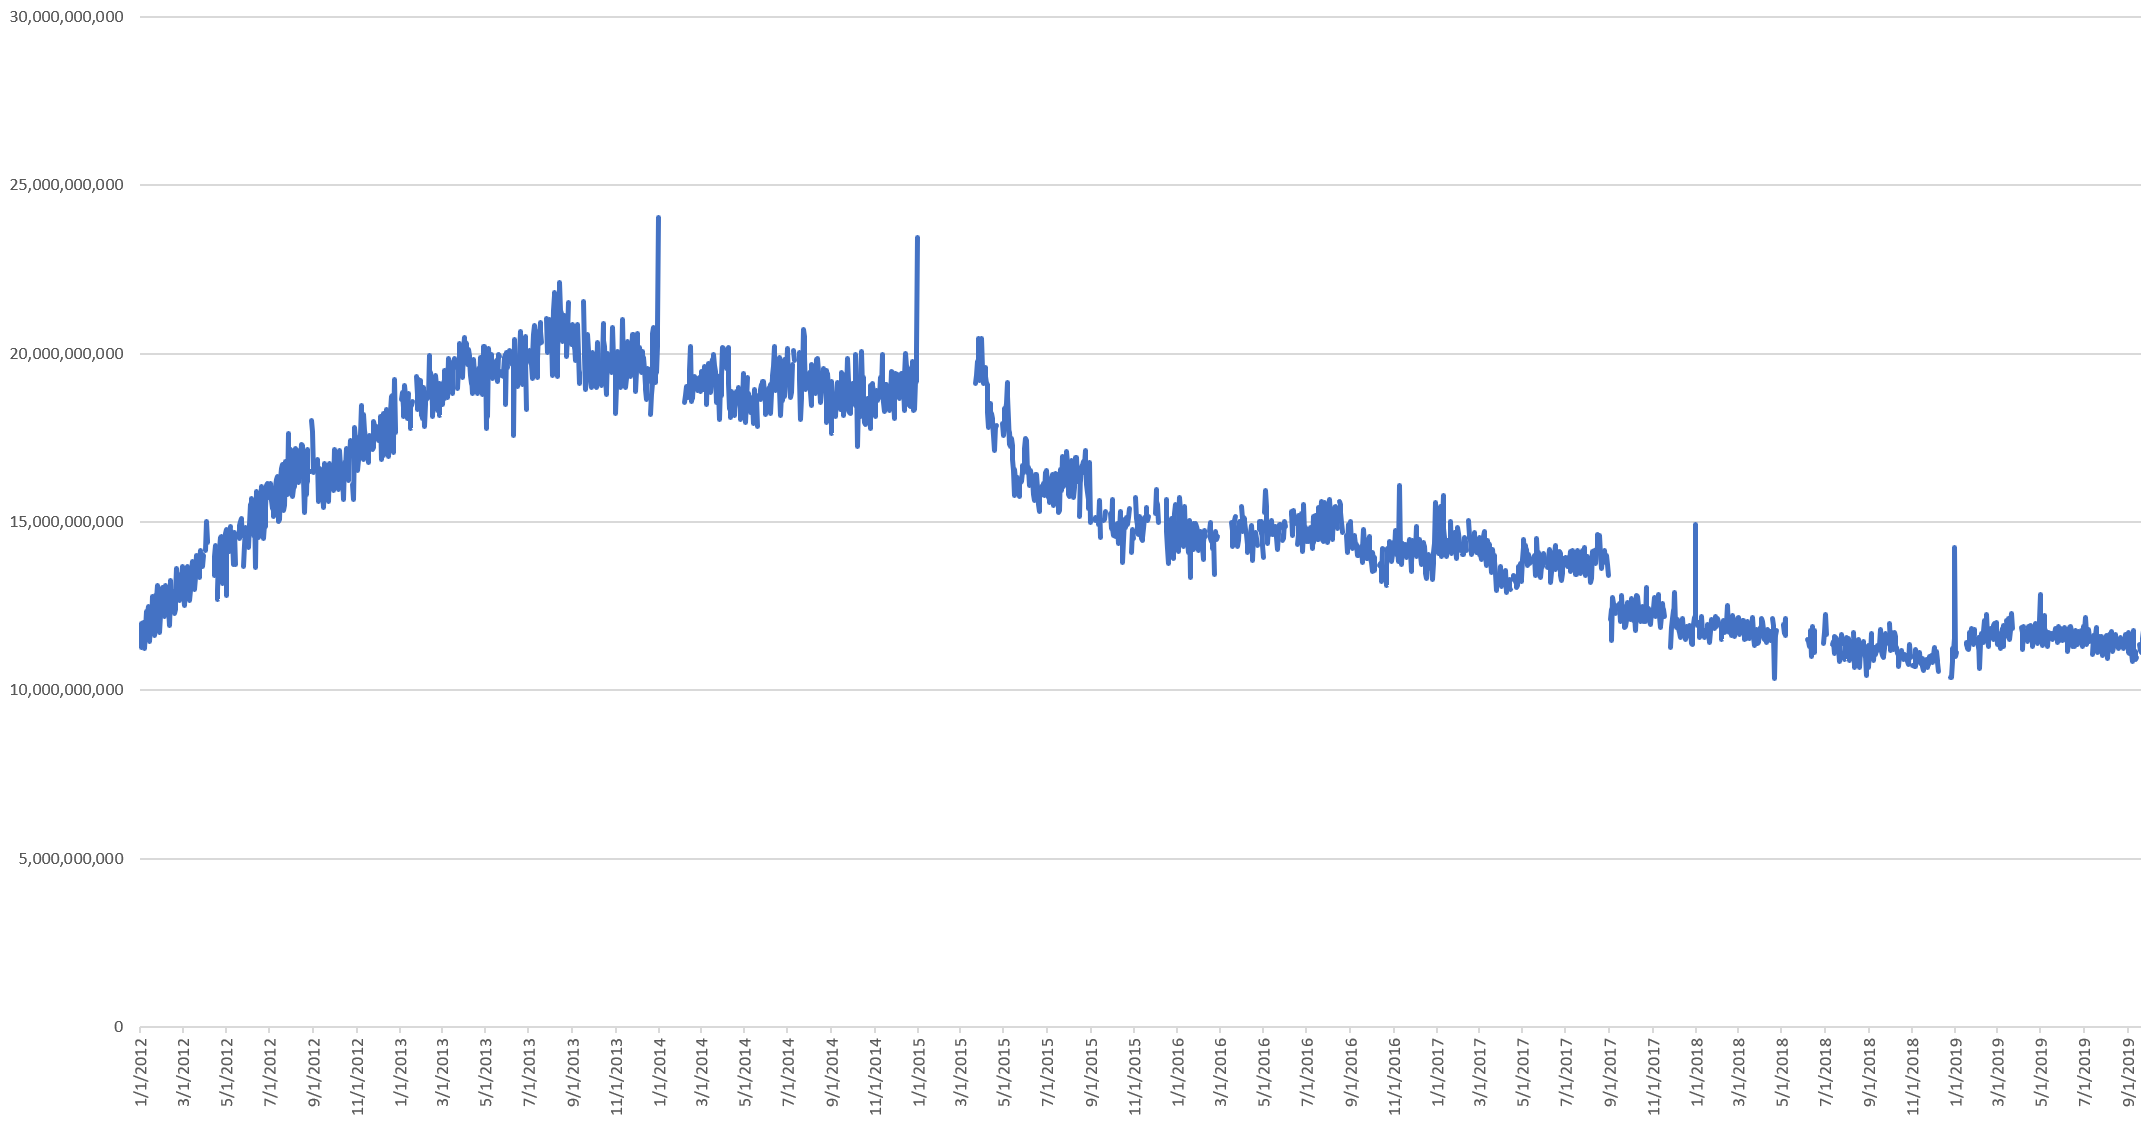
What about the sum total of the entire Twitterverse?
The timeline below shows the total number of bytes of content posted to Twitter each day after removing retweets, username references and hyperlinks, showing that on a typical day in 2019 just 11GB of text is posted to Twitter – slightly less than was posted on a typical day seven years ago in January 2012.
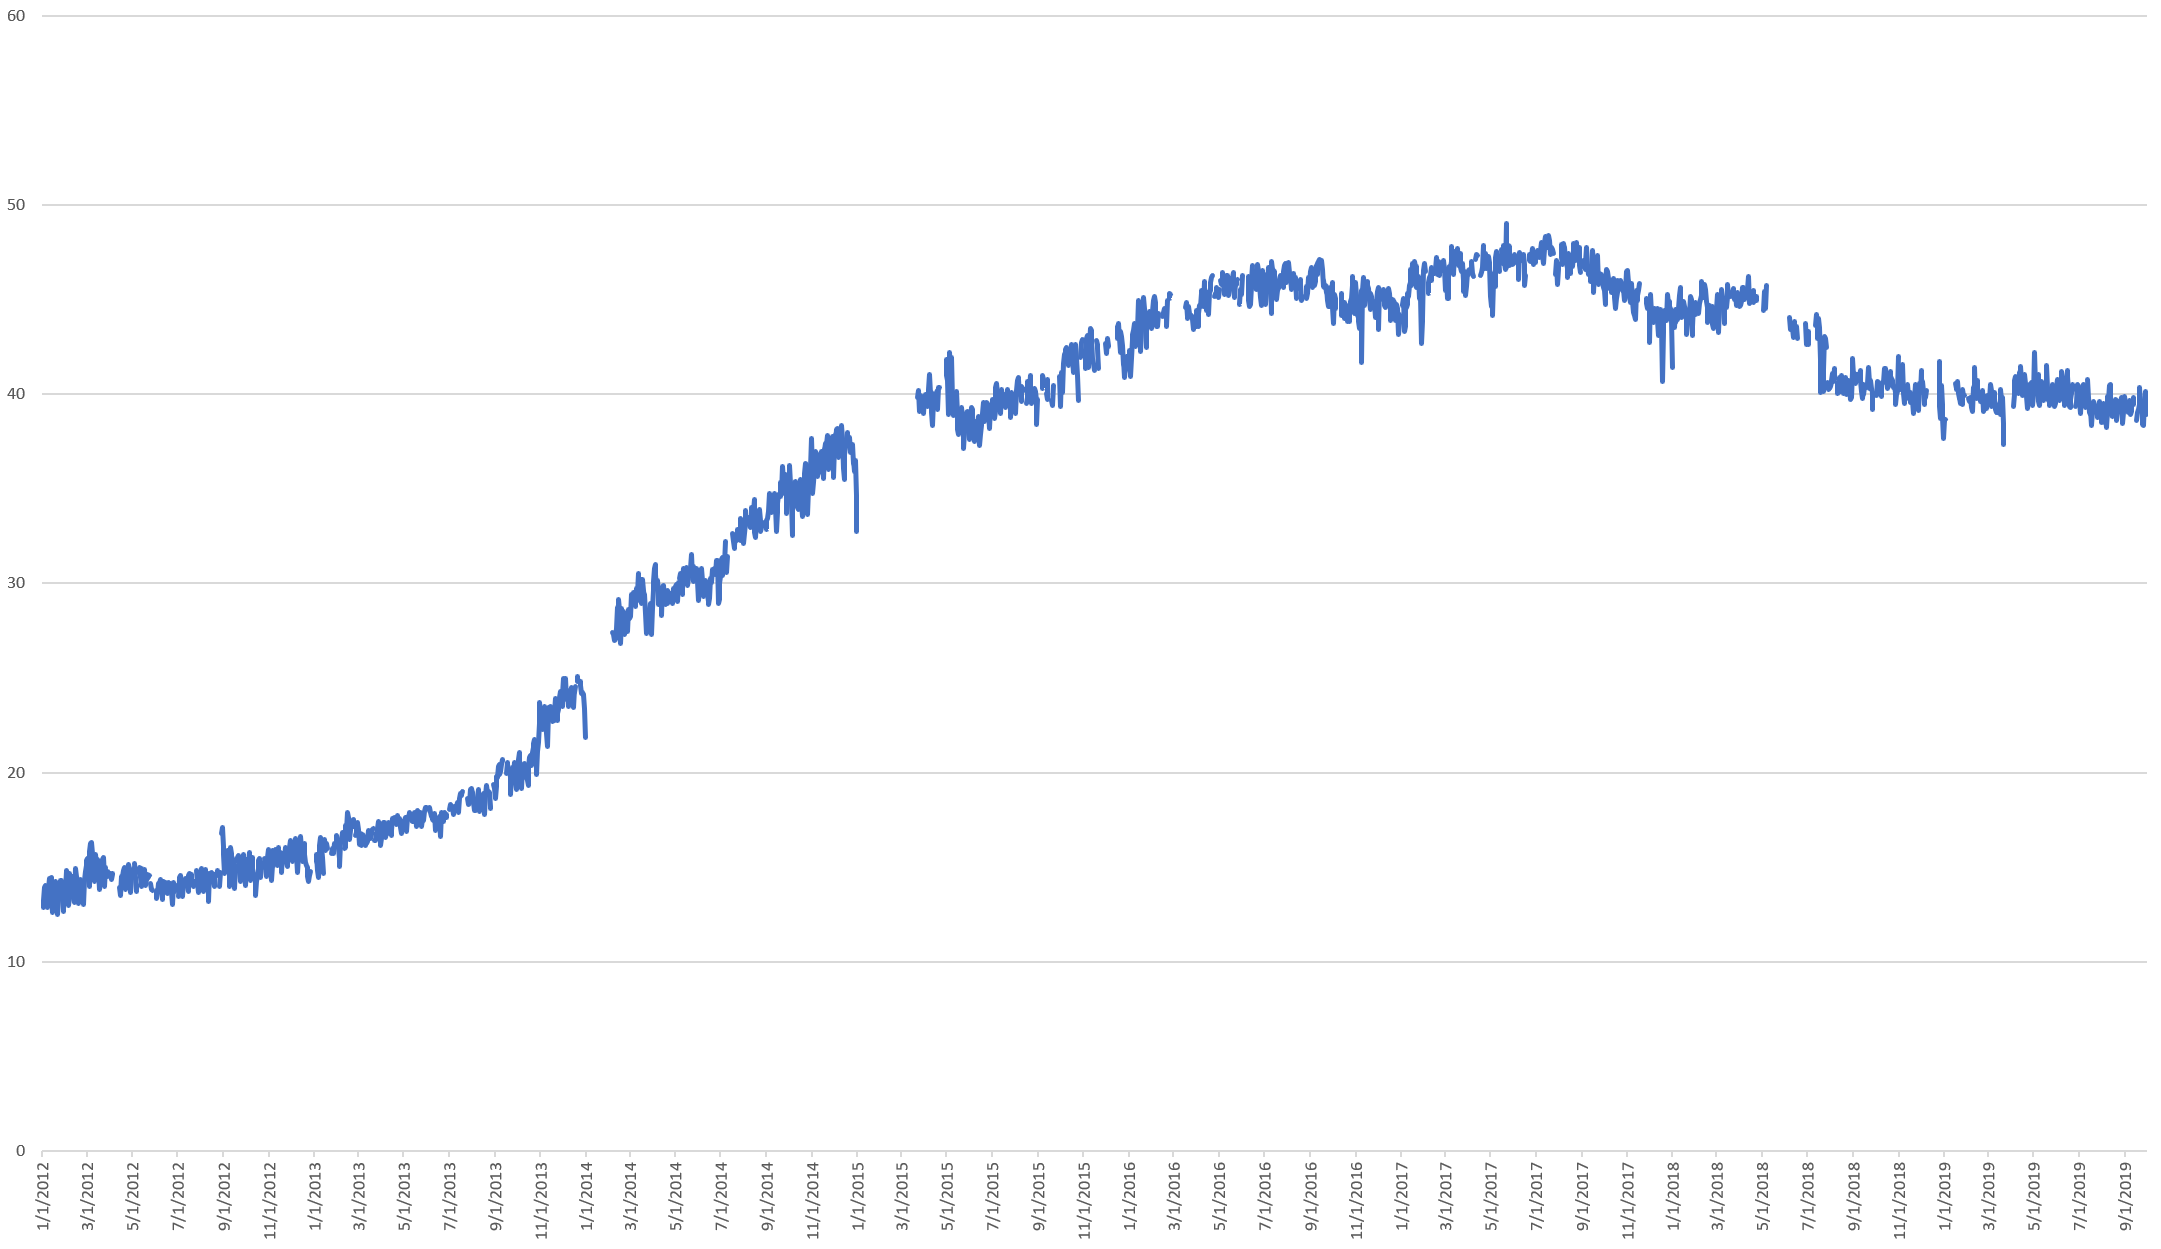
The Dominance Of English Twitter
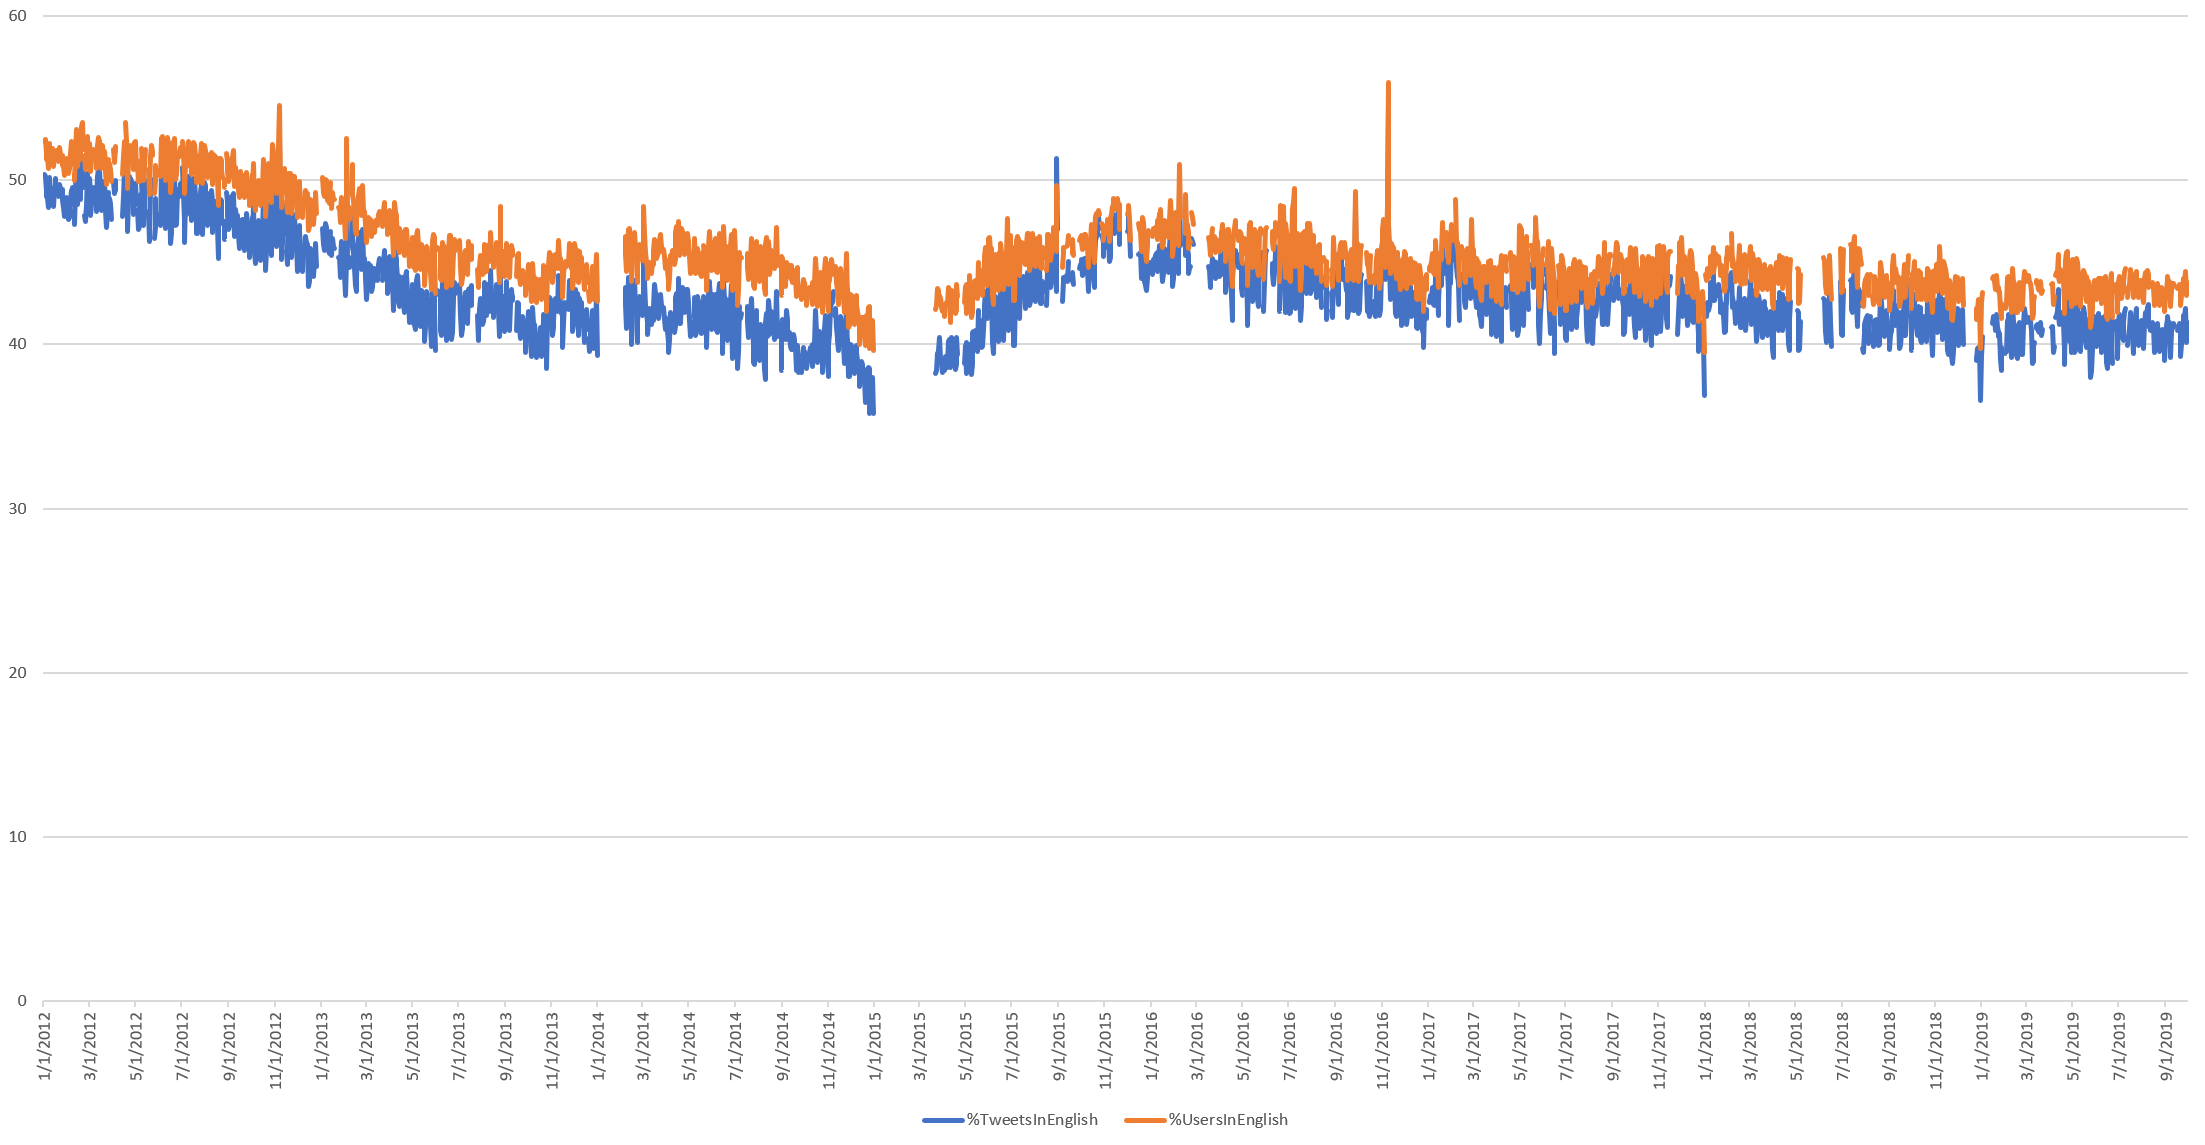
What percentage of all tweets are in English? There was a sharp decline from 2012 through early 2015, a reassurance through early 2016 and then a stable and very slow decrease over time ever since, with around 40% of tweets today being in English. Note that these results were computed using CLD2 and exclude cases where no language could be determined (such as a tweet that contains only a hyperlink).
Average Age Of Twitter's User Accounts
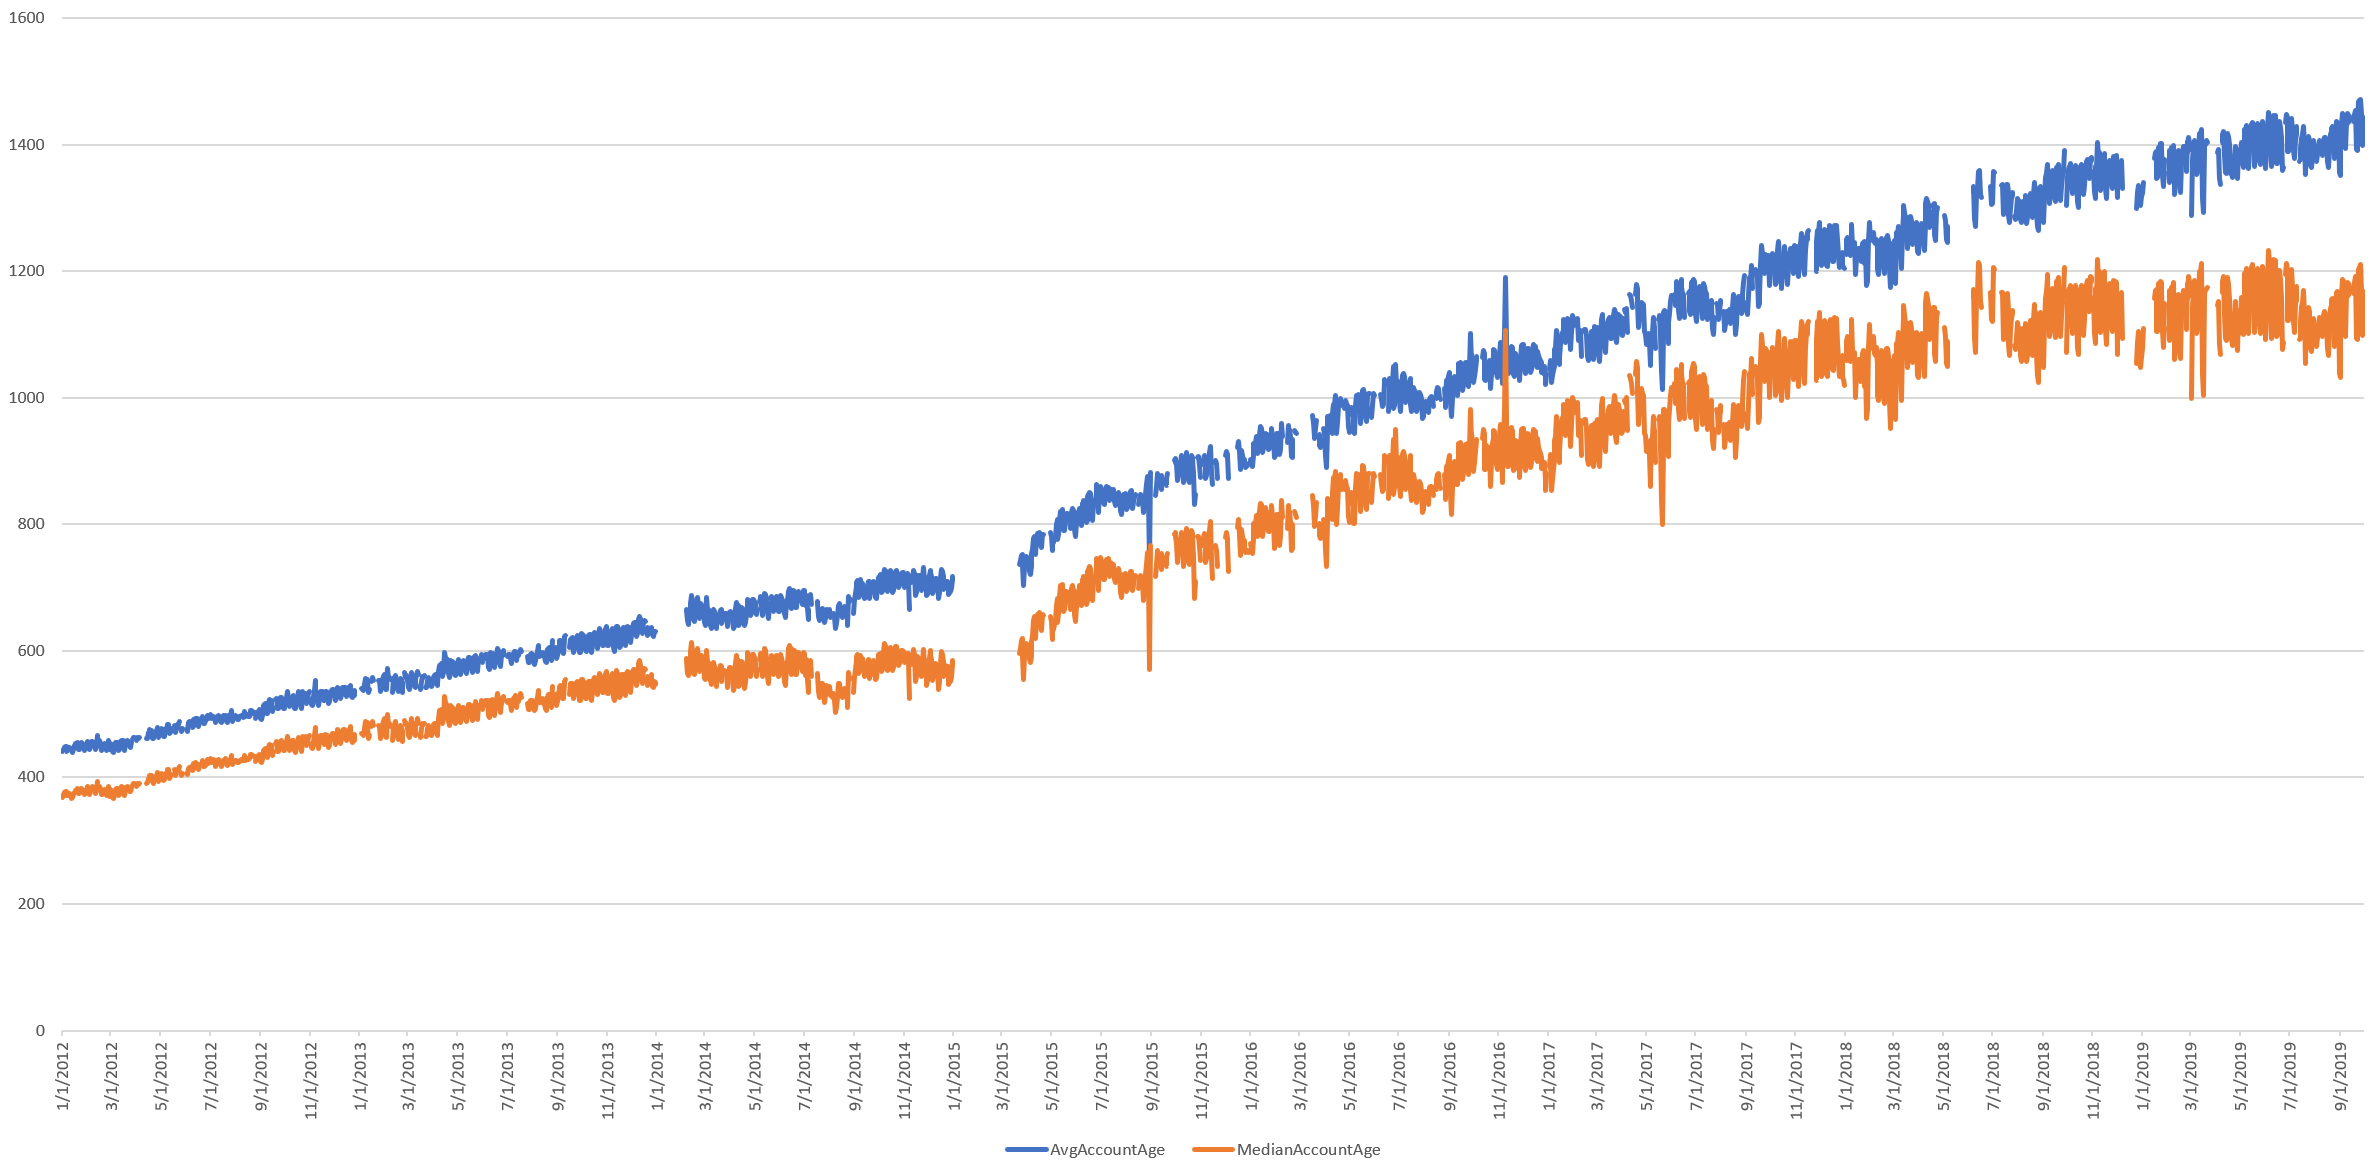
Given that Twitter is not growing, its fixed user volume could be explained either by little change in its user base from its early days or by rapid churn in which every user is replaced by another user. The timeline below shows that the average tweeting account age continues to grow linearly, but the median leveled off in mid-2018, suggesting there has been an influx of new users since then.
What about the median account creation year over time?
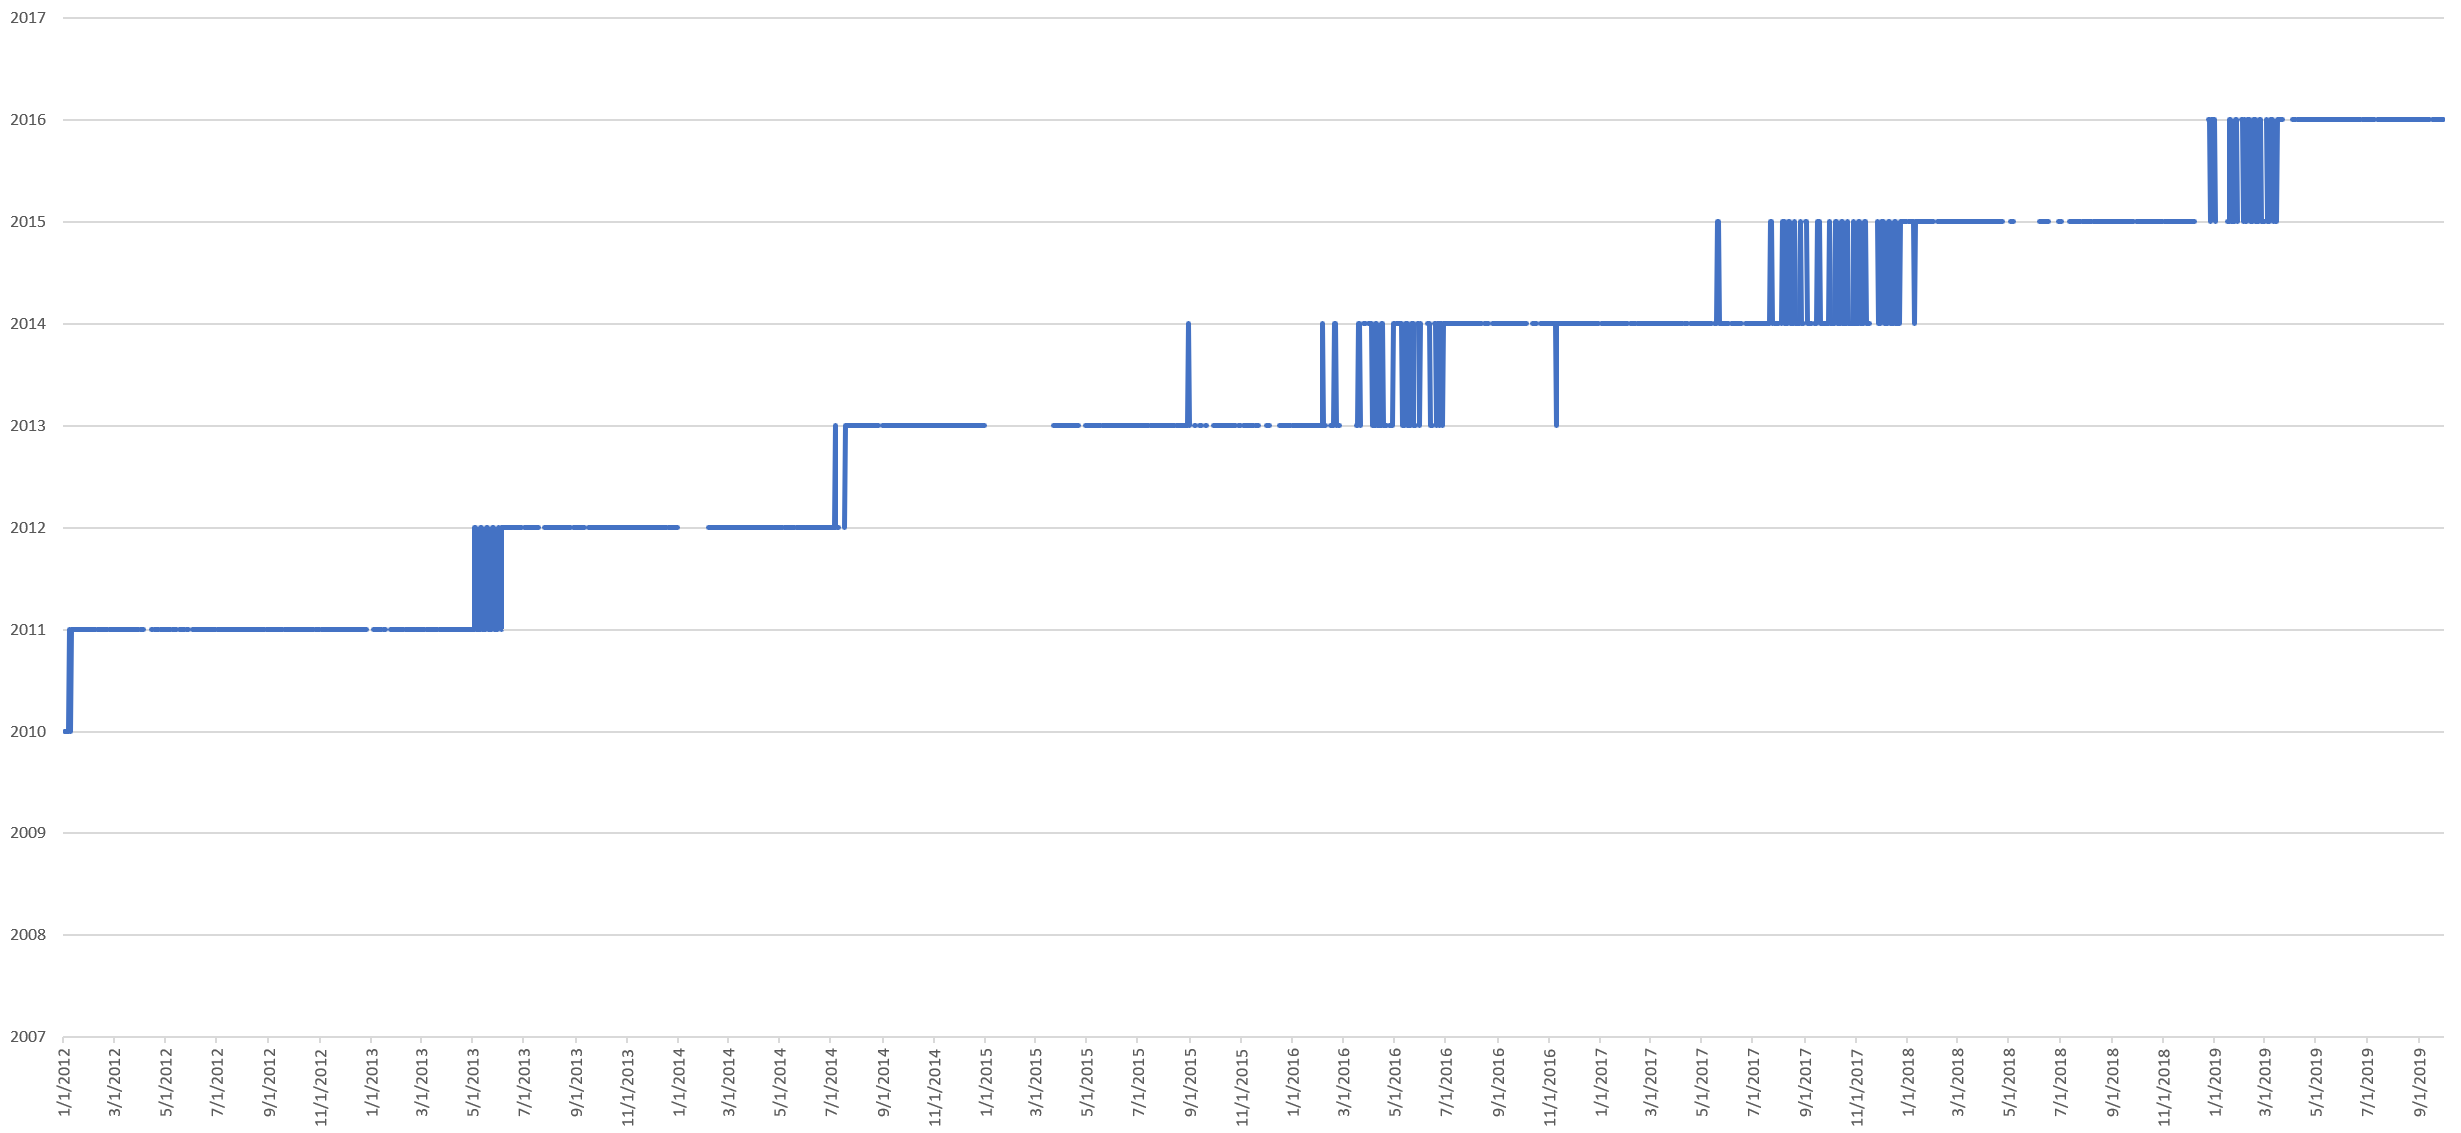
The Geography Of Twitter
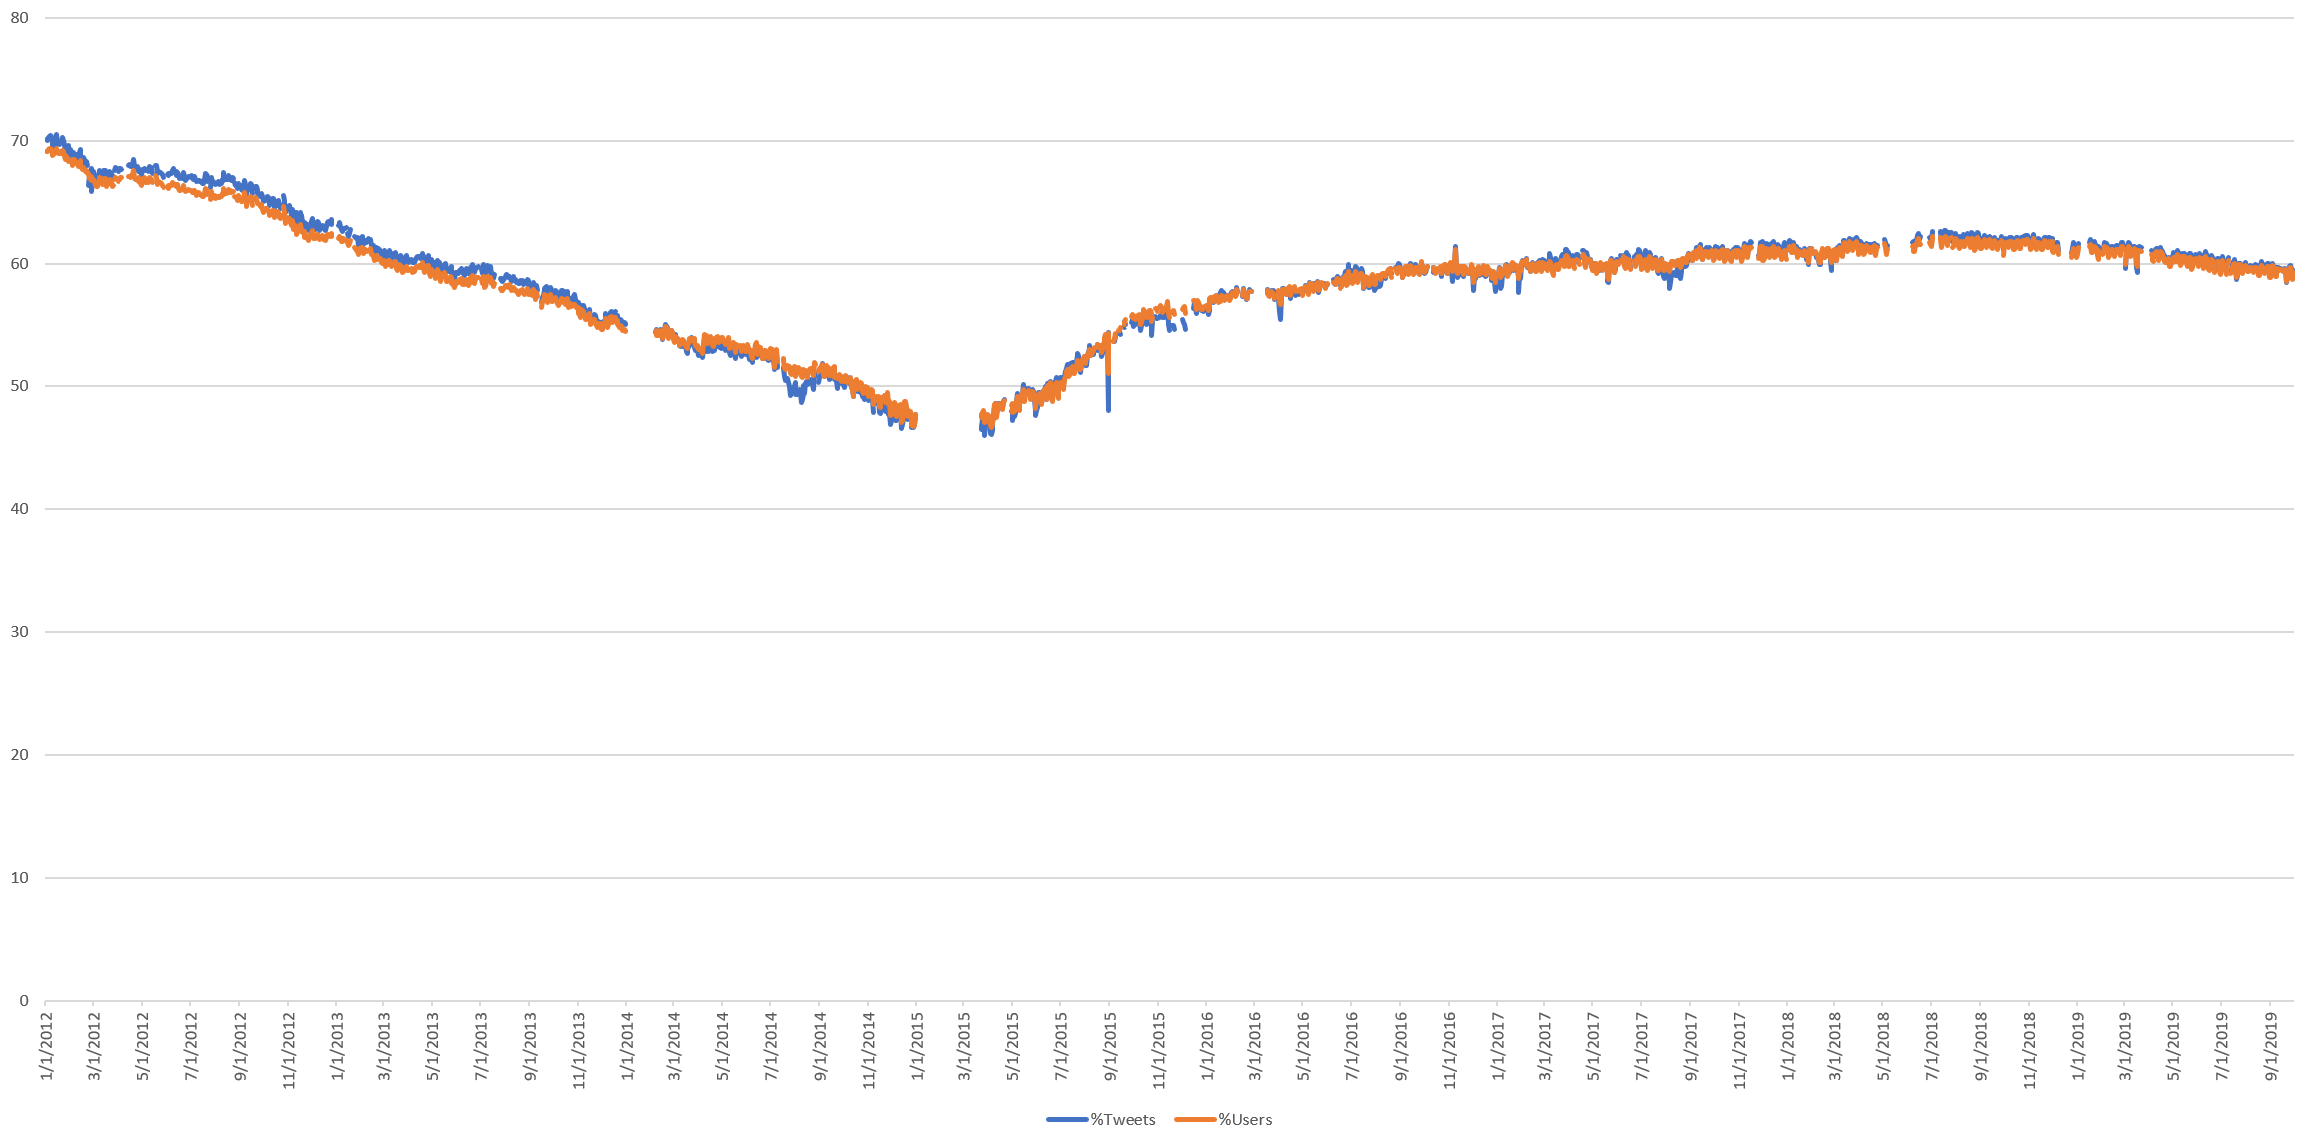
Finally, what about the geography of Twitter?
What percentage of all tweets and Twitter users provide a non-null "Location" field?
What percentage of all tweets were geocoded with either a GPS coordinate or Place location and thus mappable? The percentage continues to collapse, suggesting that the era of "Mappable Twitter" is rapidly coming to a close.
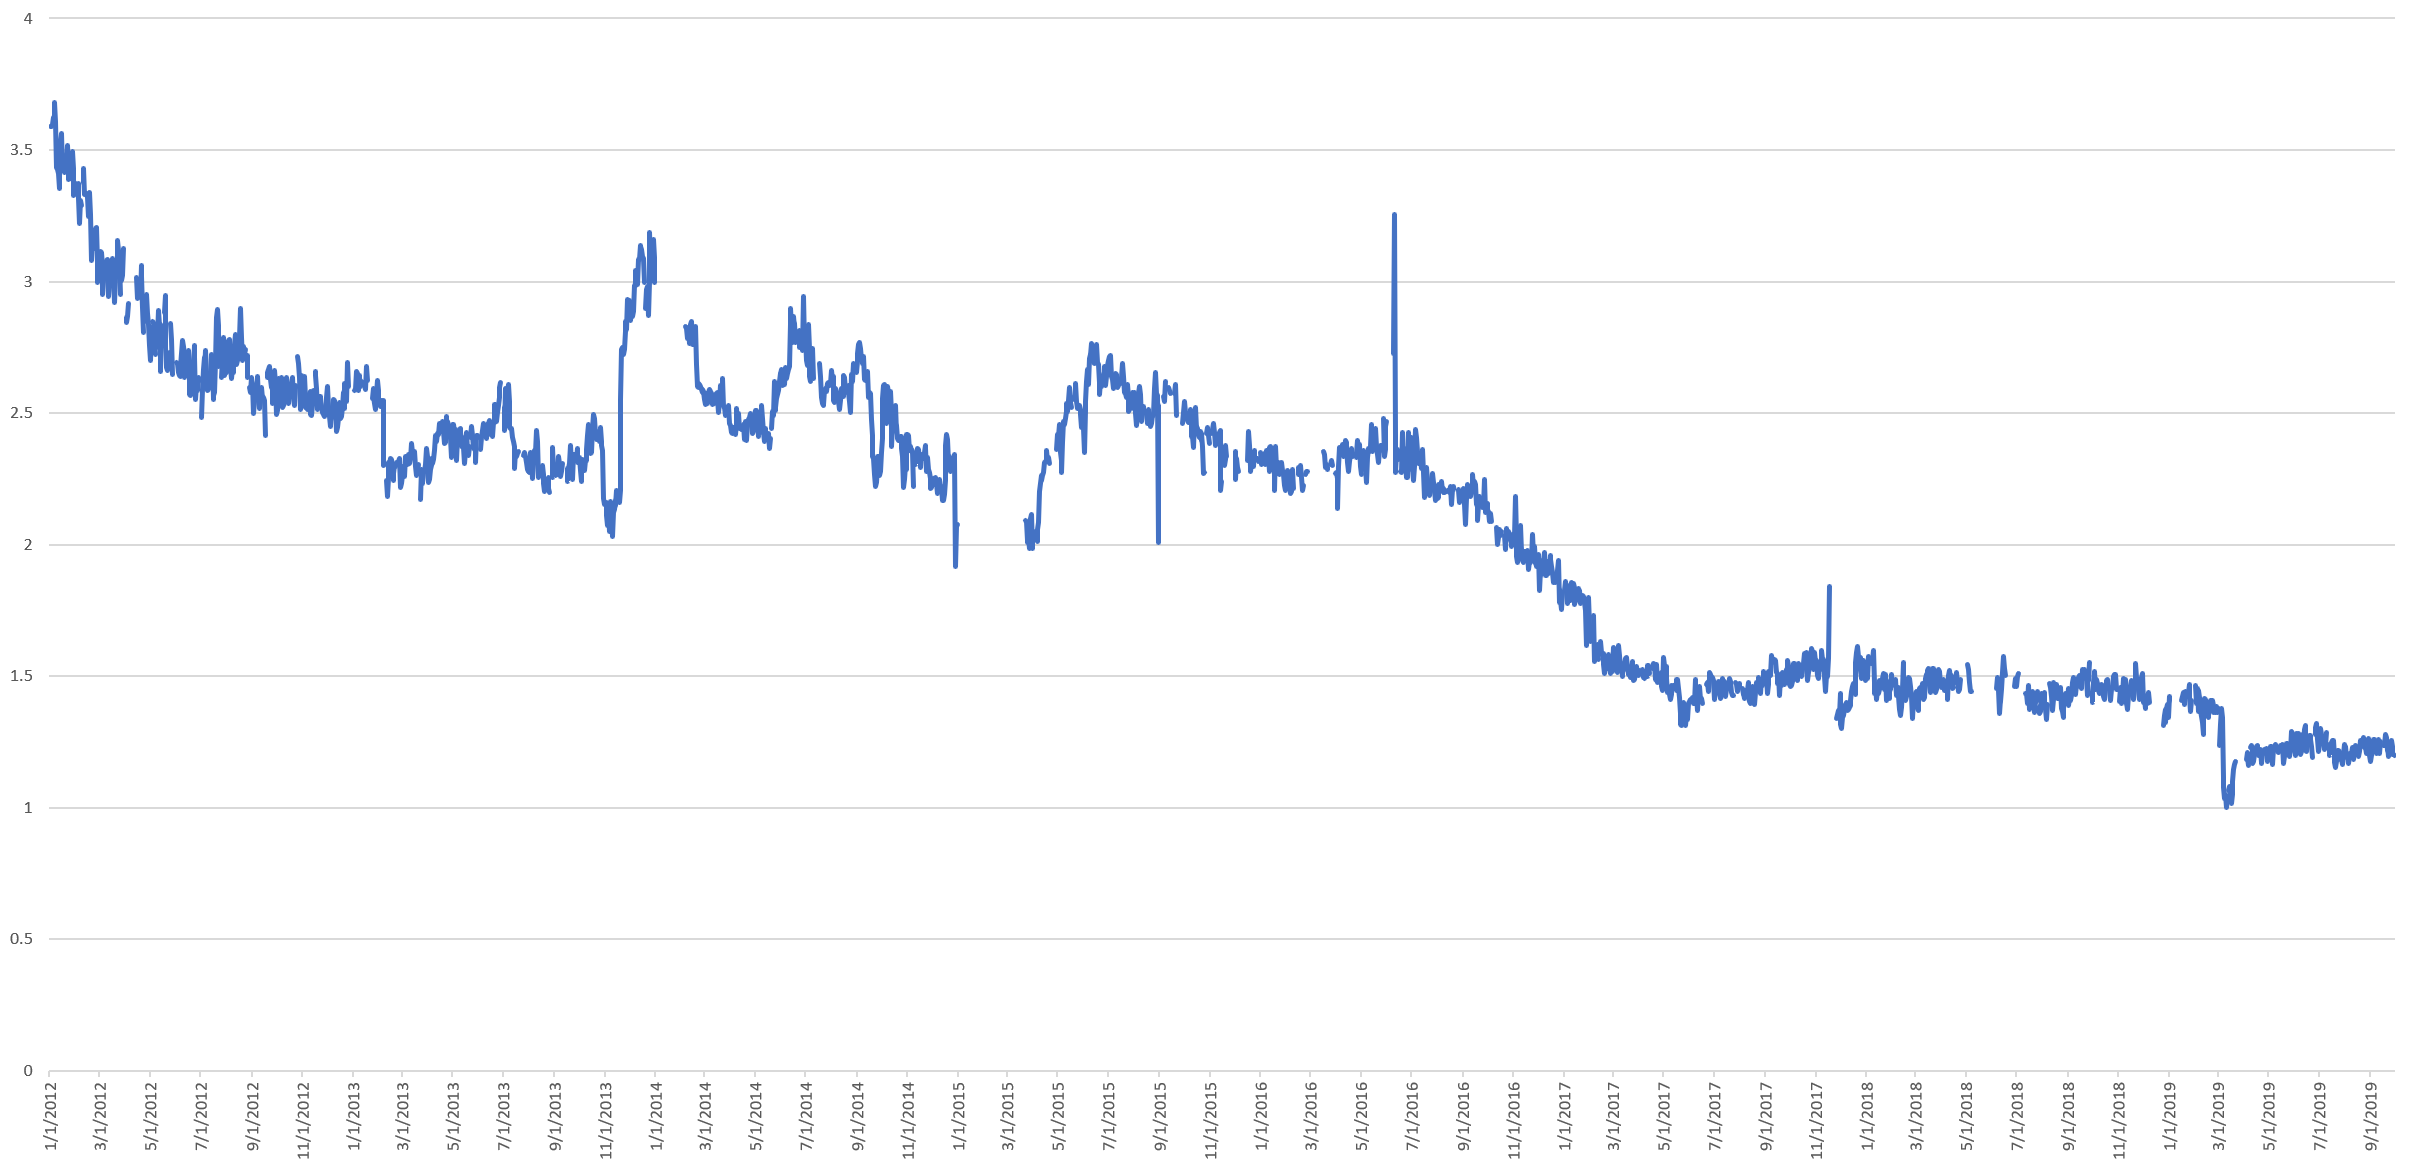
More devastatingly, the numbers above reflect both tweets with precise GPS coordinates that yield the beautiful and intricate maps we've come to associate with Twitter, tracing transportation corridors and city life, and city-centroid-level "Place" locations that merely report the fixed centroid of an entire city. Billions of tweets that all report the same coordinate of the centroid of New York City renders mapping attempts futile.
The timeline below shows the percentage of tweets that have precise GPS coordinates, showing that by and large, the era of precision Twitter mapping has come to an end. Today less than 0.08% of tweets (a mere 250,000 a day out of 340 million total tweets) have GPS coordinates and falling rapidly.
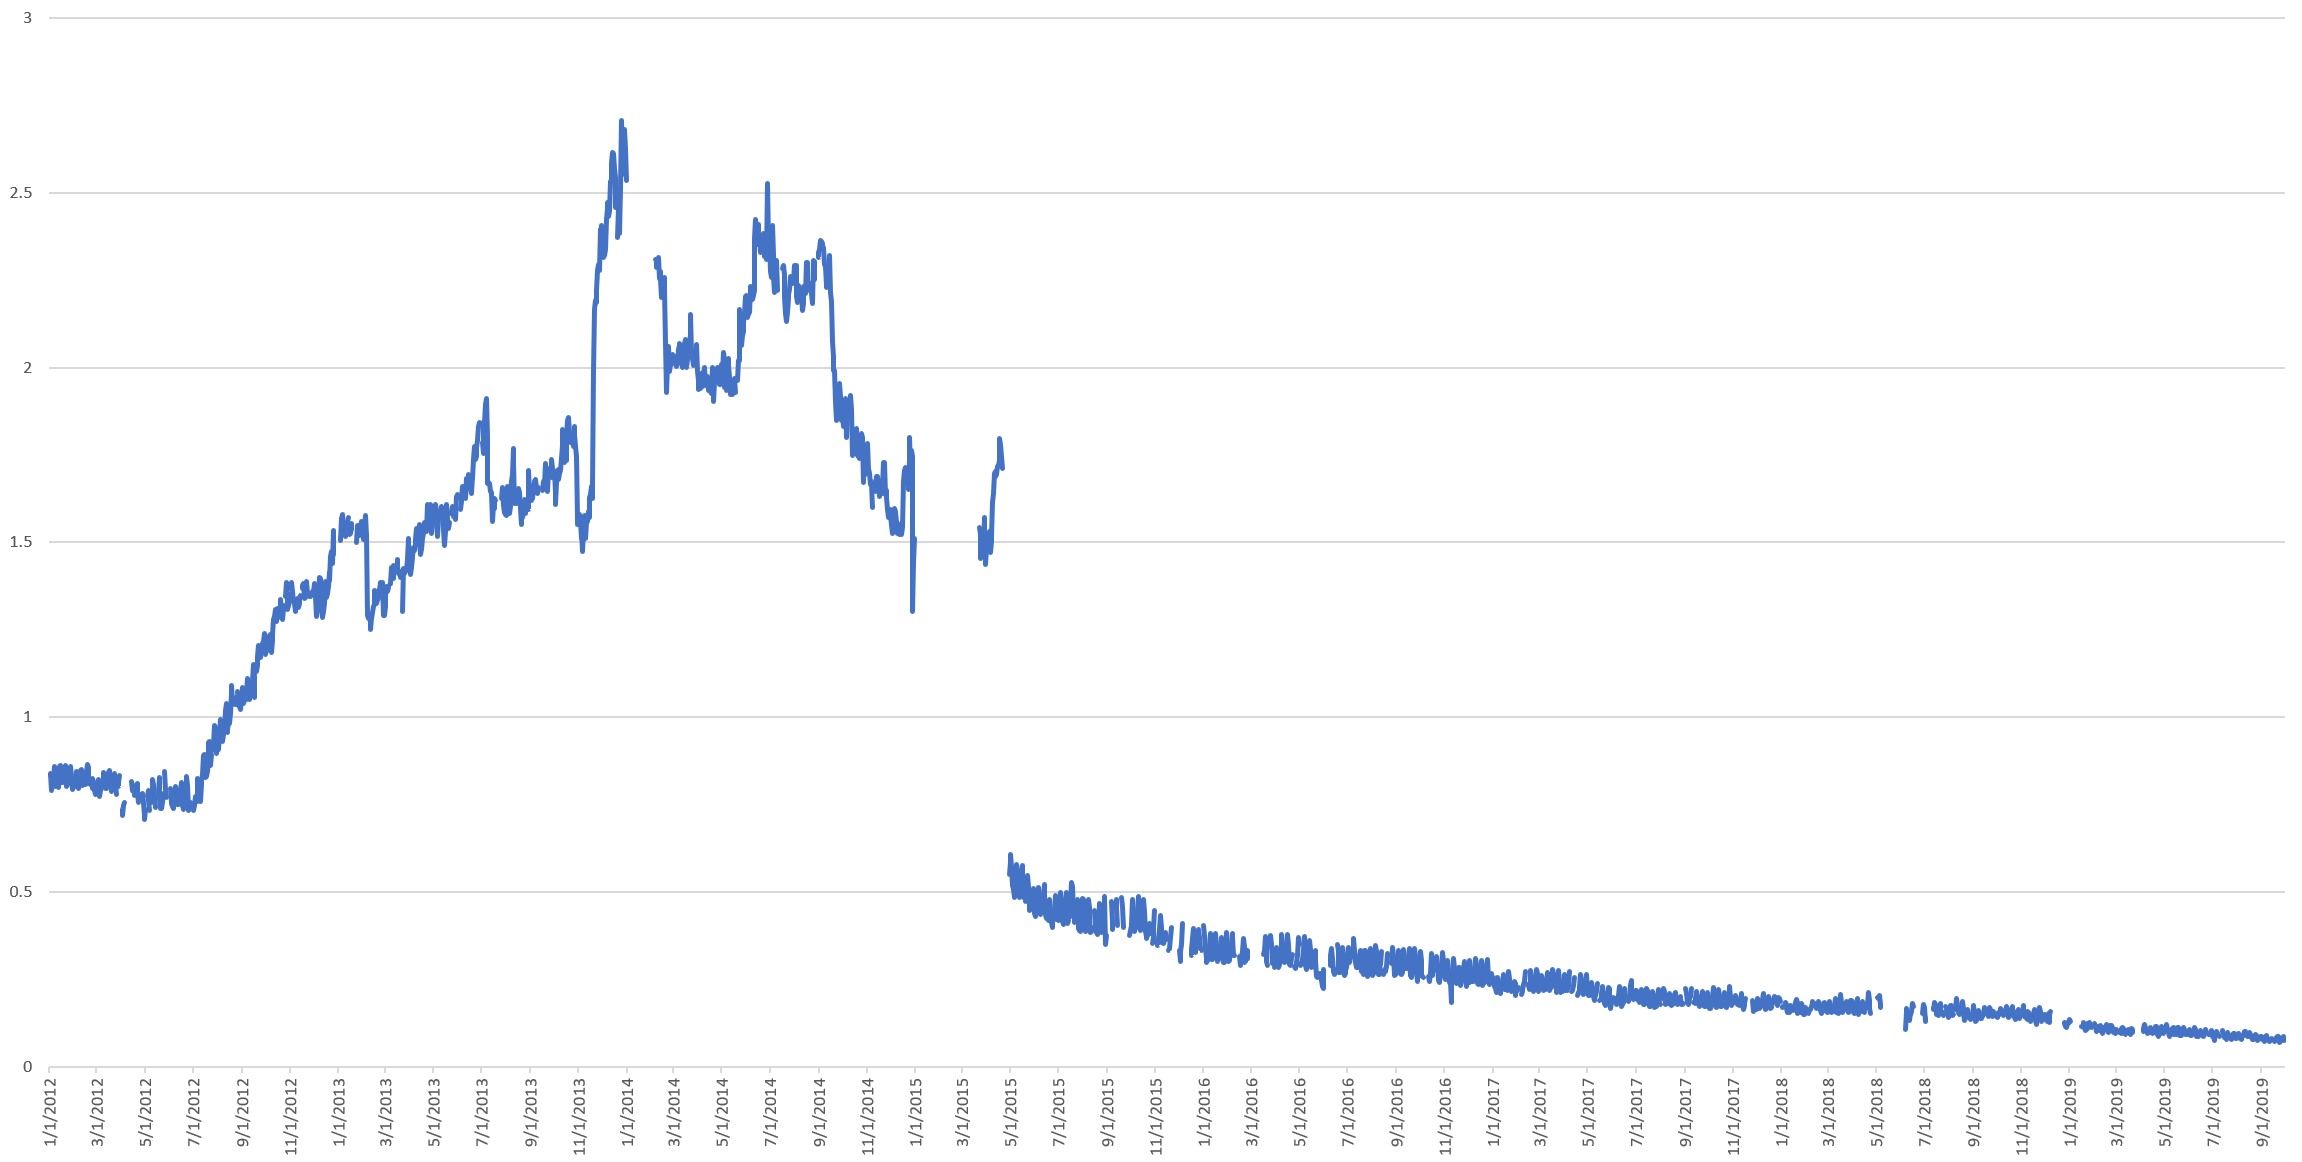
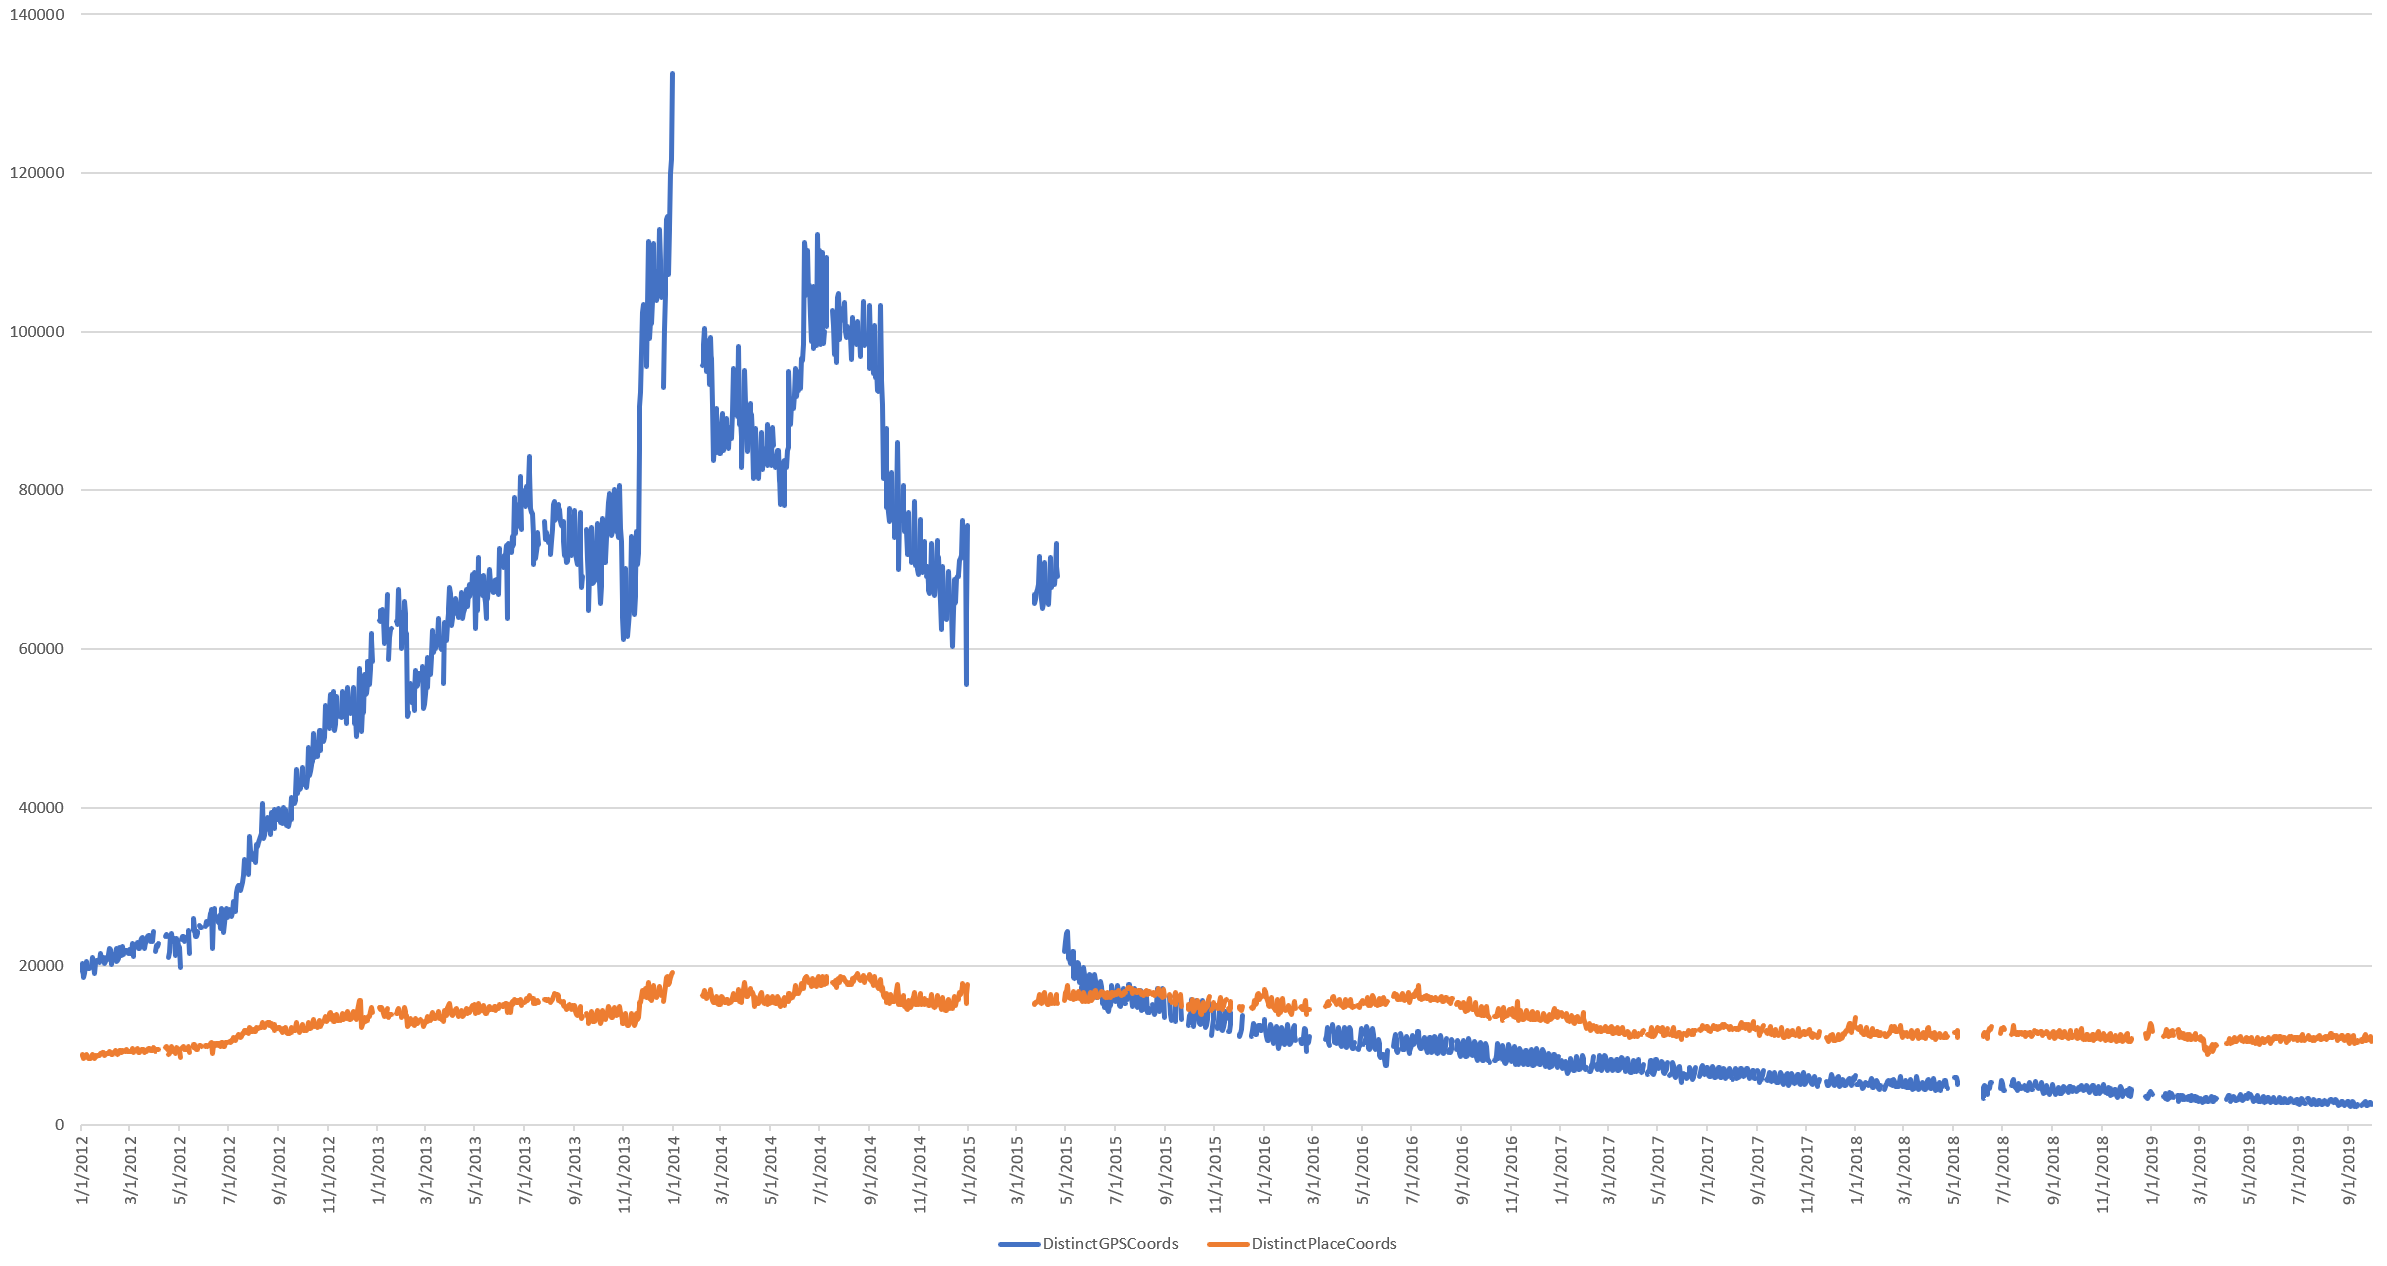
Most importantly of all, this rapid decline of geotagged tweets means the total number of distinct geographic locations (rounded to 6 decimals) represented in Twitter's 1% dataset has continued to collapse, as seen below. "Place" locations have remained relatively stable, since they represent fixed city centroids and a small set of major landmarks.
Conclusion
For more detail on the methodology and an explanation of the implications of each of the graphs above, see the original study from March 2019: Visualizing Seven Years Of Twitter's Evolution: 2012-2018.