Last year we used the pilot version of the Visual Global Entity Graph to track depictions of police on the evening news. Using the new Visual Global Entity Graph 2.0, what can we learn about the amount of airtime depicting police over the past decade on ABC, CBS and NBC evening news?
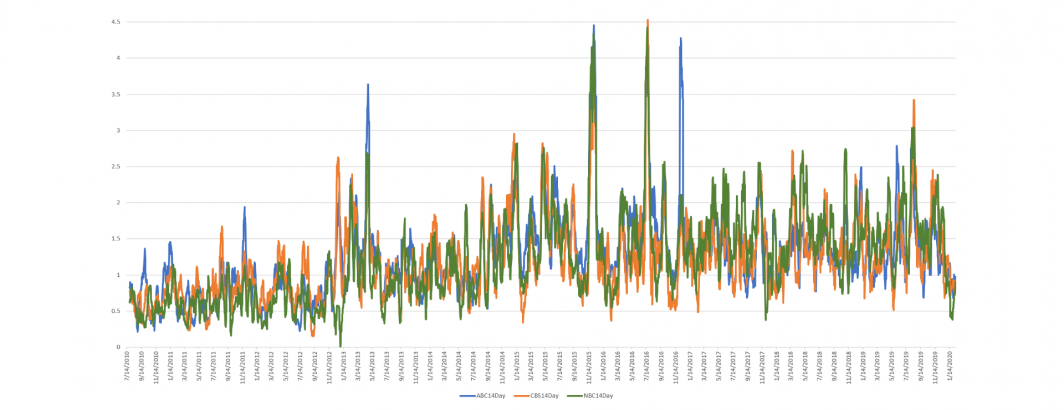
The timeline below shows the percentage of the total airtime on the ABC, CBS and NBC evening news broadcasts by day over the past decade that depicted police, smoothed with a rolling 14 day average to make the trends more apparent. Immediately clear is that depictions of police remained fairly steady through Fall 2012 and remaining elevated ever since. The only major systematic change has been since late November 2019, when impeachment and other news appears to have displaced police depictions, though police imagery has been rapidly trending back up since the end of January.

Breaking this down by station, the timeline below shows the individual trends for ABC, CBS and NBC:
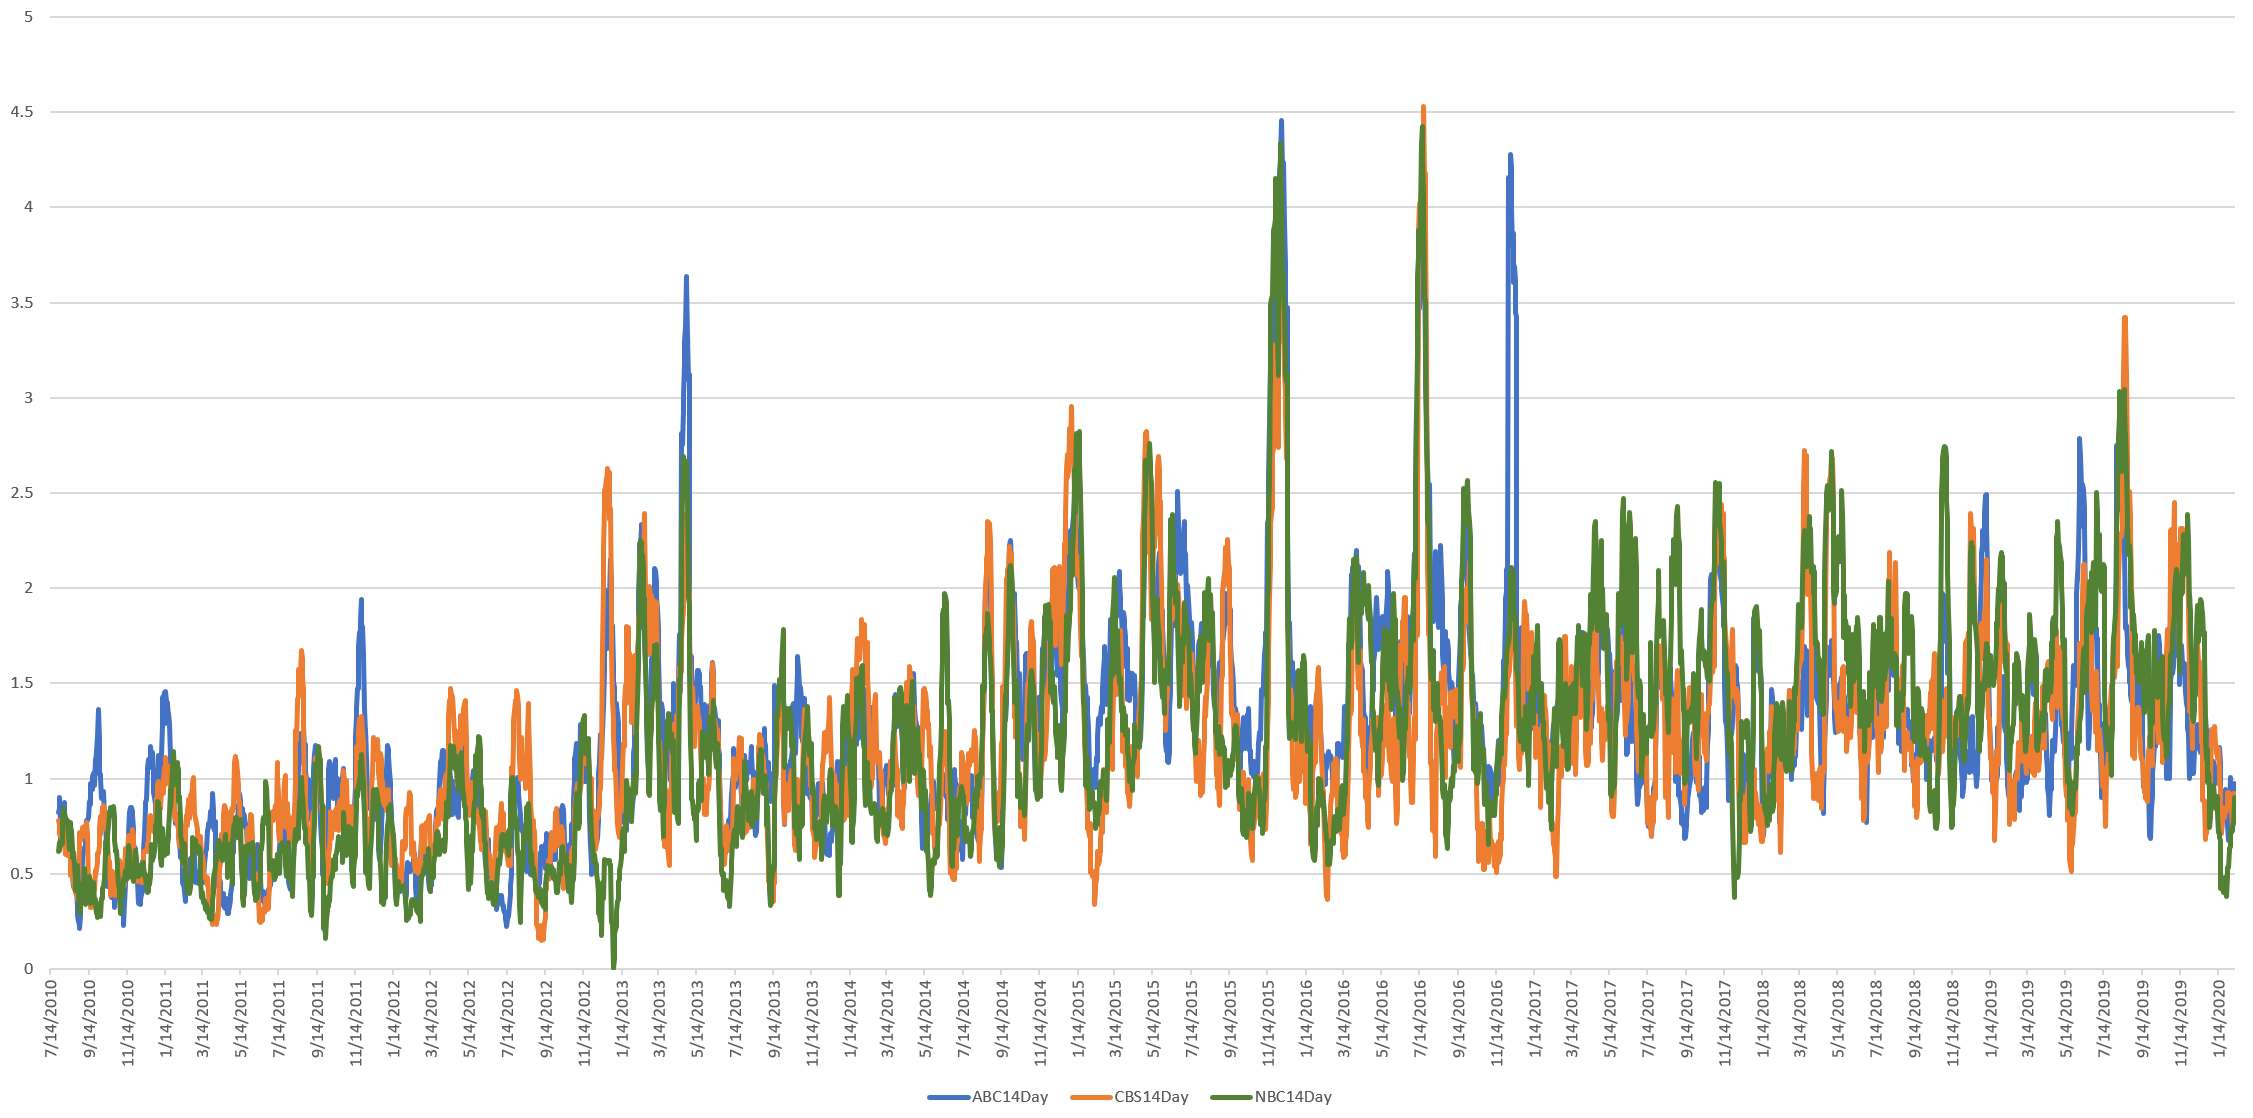
While there are slight differences, overall the three stations track each other closely, suggesting this movement towards increasing depictions of police has been systematic across the media ecosystem.
Overall, ABC spent 1.26% of its evening news airtime of the past decade depicting police, followed by NBC with 1.22% and CBS with 1.18%.
The three station's temporal trajectories are also highly correlated, as the barchart below shows.
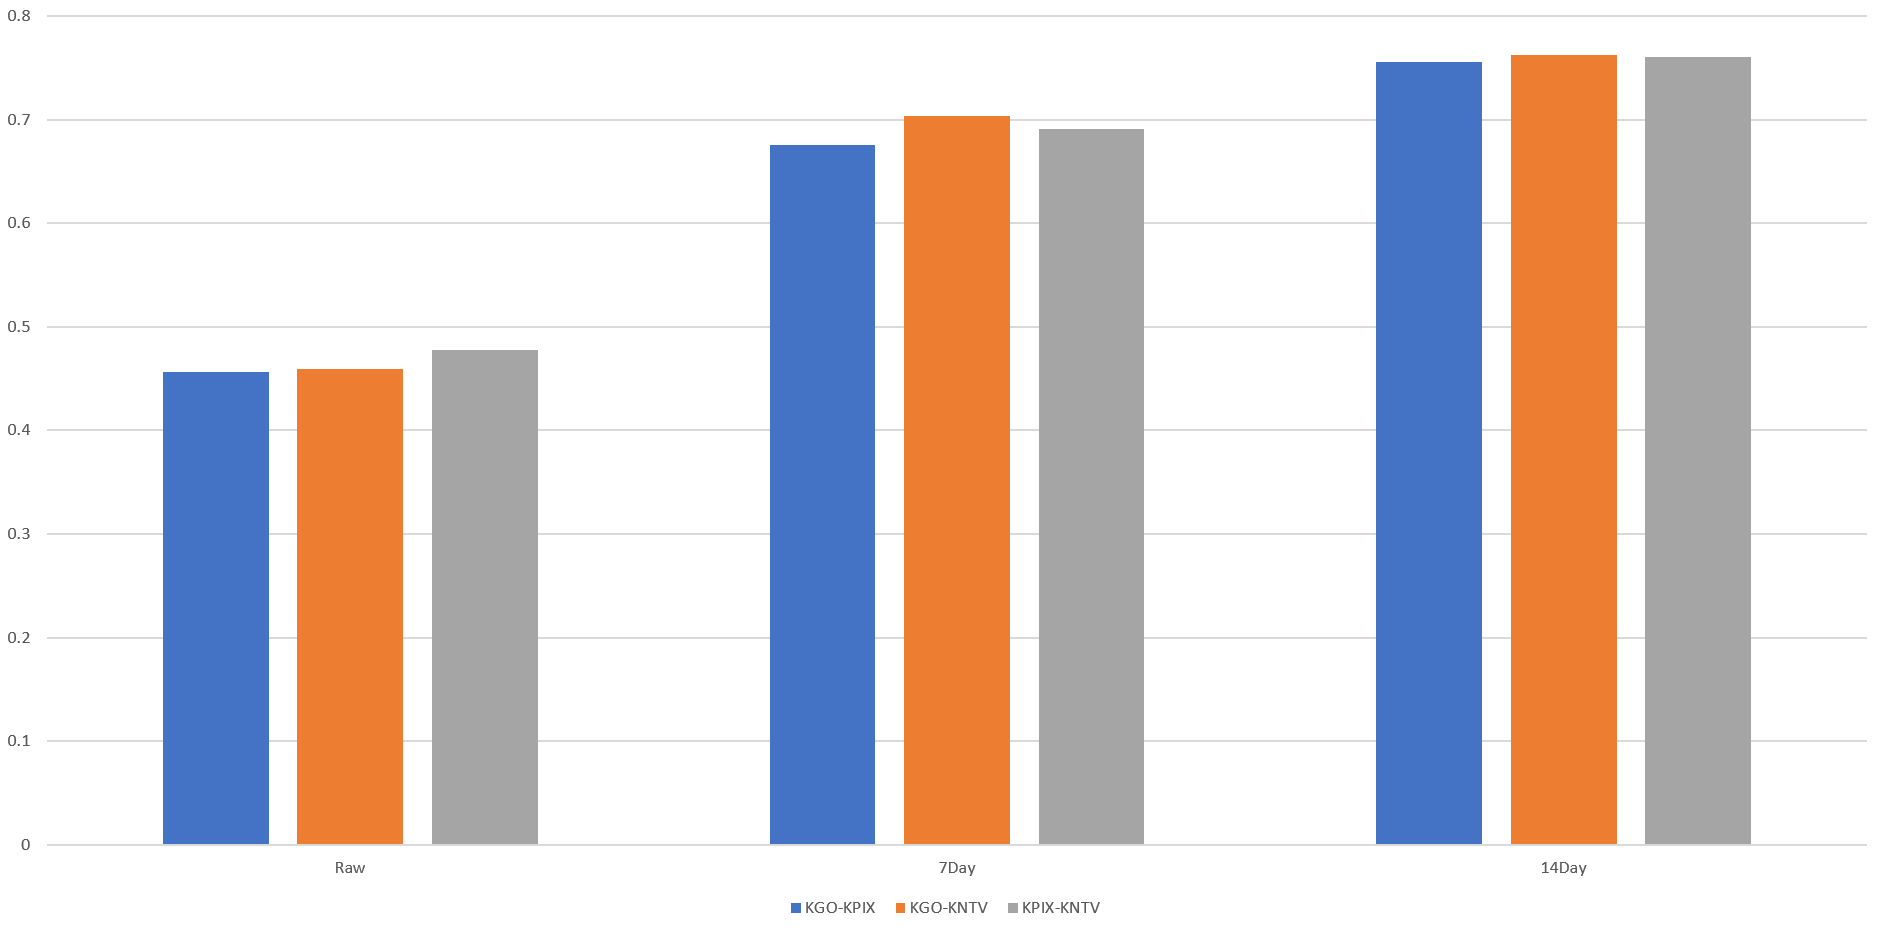
Using the raw daily data, all three stations are correlated against one another almost identically at around r=0.46, while with 7 day smoothing that increases to around r=0.69 and r=0.76 for 14 day smoothing. The fact that all three stations are correlated similarly reinforces the hypothesis that in terms of macro-level visual representation, viewers receive the same exposure to police imagery regardless of which of the three stations they tune into.
TECHNICAL DETAILS
Creating the graphs above required a single SQL query in BigQuery. While the code below is long, it is actually a very simplistic query, composed of a set of three queries summing the amount of airtime of police on each of the three stations and a set of three queries summing the total airtime on those three stations and then a master query that divides the latter by the former to compute the total percent by day. The "DATE(date, "America/Los_Angeles")" command converts the timestamps that record time to the resolution of seconds to a day-level date stamp and converts from the dataset's native UTC timezone into PST, since the broadcasts are monitored from the local San Francisco affiliates.
select DAY,
SUM(KGOEntitySeconds) KGOTotEntitySeconds, SUM(KGOAllSeconds) KGOTotAllSeconds, SAFE_DIVIDE(SUM(KGOEntitySeconds), SUM(KGOAllSeconds))*100 KGOPercEntityAirtime,
SUM(KPIXEntitySeconds) KPIXTotEntitySeconds, SUM(KPIXAllSeconds) KPIXTotAllSeconds, SAFE_DIVIDE(SUM(KPIXEntitySeconds), SUM(KPIXAllSeconds))*100 KPIXPercEntityAirtime,
SUM(KNTVEntitySeconds) KNTVTotEntitySeconds, SUM(KNTVAllSeconds) KNTVTotAllSeconds, SAFE_DIVIDE(SUM(KNTVEntitySeconds), SUM(KNTVAllSeconds))*100 KNTVPercEntityAirtime,
SUM(KGOEntitySeconds)+SUM(KPIXEntitySeconds)+SUM(KNTVEntitySeconds) TotEntitySeconds, SUM(KGOAllSeconds)+SUM(KPIXAllSeconds)+SUM(KNTVAllSeconds) TotAllSeconds, SAFE_DIVIDE((SUM(KGOEntitySeconds)+SUM(KPIXEntitySeconds)+SUM(KNTVEntitySeconds)), (SUM(KGOAllSeconds)+SUM(KPIXAllSeconds)+SUM(KNTVAllSeconds)))*100 PercEntityAirtime
 from (
SELECT DATE(date, "America/Los_Angeles") DAY, count(1) KGOEntitySeconds, 0 KGOAllSeconds, 0 KPIXEntitySeconds, 0 KPIXAllSeconds, 0 KNTVEntitySeconds, 0 KNTVAllSeconds FROM `gdelt-bq.gdeltv2.vgegv2_iatv`,UNNEST(entities) AS entity where entity.name='police' and station='KGO' group by DAY
UNION ALL
SELECT DATE(date, "America/Los_Angeles") DAY, 0 KGOEntitySeconds, 0 KGOAllSeconds, count(1) KPIXEntitySeconds, 0 KPIXAllSeconds, 0 KNTVEntitySeconds, 0 KNTVAllSeconds FROM `gdelt-bq.gdeltv2.vgegv2_iatv`,UNNEST(entities) AS entity where entity.name='police' and station='KPIX' group by DAY
UNION ALL
SELECT DATE(date, "America/Los_Angeles") DAY, 0 KGOEntitySeconds, 0 KGOAllSeconds, 0 KPIXEntitySeconds, 0 KPIXAllSeconds, count(1) KNTVEntitySeconds, 0 KNTVAllSeconds FROM `gdelt-bq.gdeltv2.vgegv2_iatv`,UNNEST(entities) AS entity where entity.name='police' and station='KNTV' group by DAY
UNION ALL
SELECT DATE(date, "America/Los_Angeles") DAY, 0 KGOEntitySeconds, count(1) KGOAllSeconds, 0 KPIXEntitySeconds, 0 KPIXAllSeconds, 0 KNTVEntitySeconds, 0 KNTVAllSeconds FROM `gdelt-bq.gdeltv2.vgegv2_iatv` where station='KGO' group by DAY
UNION ALL
SELECT DATE(date, "America/Los_Angeles") DAY, 0 KGOEntitySeconds, 0 KGOAllSeconds, 0 KPIXEntitySeconds, count(1) KPIXAllSeconds, 0 KNTVEntitySeconds, 0 KNTVAllSeconds FROM `gdelt-bq.gdeltv2.vgegv2_iatv` where station='KPIX' group by DAY
UNION ALL
SELECT DATE(date, "America/Los_Angeles") DAY, 0 KGOEntitySeconds, 0 KGOAllSeconds, 0 KPIXEntitySeconds, 0 KPIXAllSeconds, 0 KNTVEntitySeconds, count(1) KNTVAllSeconds FROM `gdelt-bq.gdeltv2.vgegv2_iatv` where station='KNTV' group by DAY
) group by DAY order by DAY asc
A single query is all that's required to track how often police have been depicted over the past decade on the evening television news! That's pretty incredible.