The TV 2.0 API makes it possible to conduct advanced analytics over more than a decade of television news programming spanning 150 stations in all, using data from the Internet Archive's Television News Archive. One of the most common use cases is exploring how coverage of a topic differs across television stations. However, many television news stations are not monolithic 24/7 news shows – they break up that programming with numerous "analysis", opinion and personality-driven shows. This means it can often be useful to understand whether specific shows are driving coverage of a particular topic.
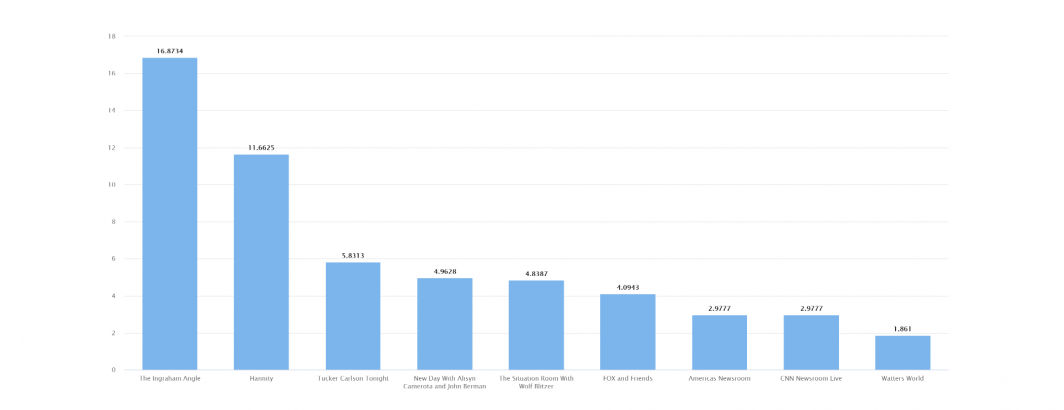
Towards this end we are excited to announce today that the TV 2.0 API now supports a new "showchart" mode that outputs a show breakdown like seen above showing the top 10 shows matching the search criteria. In JSON and CSV mode, the top 500 shows are returned.
Unlike the other TV 2.0 API results, which display precise calculations, the new "showchart" mode represents an estimate. The top 500 shows are retrieved and are displayed as a percentage of the total mentions across those 500 shows. In practice, the top 500 shows mentioning a given topic typically represent the majority of its mentions, but for more evenly spread topics this may result in an over or undercount.
When interpreting these results remember that some shows have much greater airtime per day than others or may air only certain days or once or twice a week, so comparisons of shows should always take into consideration how often each show airs and its total airtime per day over the analysis period.