Over the past decade Google Earth has been a mainstay of American television news, helping audiences understand the geographic context of the stories defining each day. Using Google's Cloud Video API to watch a decade of evening news broadcasts on ABC, CBS and NBC, can we trace exactly how often Google Earth's imagery has appeared in the news?
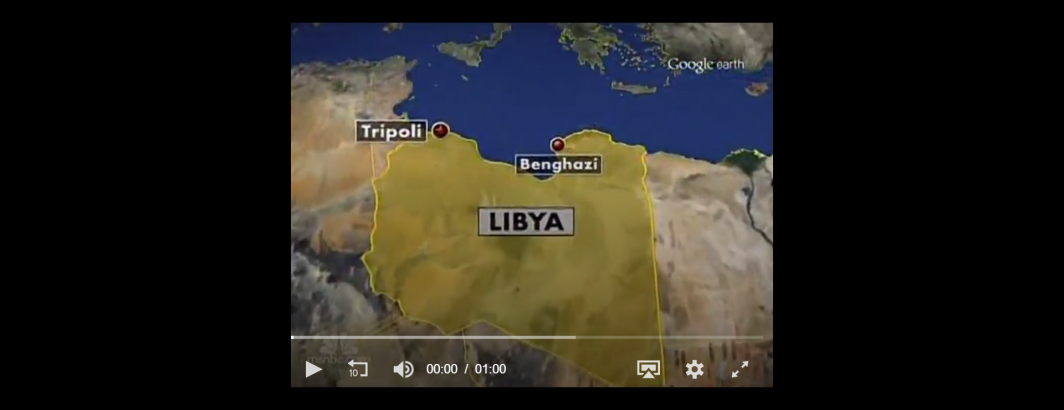
How might we reliably identify Google Earth imagery in news broadcasts? It turns out that broadcast use of Google Earth always carries the "Google Earth" logo at the top right of the footage, meaning the Cloud Video API's OCR capability can be used to search for all airtime containing the onscreen text "Google Earth" during the 2010-2020 period to identify the majority of this footage.
Using the Visual Global Entity Graph 2.0 and BigQuery it takes just a single query and a few seconds to yield the final answer: in all, ABC, CBS and NBC used Google Earth footage for 19,277 seconds (321 minutes / 5.4 hours) of airtime through this past Sunday. ABC relied upon it the most, totaling 9,419 seconds of airtime, followed by NBC with 7,841 seconds and CBS with 2,017 seconds, as seen in the chart below.

For those broadcasts that did rely upon Google Earth, the median usage on ABC was 10.2 seconds, followed by 9.4 seconds on NBC and 7.7 seconds on CBS. While they varied on how much they used Google Earth imagery, when they did turn to it to illustrate a story, all three displayed it onscreen for similar amounts of time.
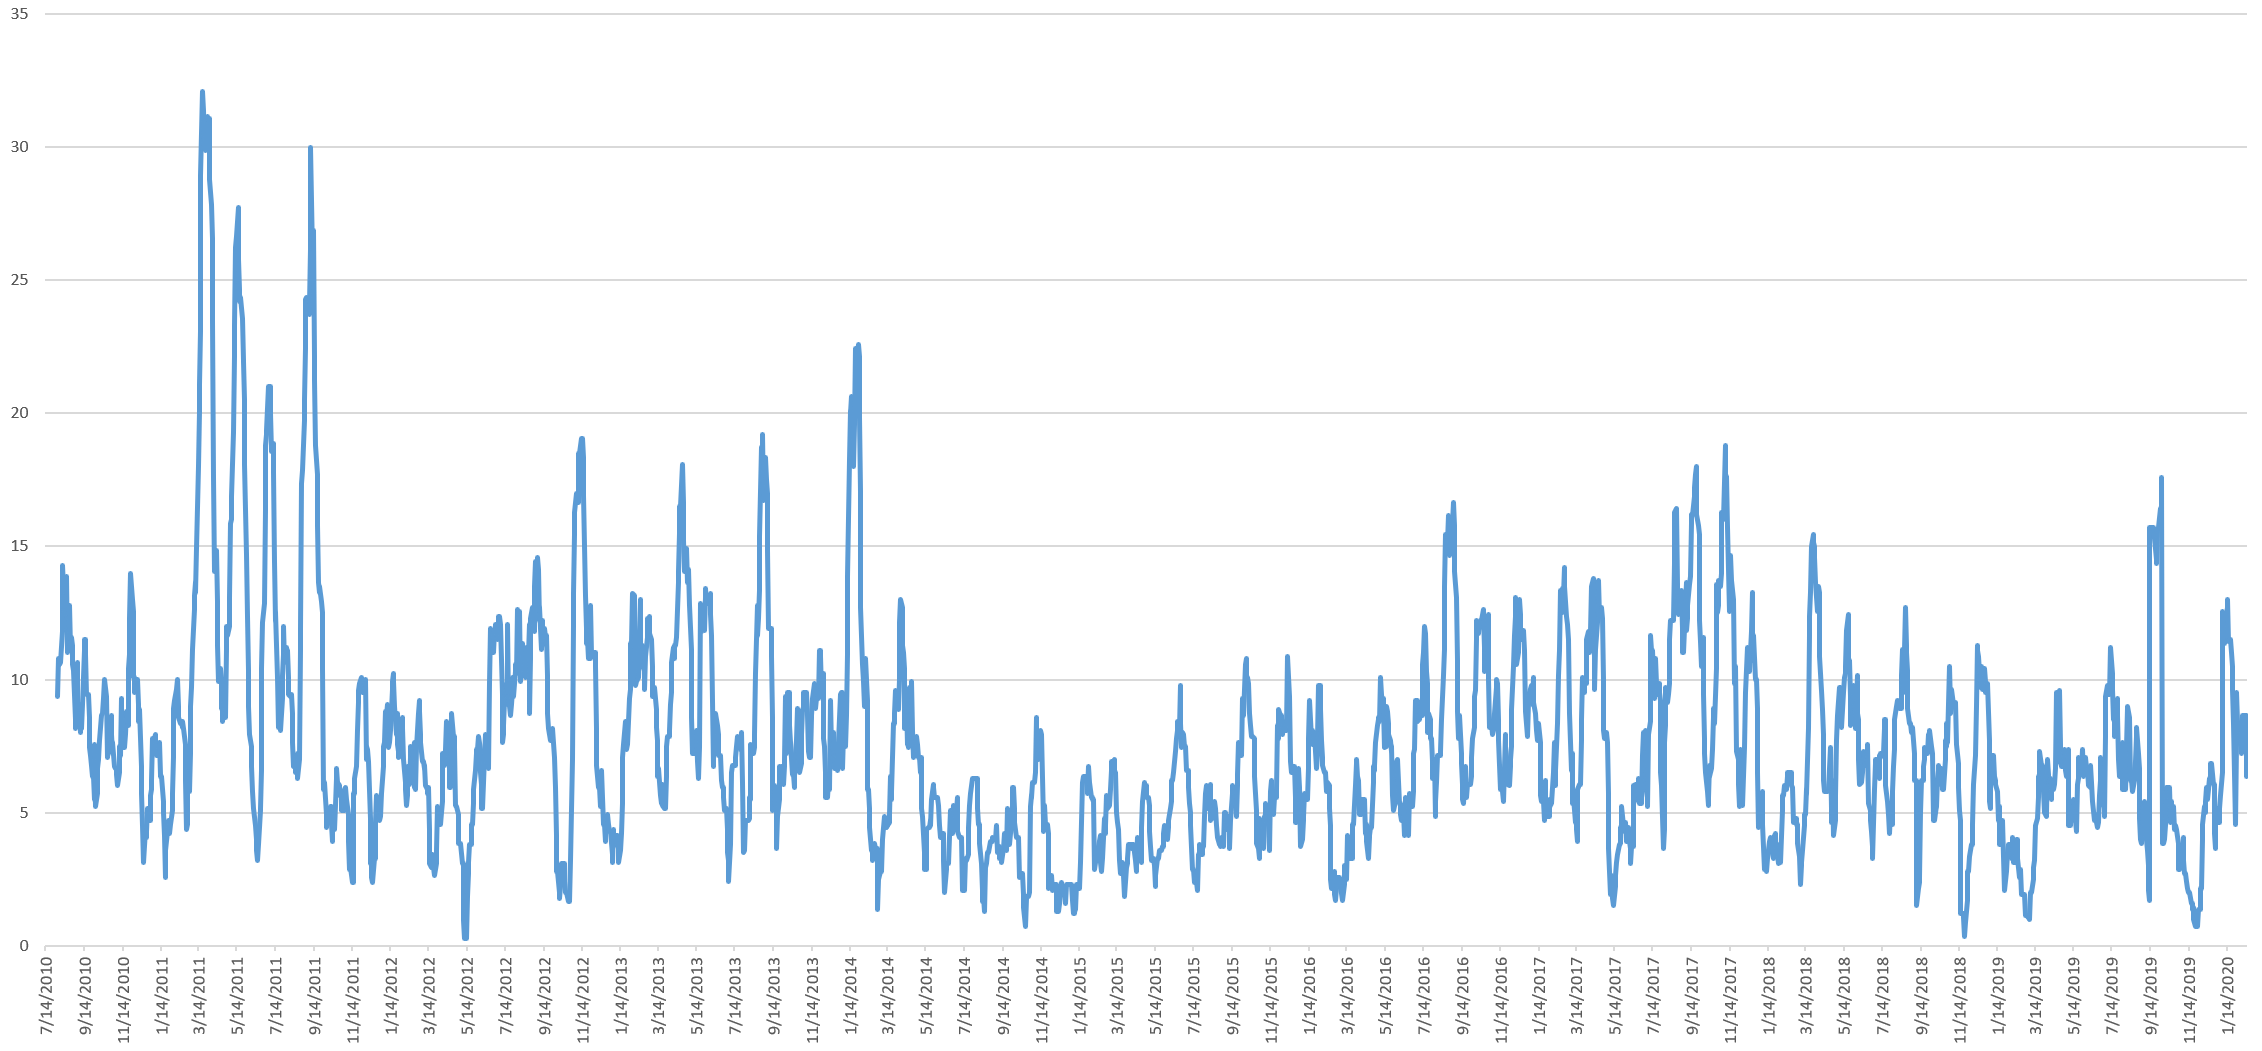
How has this usage varied over time? The timeline below shows the total airtime per day across the three networks, using a rolling 14 day average. The 2011 Arab Spring yielded heavy use of it each evening, with increasing usage over 2013 as well. From 2014 through the end of 2017, usage ramped up again, followed by spikes in late 2019 and again last month.
Interestingly, simply by tracing the timeline below, one can get a sense of how many of the day's biggest stories each day over the past decade were international.
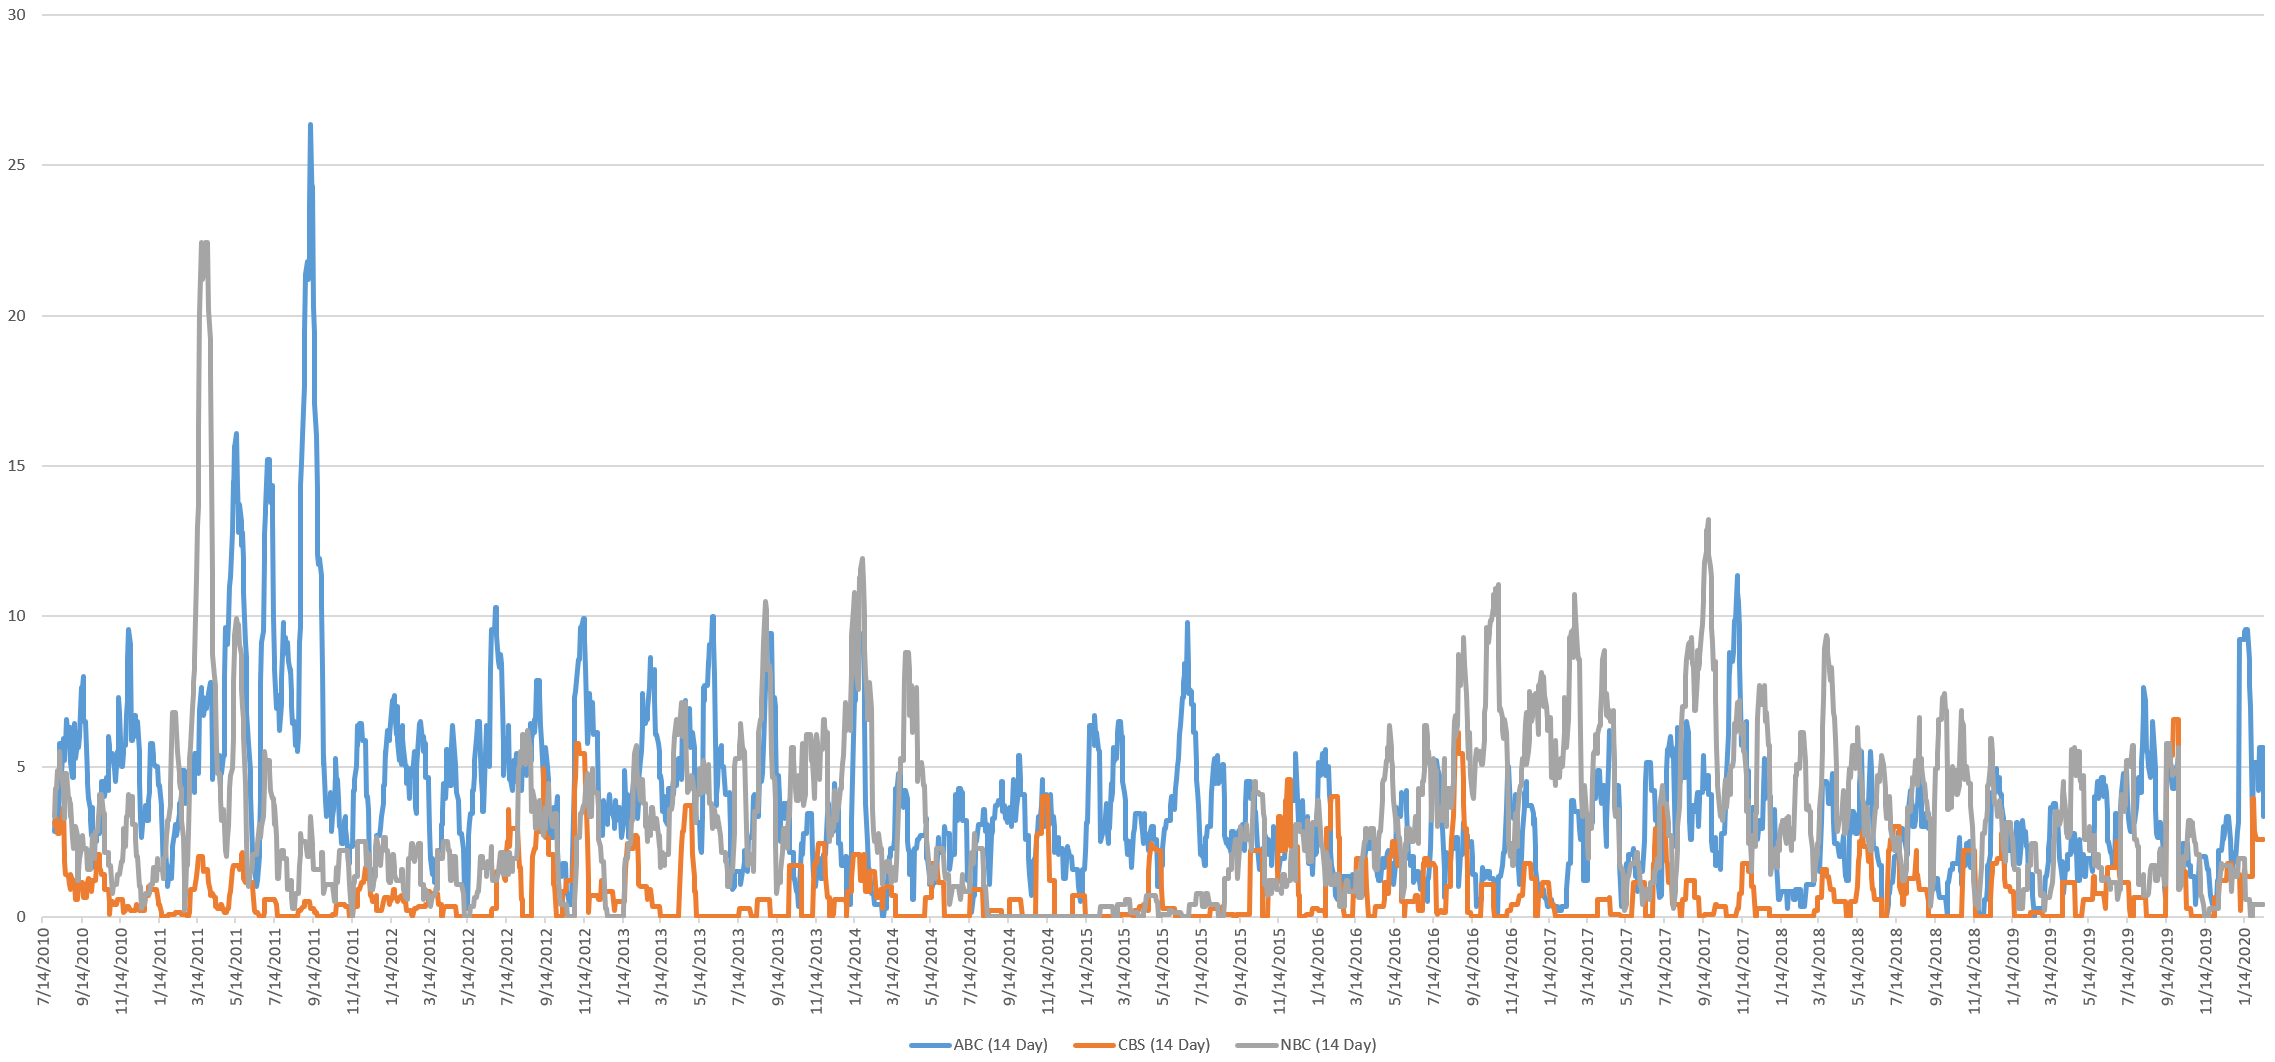
Breaking this timeline down by network, we can see that for some stories all three networks deploy it, but that in the general case, each network tends to use it at different times for different stories, reflecting the intrinsic differences in the stories they cover.
In the end, using Google's Cloud Video API we were able to watch a decade of evening television news broadcasts and track their usage of Google Earth 2010-2020. While OCR error may impact the results above, they should cover the majority of Google Earth broadcast footage on the three networks.
For those interested in building upon these results, the complete underlying dataset is available for download.
TECHNICAL DETAILS
To create the graphs above, we used the same query as we did for tracking onscreen display of President Trump's tweets:
select DATE, SUM(KGO) KGO, SUM(KPIX) KPIX, SUM(KNTV) KNTV, SUM(KGO)+SUM(KPIX)+SUM(KNTV) Total, SUM(KGOAll) KGOAll, SUM(KPIXAll) KPIXAll, SUM(KNTVAll) KNTVAll, SUM(KGOAll)+SUM(KPIXAll)+SUM(KNTVAll) TotalAll from (
 (SELECT DATE(date, "America/Los_Angeles") DATE, count(1) KGO, 0 KPIX, 0 KNTV, 0 KGOAll, 0 KPIXAll, 0 KNTVAll FROM `gdelt-bq.gdeltv2.vgegv2_iatv` WHERE station='KGO' and LOWER(OCRText) like '%google earth%' and EXTRACT(DAYOFWEEK from DATE(date, "America/Los_Angeles")) >= 2 and EXTRACT(DAYOFWEEK from DATE(date, "America/Los_Angeles")) <= 6 group by DATE)
UNION ALL
 (SELECT DATE(date, "America/Los_Angeles") DATE, 0 KGO, count(1) KPIX, 0 KNTV, 0 KGOAll, 0 KPIXAll, 0 KNTVAll FROM `gdelt-bq.gdeltv2.vgegv2_iatv` WHERE station='KPIX' and LOWER(OCRText) like '%google earth%' and EXTRACT(DAYOFWEEK from DATE(date, "America/Los_Angeles")) >= 2 and EXTRACT(DAYOFWEEK from DATE(date, "America/Los_Angeles")) <= 6 group by DATE)
UNION ALL
 (SELECT DATE(date, "America/Los_Angeles") DATE, 0 KGO, 0 KPIX, count(1) KNTV, 0 KGOAll, 0 KPIXAll, 0 KNTVAll FROM `gdelt-bq.gdeltv2.vgegv2_iatv` WHERE station='KNTV' and LOWER(OCRText) like '%google earth%' and EXTRACT(DAYOFWEEK from DATE(date, "America/Los_Angeles")) >= 2 and EXTRACT(DAYOFWEEK from DATE(date, "America/Los_Angeles")) <= 6 group by DATE)
UNION ALL
 (SELECT DATE(date, "America/Los_Angeles") DATE, 0 KGO, 0 KPIX, 0 KNTV, count(1) KGOAll, 0 KPIXAll, 0 KNTVAll FROM `gdelt-bq.gdeltv2.vgegv2_iatv` WHERE station='KGO' and EXTRACT(DAYOFWEEK from DATE(date, "America/Los_Angeles")) >= 2 and EXTRACT(DAYOFWEEK from DATE(date, "America/Los_Angeles")) <= 6 group by DATE)
UNION ALL
 (SELECT DATE(date, "America/Los_Angeles") DATE, 0 KGO, 0 KPIX, 0 KNTV, 0 KGOAll, count(1) KPIXAll, 0 KNTVAll FROM `gdelt-bq.gdeltv2.vgegv2_iatv` WHERE station='KPIX' and EXTRACT(DAYOFWEEK from DATE(date, "America/Los_Angeles")) >= 2 and EXTRACT(DAYOFWEEK from DATE(date, "America/Los_Angeles")) <= 6 group by DATE)
UNION ALL
 (SELECT DATE(date, "America/Los_Angeles") DATE, 0 KGO, 0 KPIX, 0 KNTV, 0 KGOAll, 0 KPIXAll, count(1) KNTVAll FROM `gdelt-bq.gdeltv2.vgegv2_iatv` WHERE station='KNTV' and EXTRACT(DAYOFWEEK from DATE(date, "America/Los_Angeles")) >= 2 and EXTRACT(DAYOFWEEK from DATE(date, "America/Los_Angeles")) <= 6 group by DATE)
) GROUP BY DATE order by DATE asc
We're tremendously excited to see what kinds of new analyses you're able to do, using this analysis as a template!