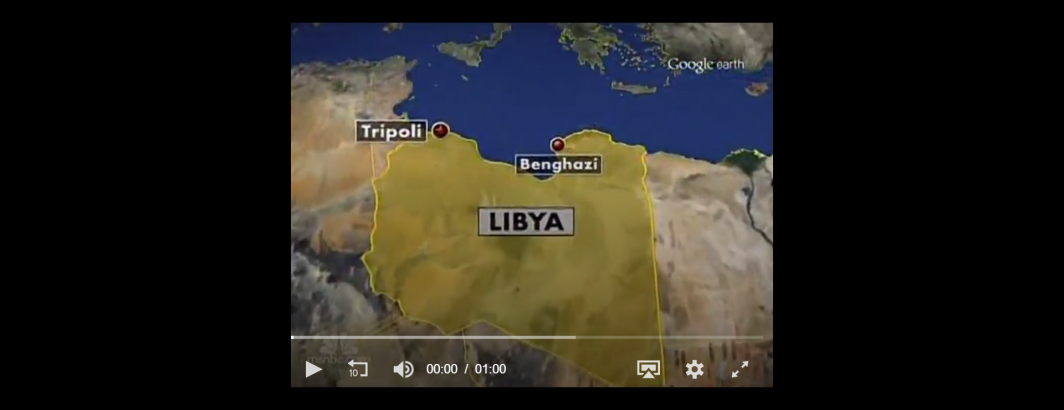
Following up on our analysis from earlier today tracking television news appearances of Google Earth, we've released the underlying CSV dataset to allow researchers to explore in more detail what global locations these Google Earth maps focused on and the kinds of stories they were used to illustrate. The dataset has 26,161 rows, one for each second of airtime that depicted Google Earth (in addition to ABC, CBS and NBC weekday evening news broadcasts it also includes weekend broadcasts and CNN broadcasts since the end of last month). If Google Earth appeared for 10 seconds during a broadcast, it will appear as 10 rows in this dataset.
Each row has eight columns: "date" (the date and time of the broadcast), "iaShowId" (the Television News Archive's unique ID for the broadcast), "station" (the station the broadcast aired on), "showName" (the name of the show), "iaClipUrl" (a URL to preview a one-minute clip beginning with the given second of airtime), "iaThumbnailUrl" (a preview thumbnail of the given second of airtime), "OCRText" (the complete OCR results of all onscreen text) and "VisualEntities" (a comma-separated list of all of the visual entities Cloud Video API detected in the given second of airtime).
- Download The Complete Dataset. (16MB)
TECHNICAL DETAILS
Constructing this spreadsheet took just a single query in BigQuery. Visual entities are stored in an array of structs, so the "ARRAY_TO_STRING(ARRAY((select name from unnest(entities))), ", ")" code is used to flatten it to a comma-delimited list:
SELECT date,iaShowId,station,showName, iaClipUrl, iaThumbnailUrl, OCRText, ARRAY_TO_STRING(ARRAY((select name from unnest(entities))), ", ") VisualEntities FROM `gdelt-bq.gdeltv2.vgegv2_iatv` WHERE LOWER(OCRText) like '%google earth%' order by DATE(date), iaShowId, date