This study coauthored with Gabriel Thoumi uses data from Bloomberg and other financial databases, a set of PERL scripts and Gephi to visualize the board membership and shareholder networks of the Southeast Asian palm oil and agricultural industry. Two interactive network visualizations allow you to drill down and understand the web of connections governing the sector. While the use of network visualizations to understand board interlocks has a long and storied history, the streamlined process introduced in this study offers a ready-made template for others seeking to understand the complex web of overlapping connections that make up the fabric of modern industry.
Read The Full Article.
See The Republished Version On Seeking Alpha.
See The Republished Version On City A.M.
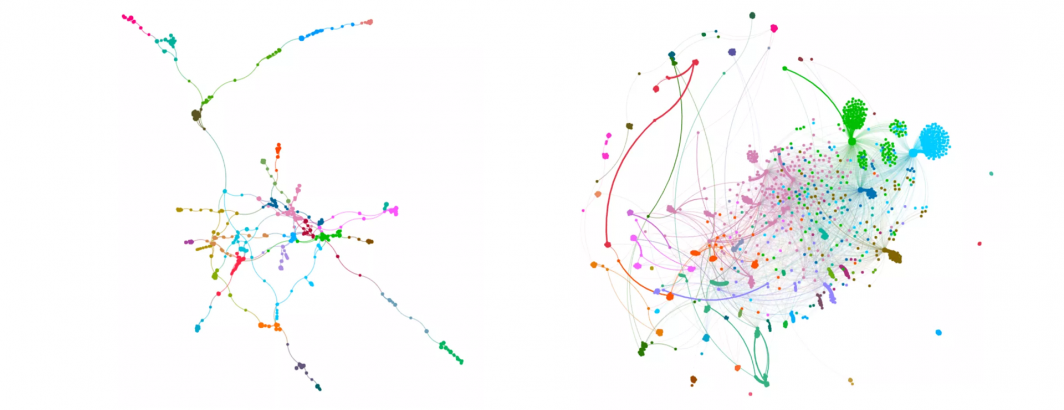
Visualization #1 – Board Interlocks
Visualization #2 – Shareholders Network