Two years ago Pennsylvania State University doctoral student John Beieler put together an animated map of global protests over the last quarter-century using the very first release of the GDELT Event Database. The map was widely covered and was even featured as the Chart of the Day by National Journal. Fast forward to today and GDELT has come a long way from that first prototype map, as has the technology behind these live animated maps, so we've decided to revisit mapping global protests!
Without further ado, here is the new global map of worldwide protests captured by GDELT from January 1979 through May 2015, visualizing 36 years of global unrest in just 30 seconds. (Download As Animated GIF).
Immediately noticeable is the steady increase in the availability of global news media in digital form, with more and more of the world lighting up as local and regional media outlets providing high-resolution local coverage become available. The sharp exponential increase in protest activity towards the end of the 2000's represents the rise of web-based news with the debut and spread of services like Google News, in which even small rural news outlets moved to create websites and place more and more of their content online, providing ever-increasing resolution onto the world's protest activity.
The map below highlights the period from January 2010 through June 10, 2015, offering daily resolution, making it possible to discern far finer-grained patterns in the spread and diffusion of protest activity. (Download As Animated GIF).
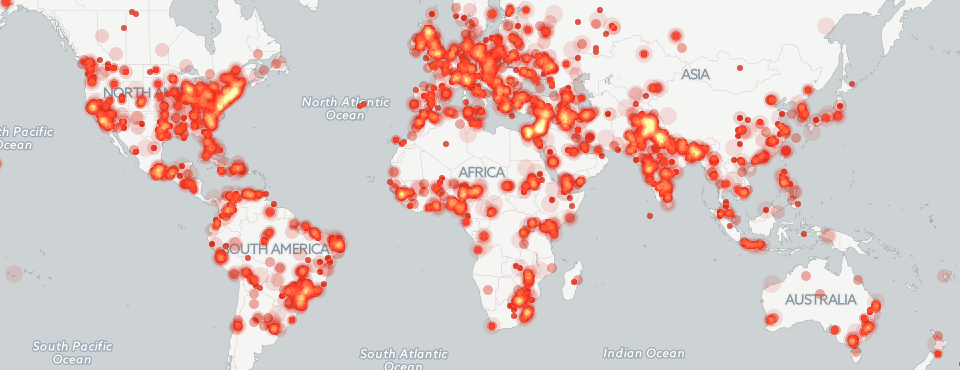
Finally, you will notice that some regions, such as Latin America, have far fewer recorded protests than other areas. This is because English-language news coverage of those areas tends to provide poorer geographic resolution and less local visibility. GDELT 2.0 addresses this through extremely an high-resolution local media catalog coupled with live machine translation of 65 languages. The map below showcases the much richer picture this offers, with considerably greater coverage of Latin American protests, covering the period February 19, 2015 (the debut of GDELT 2.0) through June 10, 2015 at daily resolution. (Download As Animated GIF).
For the technically minded, all three maps were created using the copy of GDELT 2.0 hosted in Google BigQuery. The SQL query used for the monthly map was:
SELECT substr(string(SQLDATE),0,6) as Date, ActionGeo_Lat as Lat, ActionGeo_Long as Long, sum(NumArticles) as NumEvents FROM [full.events] where EventRootCode='14' and ActionGeo_Type>1 and (abs(ActionGeo_Lat) > 0 or abs(ActionGeo_Long) > 0) and NumArticles>4 group by Date,Lat,Long
The substr() is used to chop the date down to monthly resolution (YYYYMM), EventRootCode='14' narrows to all protest-related events, ActionGeo_Type>1 excludes country-level matches (only matches for specific administrative divisions, cities, and individual buildings/landmarks are returned), the abs() checks filter out a handful of records with corrupt geographic data, and NumArticles>4 ensures that only those events for which the algorithms are highly confident in their identification are displayed (this reduces visibility of breaking events, but offers a reasonable filter). The results were imported into CartoDB as a CSV file and the layer SQL adjusted from "SELECT *" to "SELECT *, to_date(date::varchar(255), 'YYYYMM') as eventdate", which recasts the YYYYMM-format date column into an SQL date that CartoDB understands to use with Torque.
The SQL query for the daily map is nearly identical, but removes the substr() on the date field, and adds an additional filter to only return records from 2010 or later (otherwise there are too many records for a single CartoDB table):
SELECT SQLDATE as Date, ActionGeo_Lat as Lat, ActionGeo_Long as Long, sum(NumArticles) as NumEvents FROM [full.events] where EventRootCode='14' and ActionGeo_Type>1 and (abs(ActionGeo_Lat) > 0 or abs(ActionGeo_Long) > 0) and NumArticles>4 and SQLDATE>20100000 group by Date,Lat,Long
The results were again imported into CartoDB as a CSV file and the layer SQL adjusted from "SELECT *" to "SELECT *, to_date(date::varchar(255), 'YYYYMMDD') as eventdate", which recasts the YYYYMMDD-format date column into an SQL date that CartoDB understands to use with Torque. NOTE the addition of the extra "DD" at the end of the cast, since this time we included the day information, whereas with the previous map we excluded it to make a monthly map.
The daily GDELT 2.0 map is essentially identical to the GDELT 1.0 daily map:
SELECT SQLDATE as Date, ActionGeo_Lat as Lat, ActionGeo_Long as Long, sum(NumArticles) as NumEvents FROM [gdeltv2.events] where EventRootCode='14' and ActionGeo_Type>1 and (abs(ActionGeo_Lat) > 0 or abs(ActionGeo_Long) > 0) and NumArticles>4 and SQLDATE>20150219 and SQLDATE<20150611 group by Date,Lat,Long
Finally, for the adventurous who are interested in using the translation language information of GDELT 2.0 to create maps of protests recorded in specific languages, you can use JOIN EACH in BigQuery to join the GDELT 2.0 Events table against its paired EventMentions table as follows (this query selects all protests reported in Arabic-language media):
SELECT events.SQLDATE as Date, events.ActionGeo_Lat as Lat, events.ActionGeo_Long as Long FROM [gdeltv2.events] as events JOIN EACH [gdeltv2.eventmentions] as eventmentions on events.GLOBALEVENTID = eventmentions.GLOBALEVENTID where events.EventRootCode='14' and events.ActionGeo_Type>1 and (abs(events.ActionGeo_Lat) > 0 or abs(events.ActionGeo_Long) > 0) and events.NumArticles>4 and events.SQLDATE>20150219 and events.SQLDATE<20150611 and eventmentions.MentionDocTranslationInfo like 'srclc:ara;%' group by Date,Lat,Long
Happy Mapping!