Using the new Global Similarity Graph, a single SQL query can visualize story overlap between news outlets using BigQuery + Gephi. The query below takes a single day (July 2, 2021) and compiles the root domain name of each article (so every CNN article becomes "cnn.com"), normalizes the ordering of domains (so CNN->WashPost is the same as WashPost->CNN) and computes the average similarity of all similar articles between each pair of domains, limiting itself to just those domains that had more than five similar stories. Note that this only counts similar articles, so two domains that shared only six highly similar stories out of 1,000 articles they collectively published that day would be ranked higher here than two domains that shared almost all of their stories that day, but whose stories were only 50% similar on average. In other words, this only looks at similar article overlap rather than the total output of each pair of domains, though you could do so by incorporating a baseline from the GKG.
The final SQL query is:
select Source, Target, "Undirected" Type, avg(simScore) Weight from (
  select IF(fromDomain<toDomain, fromDomain, toDomain) Source, IF(fromDomain<toDomain, toDomain, fromDomain) Target, simScore from (
    SELECT NET.REG_DOMAIN(fromUrl) fromDomain, NET.REG_DOMAIN(toUrl) toDomain, simScore FROM `gdelt-bq.gdeltv2.gsg` WHERE NET.REG_DOMAIN(fromUrl) != NET.REG_DOMAIN(toUrl) and DATE(fromDate) = "2021-07-02"
  )
) group by Source, Target having count(1) > 5 order by Weight desc limit 10000
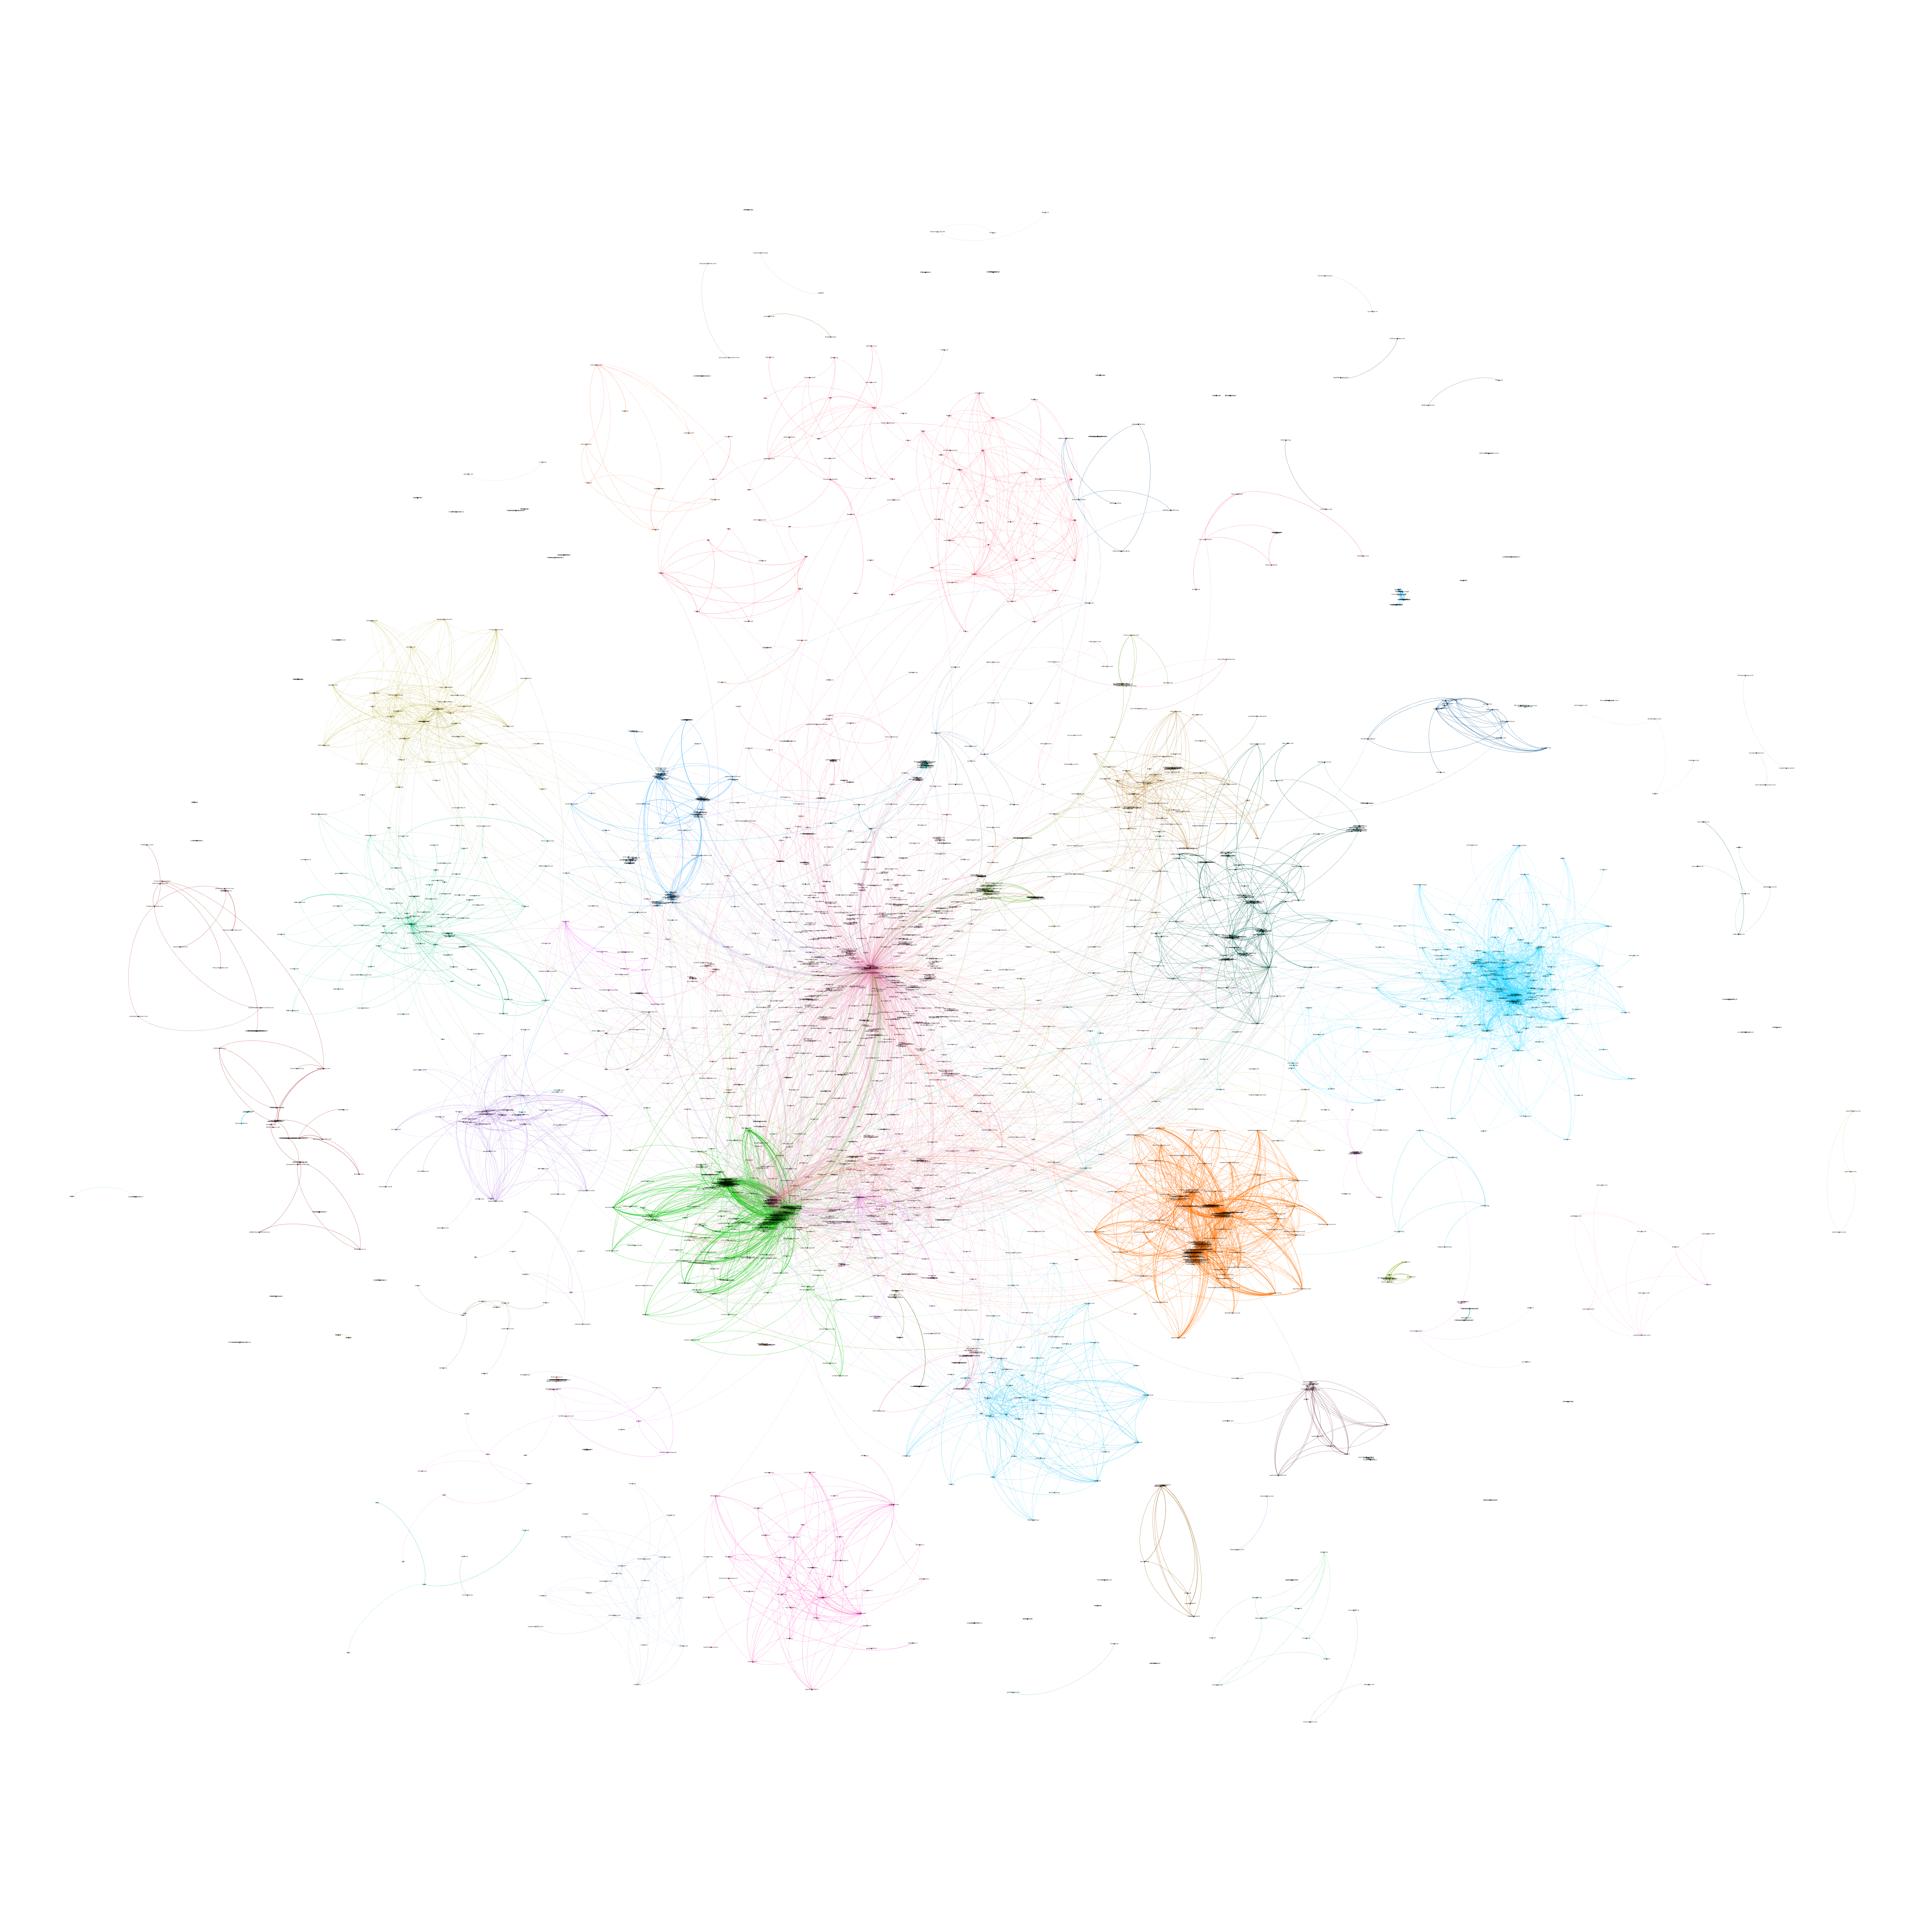
Loading this into Gephi yields the following image. You can also download the graph as a searchable PDF file. Hopefully even this simplistic analysis inspires you to your own analyses!