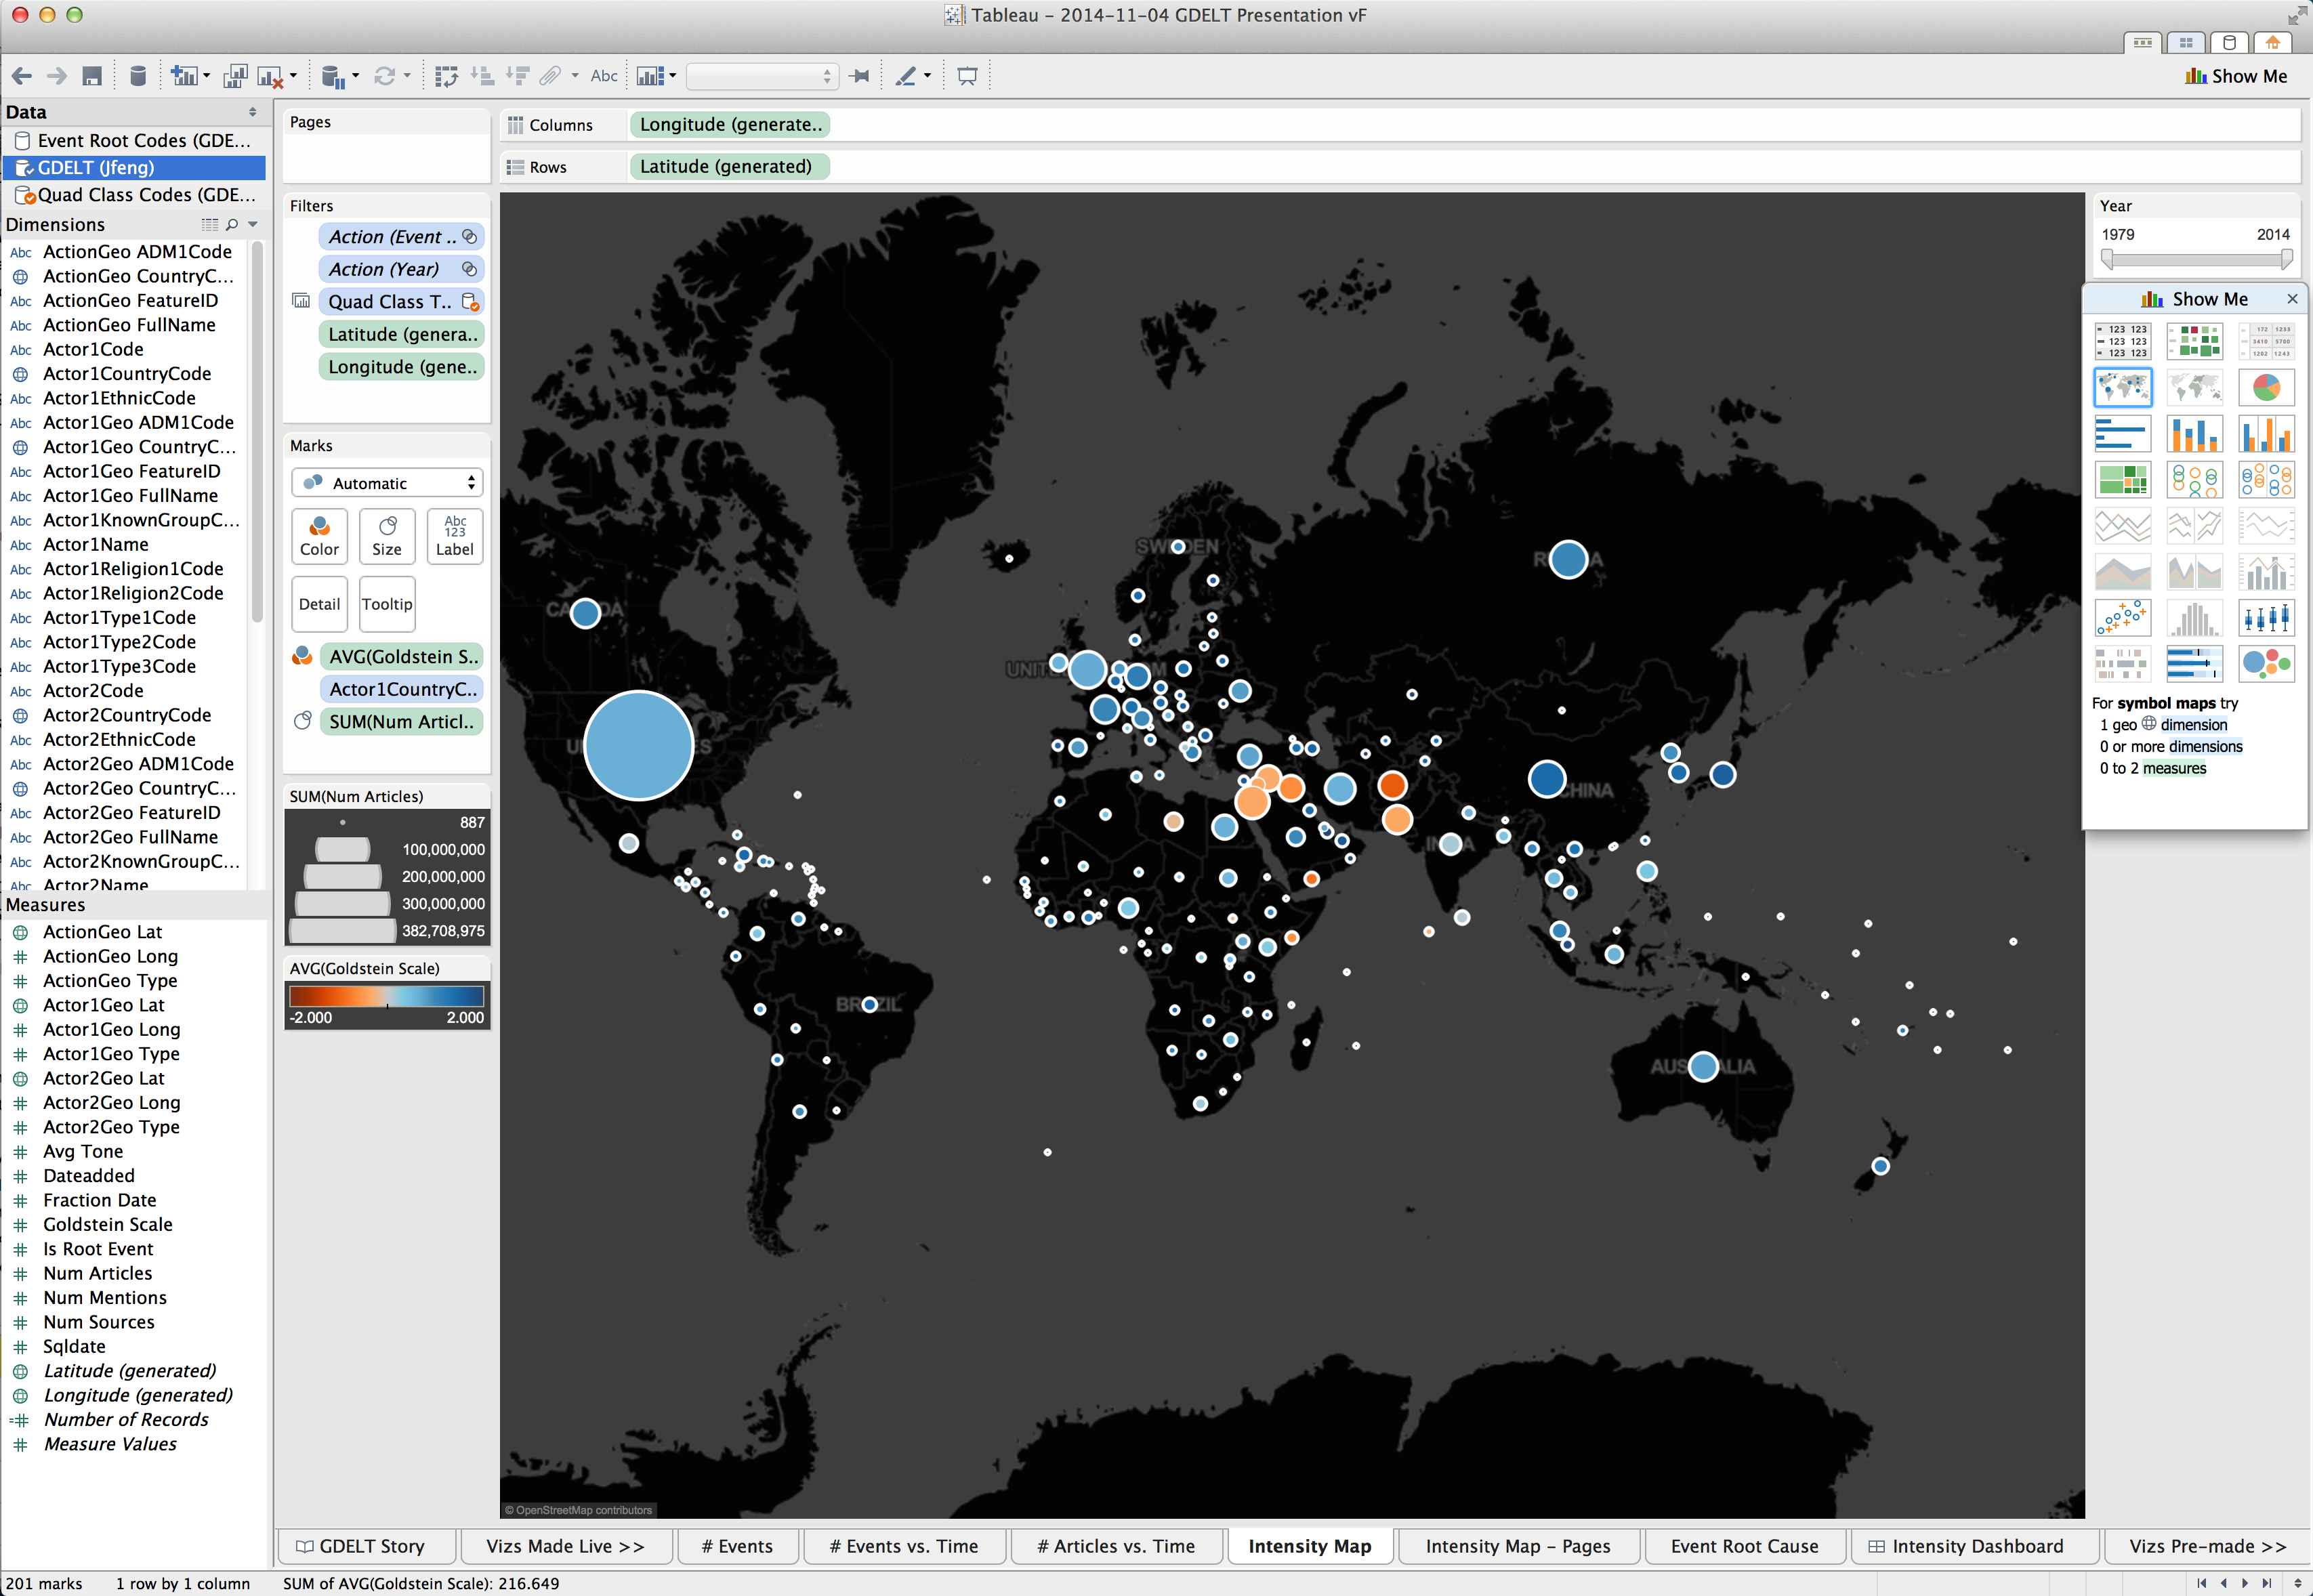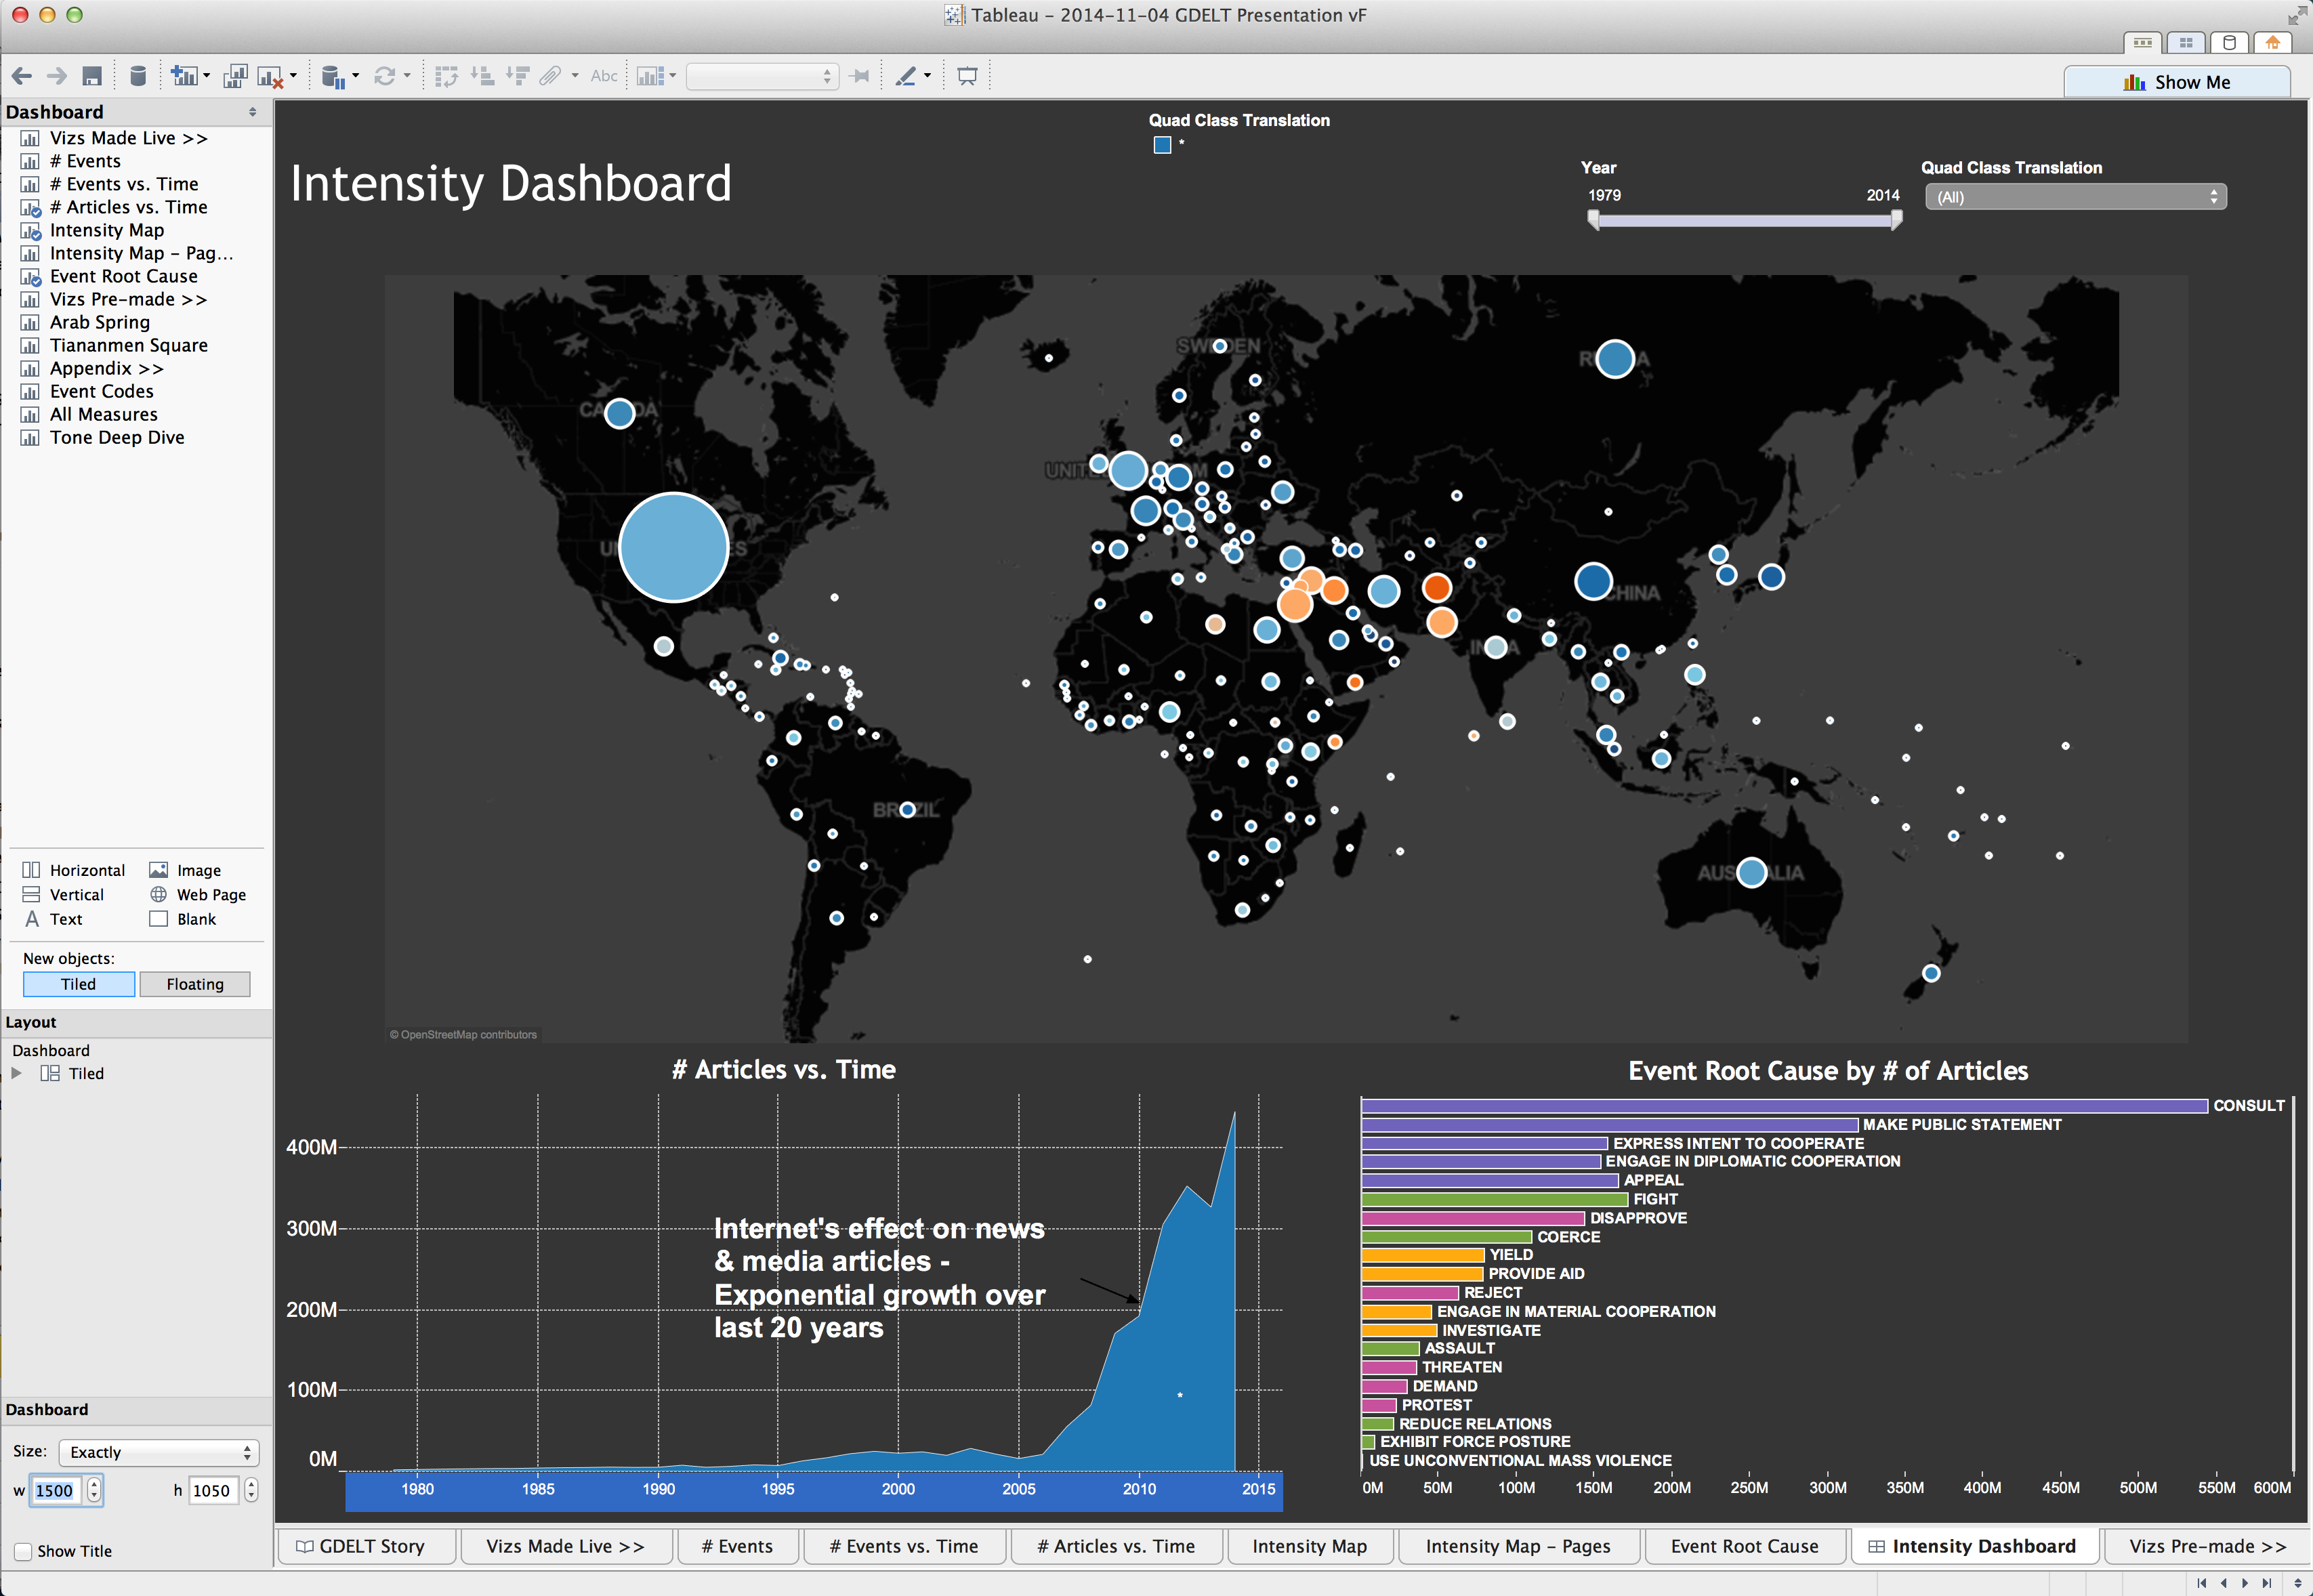
The latest version of Tableau offers direct integration with Google BigQuery, meaning you can leverage Tableau's incredibly powerful point-and-click visual analytics platform to directly query, analyze, and visualize GDELT without needing to write a single line of code! This past May we announced that GDELT is available inside of Google's BigQuery massive big data platform and over the past seven months we've used it for everything from mapping violence in Nigeria to visualizing protests in Ukraine to charting global protest activity to exploring the underlying patterns of world history. Each of these analyses leveraged the enormous power of BigQuery to offer near-realtime exploration and mass analytics over the entire 275-million record database, yet they still required substantial knowledge and familiarity with SQL to formulate the underlying queries. Enter Tableau.
Tableau's point-and-click graphical analytics platform means you can now leverage the enormous power of BigQuery without having to actually write any code, receiving the results back as beautiful visualizations. The video and screen captures offer a small glimpse into the enormous power of this combination!