What might explain the profound change in the readability of television news coverage over the past decade? As the timeline below shows, readability scores for television news exhibit a marked shift beginning in early 2013.
Using the Television News Ngram 2.0 Dataset we can dive more deeply into underlying linguistic shifts in closed captioning. The following query computes a number of statistics:
select day,
(select sum(COUNT) FROM `gdelt-bq.gdeltv2.iatv_1gramsv2` where STATION='CNN' and DATE(TIMESTAMP)=day) CNN_totwords,
(select sum(length(NGRAM)*COUNT) FROM `gdelt-bq.gdeltv2.iatv_1gramsv2` where STATION='CNN' and DATE(TIMESTAMP)=day) CNN_totchars,
(select count(distinct NGRAM) FROM `gdelt-bq.gdeltv2.iatv_1gramsv2` where STATION='CNN' and DATE(TIMESTAMP)=day) CNN_uniqwords,
(select sum(COUNT) FROM `gdelt-bq.gdeltv2.iatv_1gramsv2` where STATION='MSNBC' and DATE(TIMESTAMP)=day) MSNBC_totwords,
(select sum(length(NGRAM)*COUNT) FROM `gdelt-bq.gdeltv2.iatv_1gramsv2` where STATION='MSNBC' and DATE(TIMESTAMP)=day) MSNBC_totchars,
(select count(distinct NGRAM) FROM `gdelt-bq.gdeltv2.iatv_1gramsv2` where STATION='MSNBC' and DATE(TIMESTAMP)=day) MSNBC_uniqwords,
(select sum(COUNT) FROM `gdelt-bq.gdeltv2.iatv_1gramsv2` where STATION='FOXNEWS' and DATE(TIMESTAMP)=day) FOXNEWS_totwords,
(select sum(length(NGRAM)*COUNT) FROM `gdelt-bq.gdeltv2.iatv_1gramsv2` where STATION='FOXNEWS' and DATE(TIMESTAMP)=day) FOXNEWS_totchars,
(select count(distinct NGRAM) FROM `gdelt-bq.gdeltv2.iatv_1gramsv2` where STATION='FOXNEWS' and DATE(TIMESTAMP)=day) FOXNEWS_uniqwords
from (
SELECT DATE(TIMESTAMP) day FROM `gdelt-bq.gdeltv2.iatv_1gramsv2` group by day
) order by day
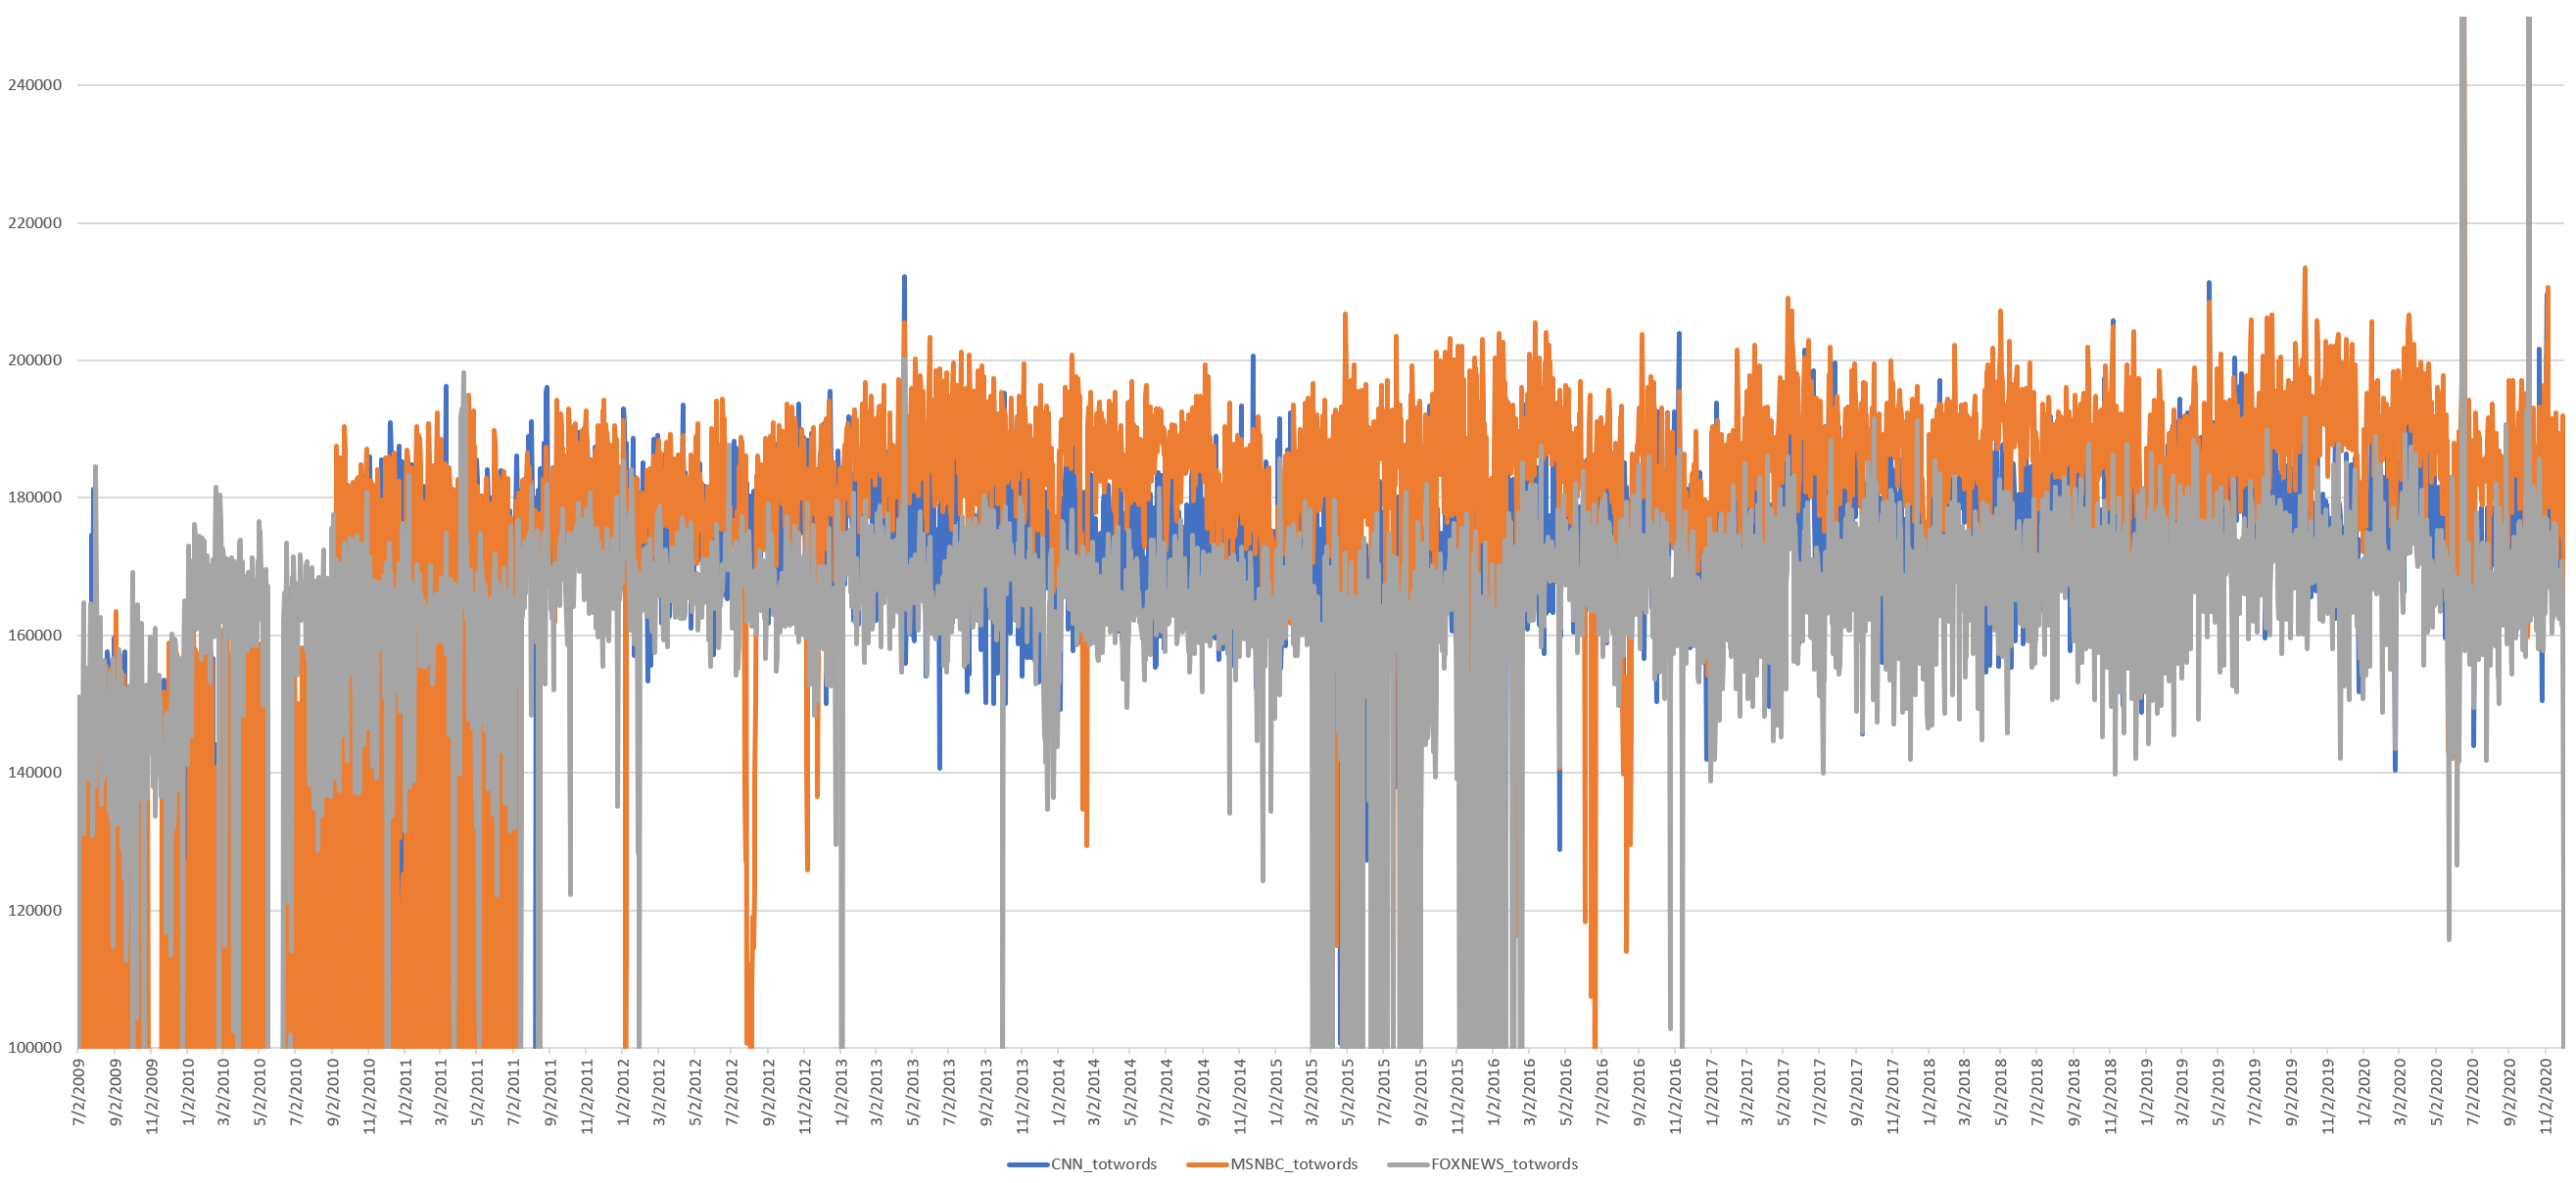
Has the total number of daily spoken words changed over the past decade? Other than some assorted periods of monitoring issues, the overall trend line is relatively flat, with no noticeable movement around the main period of readability change, suggesting the number of daily words hasn't changed.
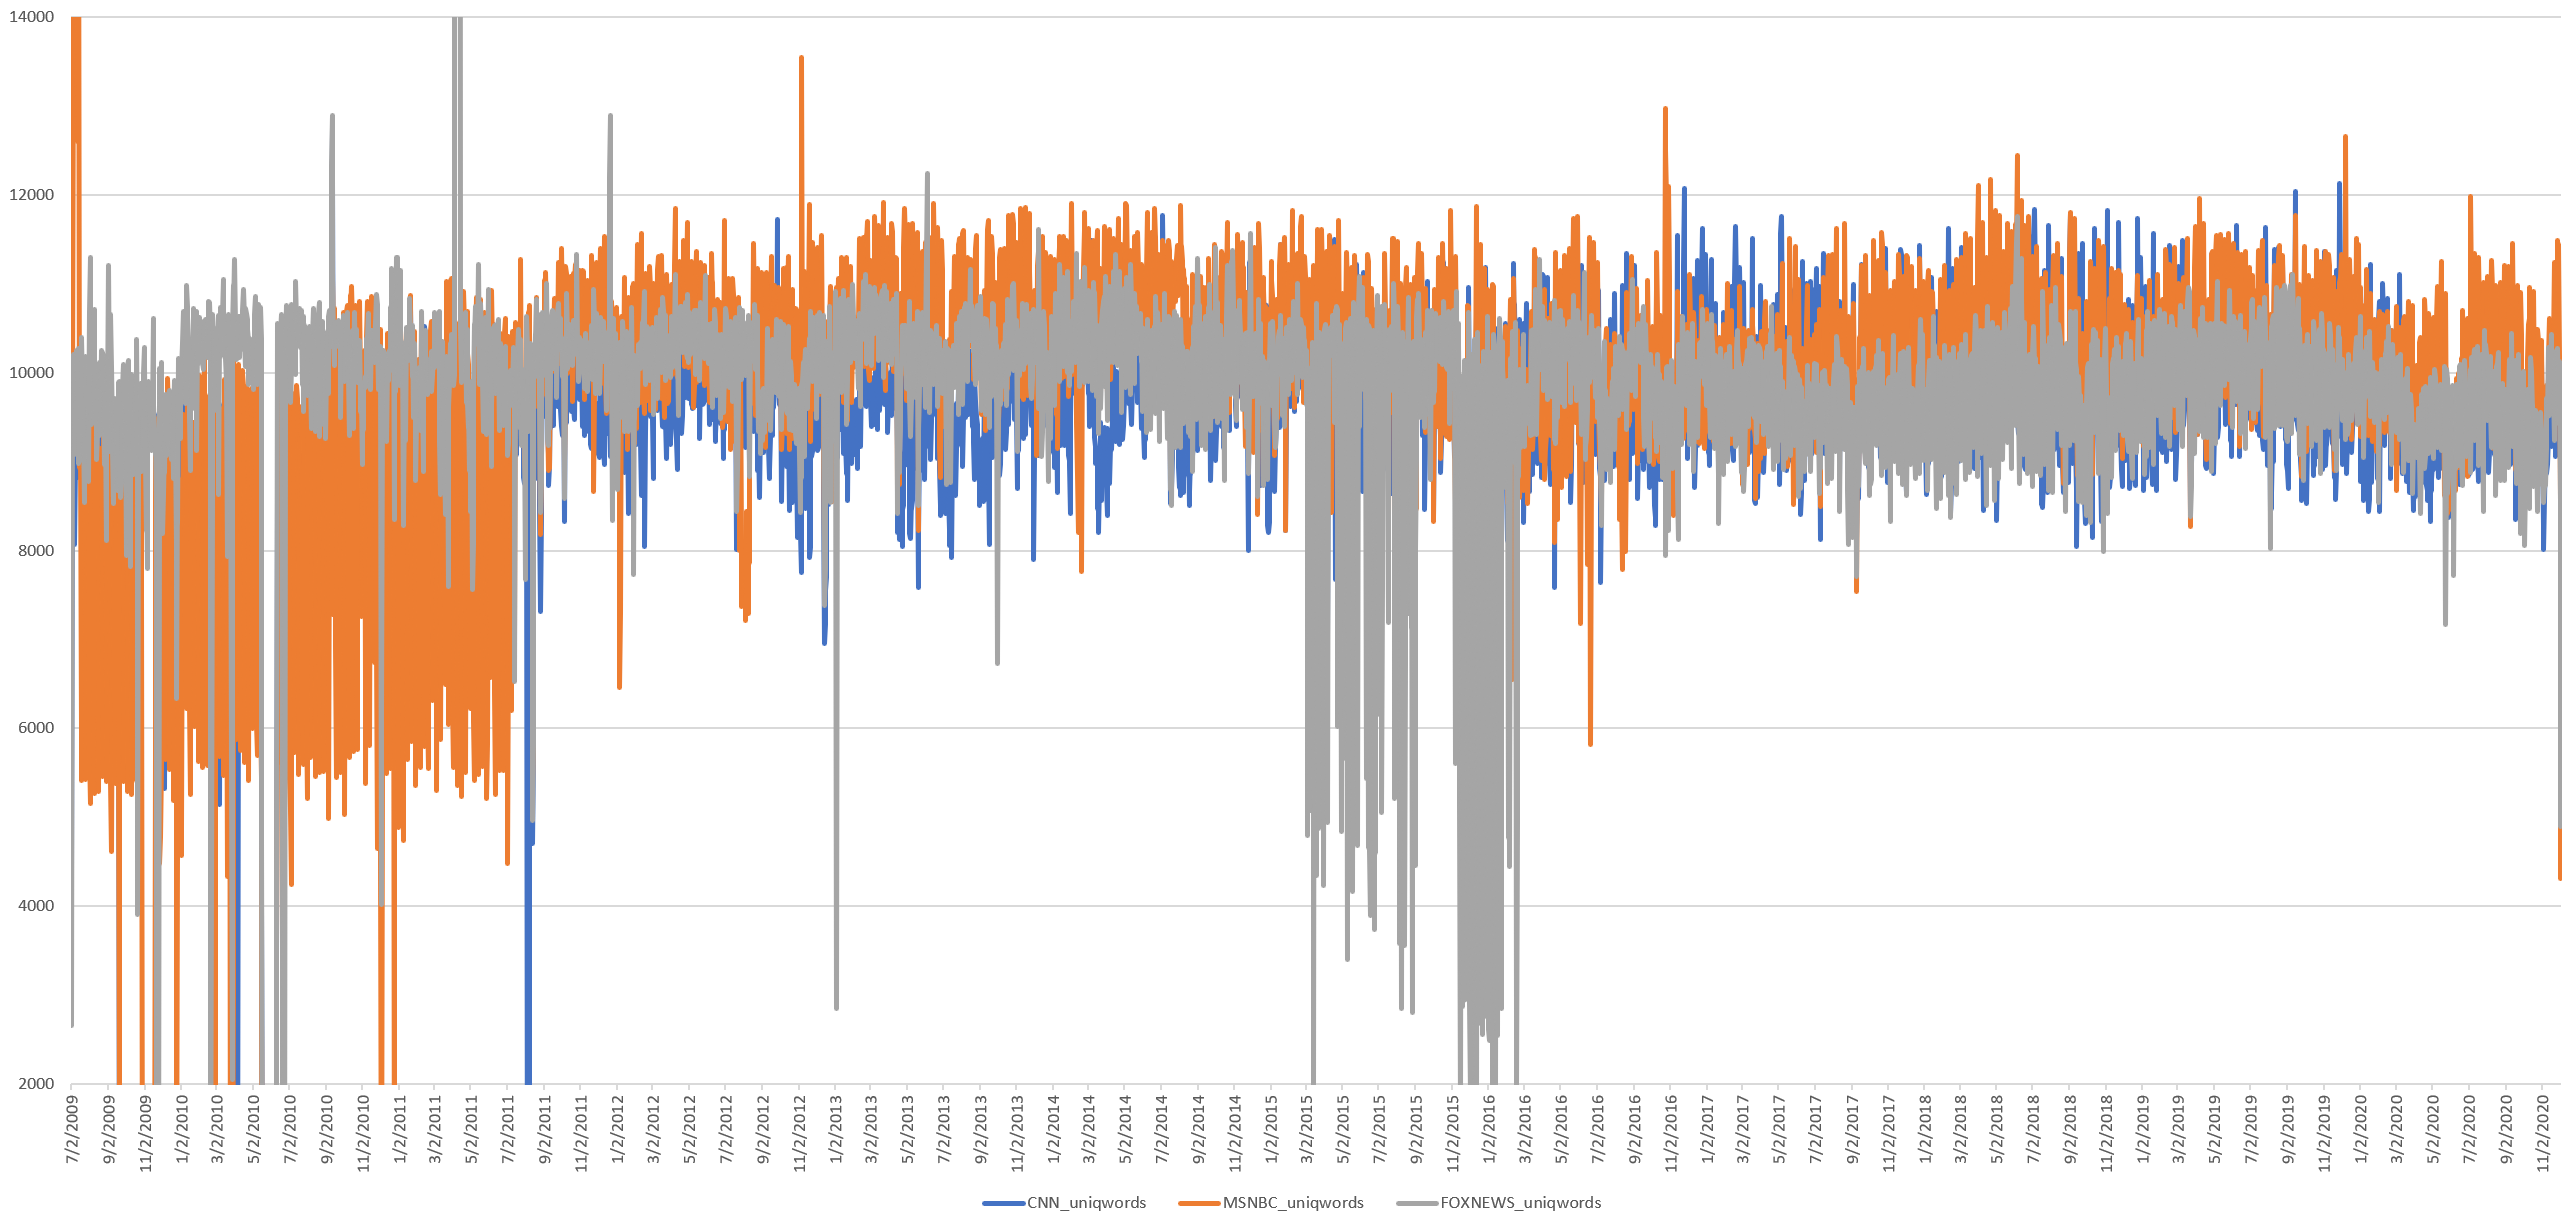
What about the vocabulary of television news? The timeline below plots the total number of distinct words spoken each day (ie, if the word "the" is spoken 10,000 times it is counted once below). Here too there is little major change, with no change around the readability shift, though there is a slight reduction after Trump's dominance over the 2016 race, which coincides with his dominance over the media landscape.
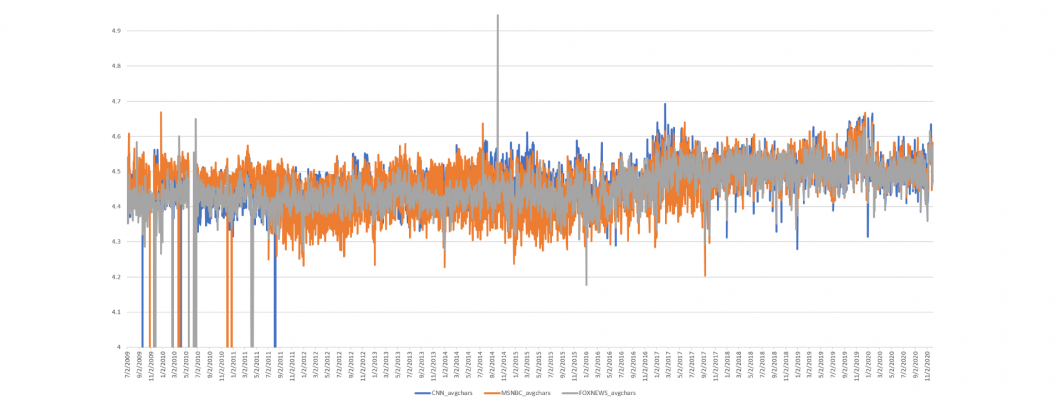
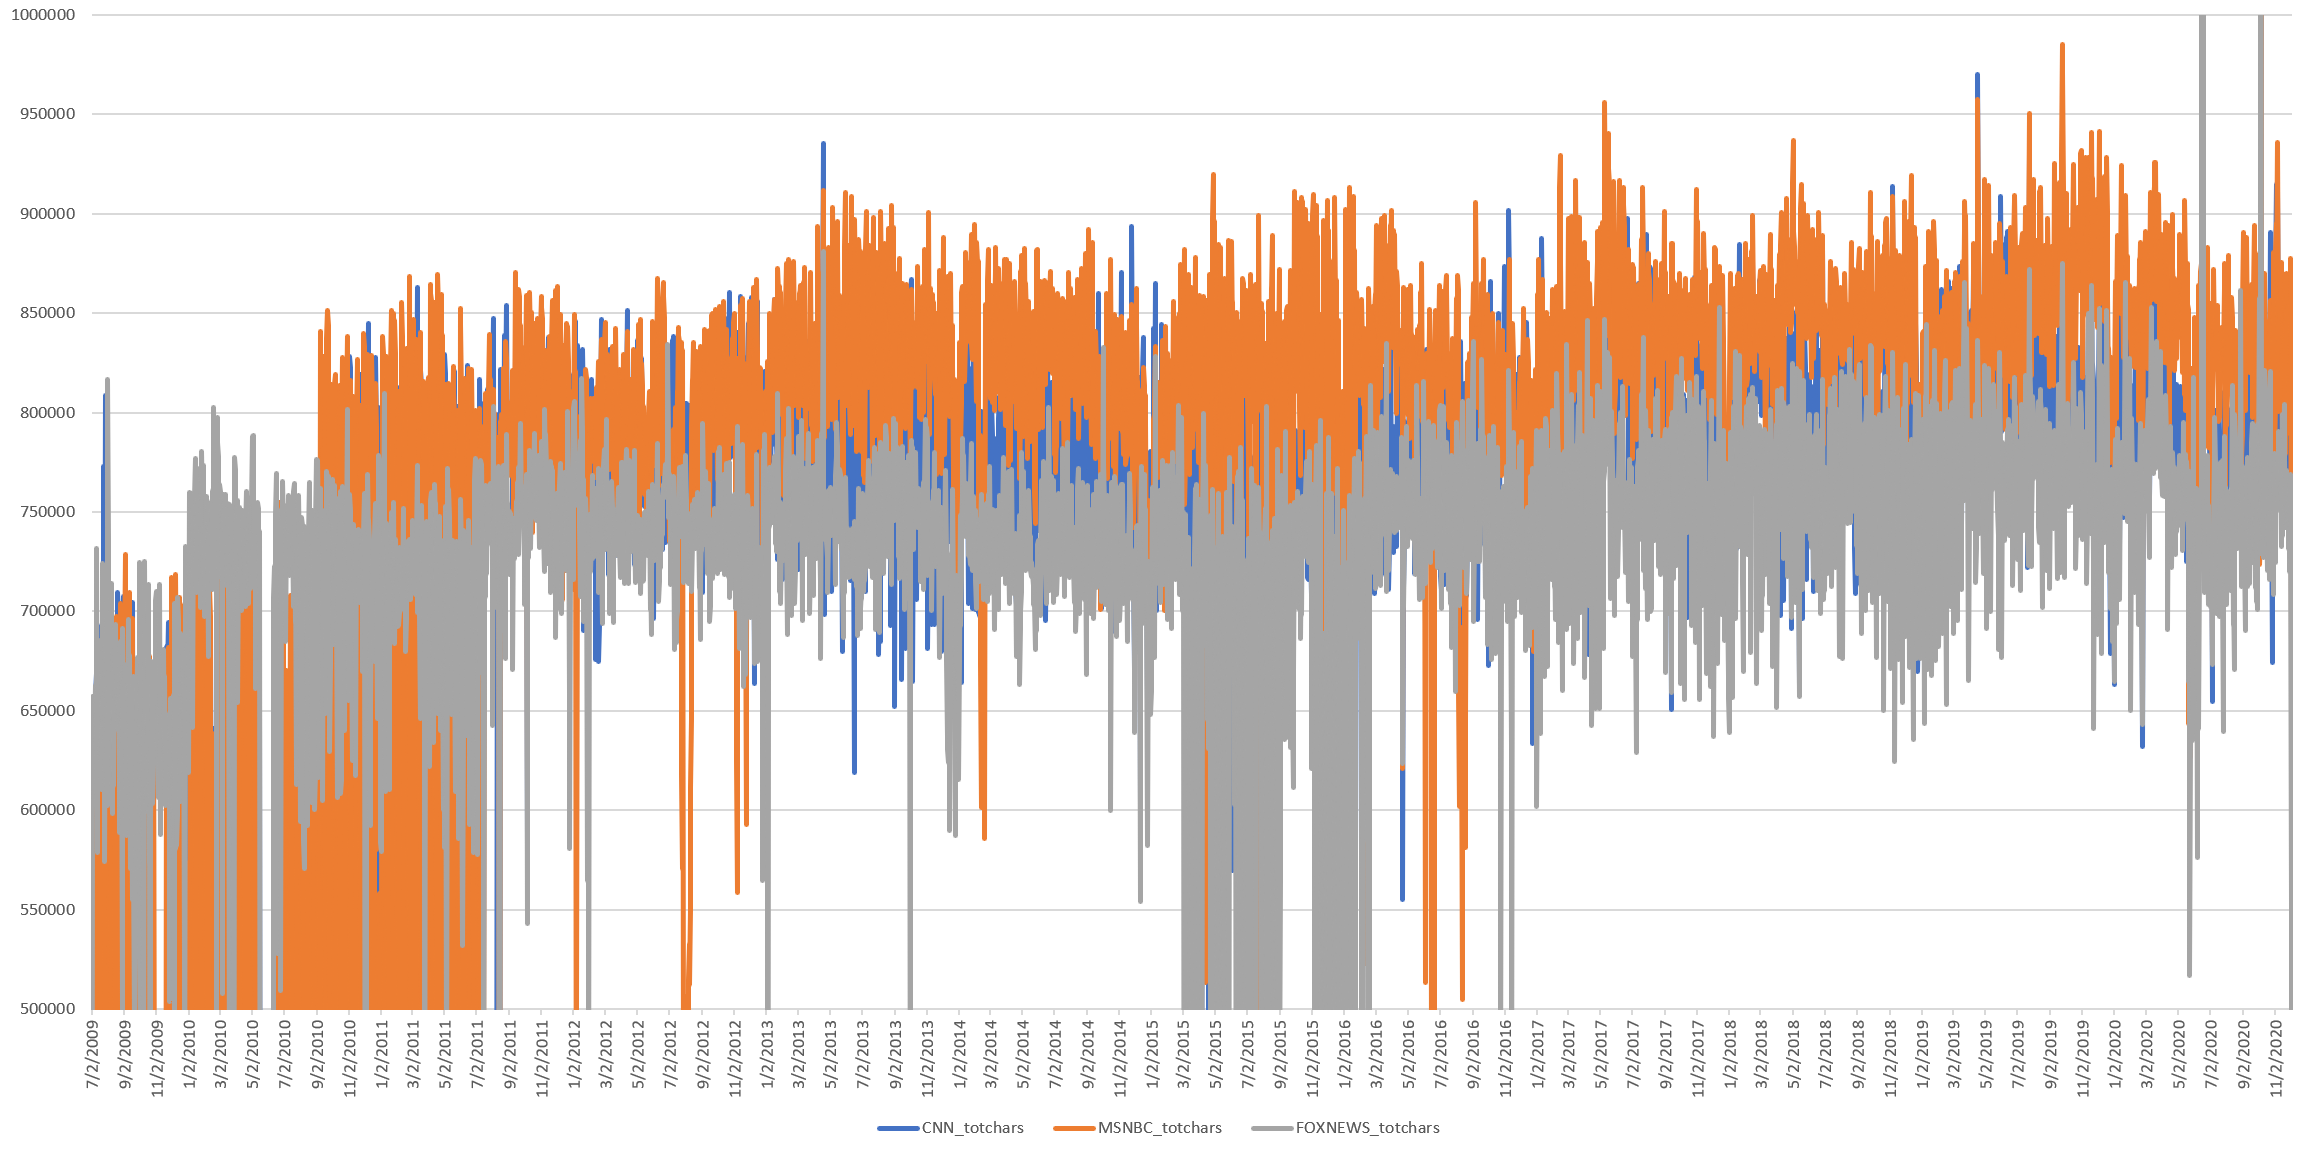
What about total characters, in which the length of each word is multiplied by the number of times it was spoken? Here there is an increase after Trump's election, but not around the time of the readability shift.
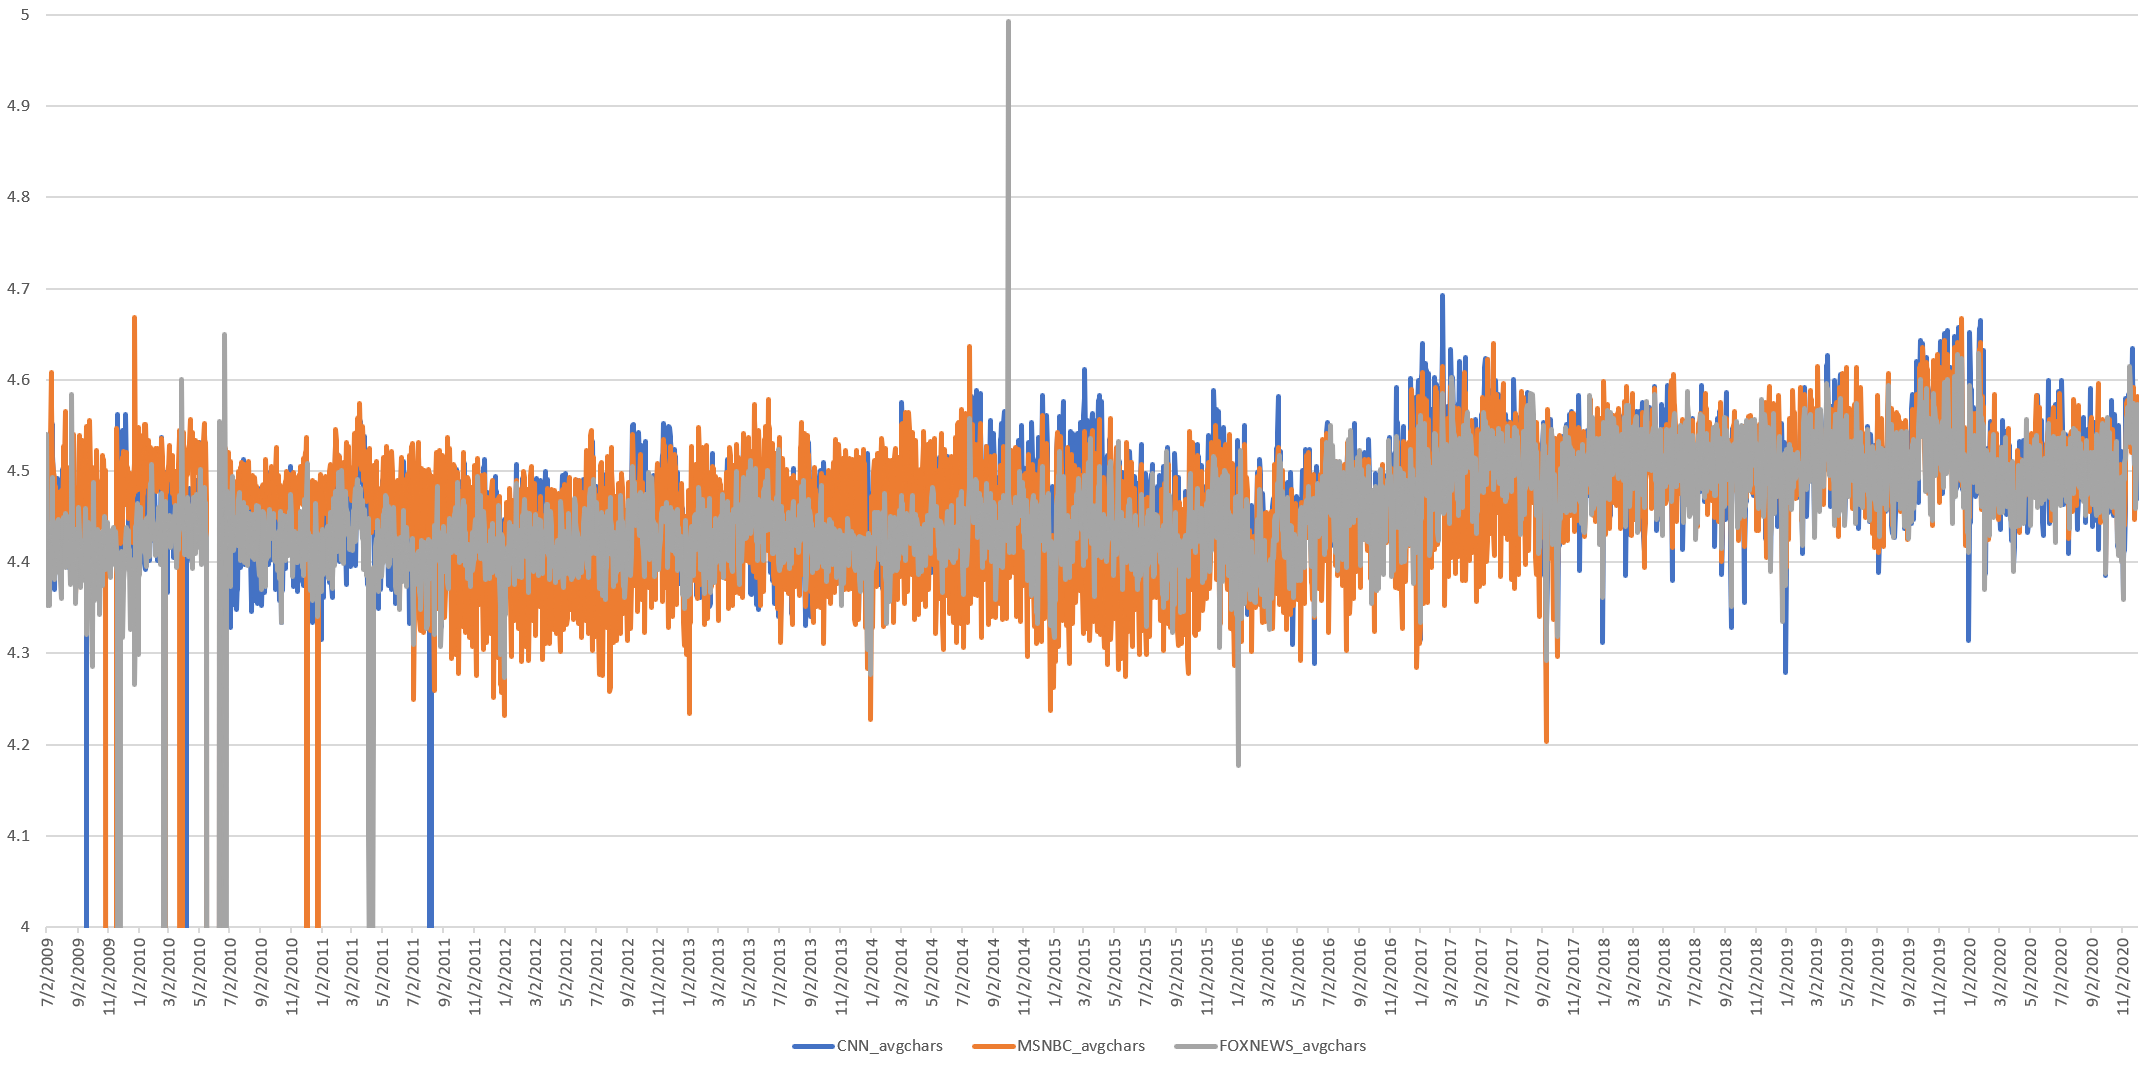
What about the average characters per word per day? Here we divide the timeline above by the total number of words, which allows longer words used a lower number of times to equate shorter words used a larger number of times. Here we see a noticeable shift as Trump emerges to dominate the 2016 race, a rise through his election and remarkable stability since, but again no movement around the readability shift.
What might be driving this shift towards longer average word lengths?
The following query rallies the top words from 2009-2015 by multiplying the length of each word by how often it appeared over that period:
select NGRAM, totlen, totlen/alllen*100 from (
SELECT NGRAM, (LENGTH(NGRAM)*SUM(COUNT)) totlen, (SELECT SUM(LENGTH(NGRAM)*COUNT) FROM `gdelt-bq.gdeltv2.iatv_1gramsv2` WHERE STATION='CNN' and DATE(TIMESTAMP) <= "2015-01-01") alllen FROM `gdelt-bq.gdeltv2.iatv_1gramsv2` WHERE STATION='CNN' and DATE(TIMESTAMP) <= "2015-01-01" group by NGRAM
) order by totlen desc limit 1000
This yields the following table:
Similarly, this query does the same for 2016-present:
select NGRAM, totlen, totlen/alllen*100 from (
SELECT NGRAM, (LENGTH(NGRAM)*SUM(COUNT)) totlen, (SELECT SUM(LENGTH(NGRAM)*COUNT) FROM `gdelt-bq.gdeltv2.iatv_1gramsv2` WHERE STATION='CNN' and DATE(TIMESTAMP) >= "2016-01-01") alllen FROM `gdelt-bq.gdeltv2.iatv_1gramsv2` WHERE STATION='CNN' and DATE(TIMESTAMP) >= "2016-01-01" group by NGRAM
) order by totlen desc limit 1000
Yielding this table:
From 2009-2015, longer words like "president" made up just 0.34% of all word characters, whereas from 2016-2020 in the Era of Trump, "president" accounted for "0.87%" of all spoken words. The word "reporter" moves from 0.24% of all words to 0.16% of all words and so on. There is definitely a shift in word usage, though in the first period, the top 20 words accounted for 17.6% of all word*character mentions compared with 18.1% in the second period, suggesting this alone doesn't account for the shift.
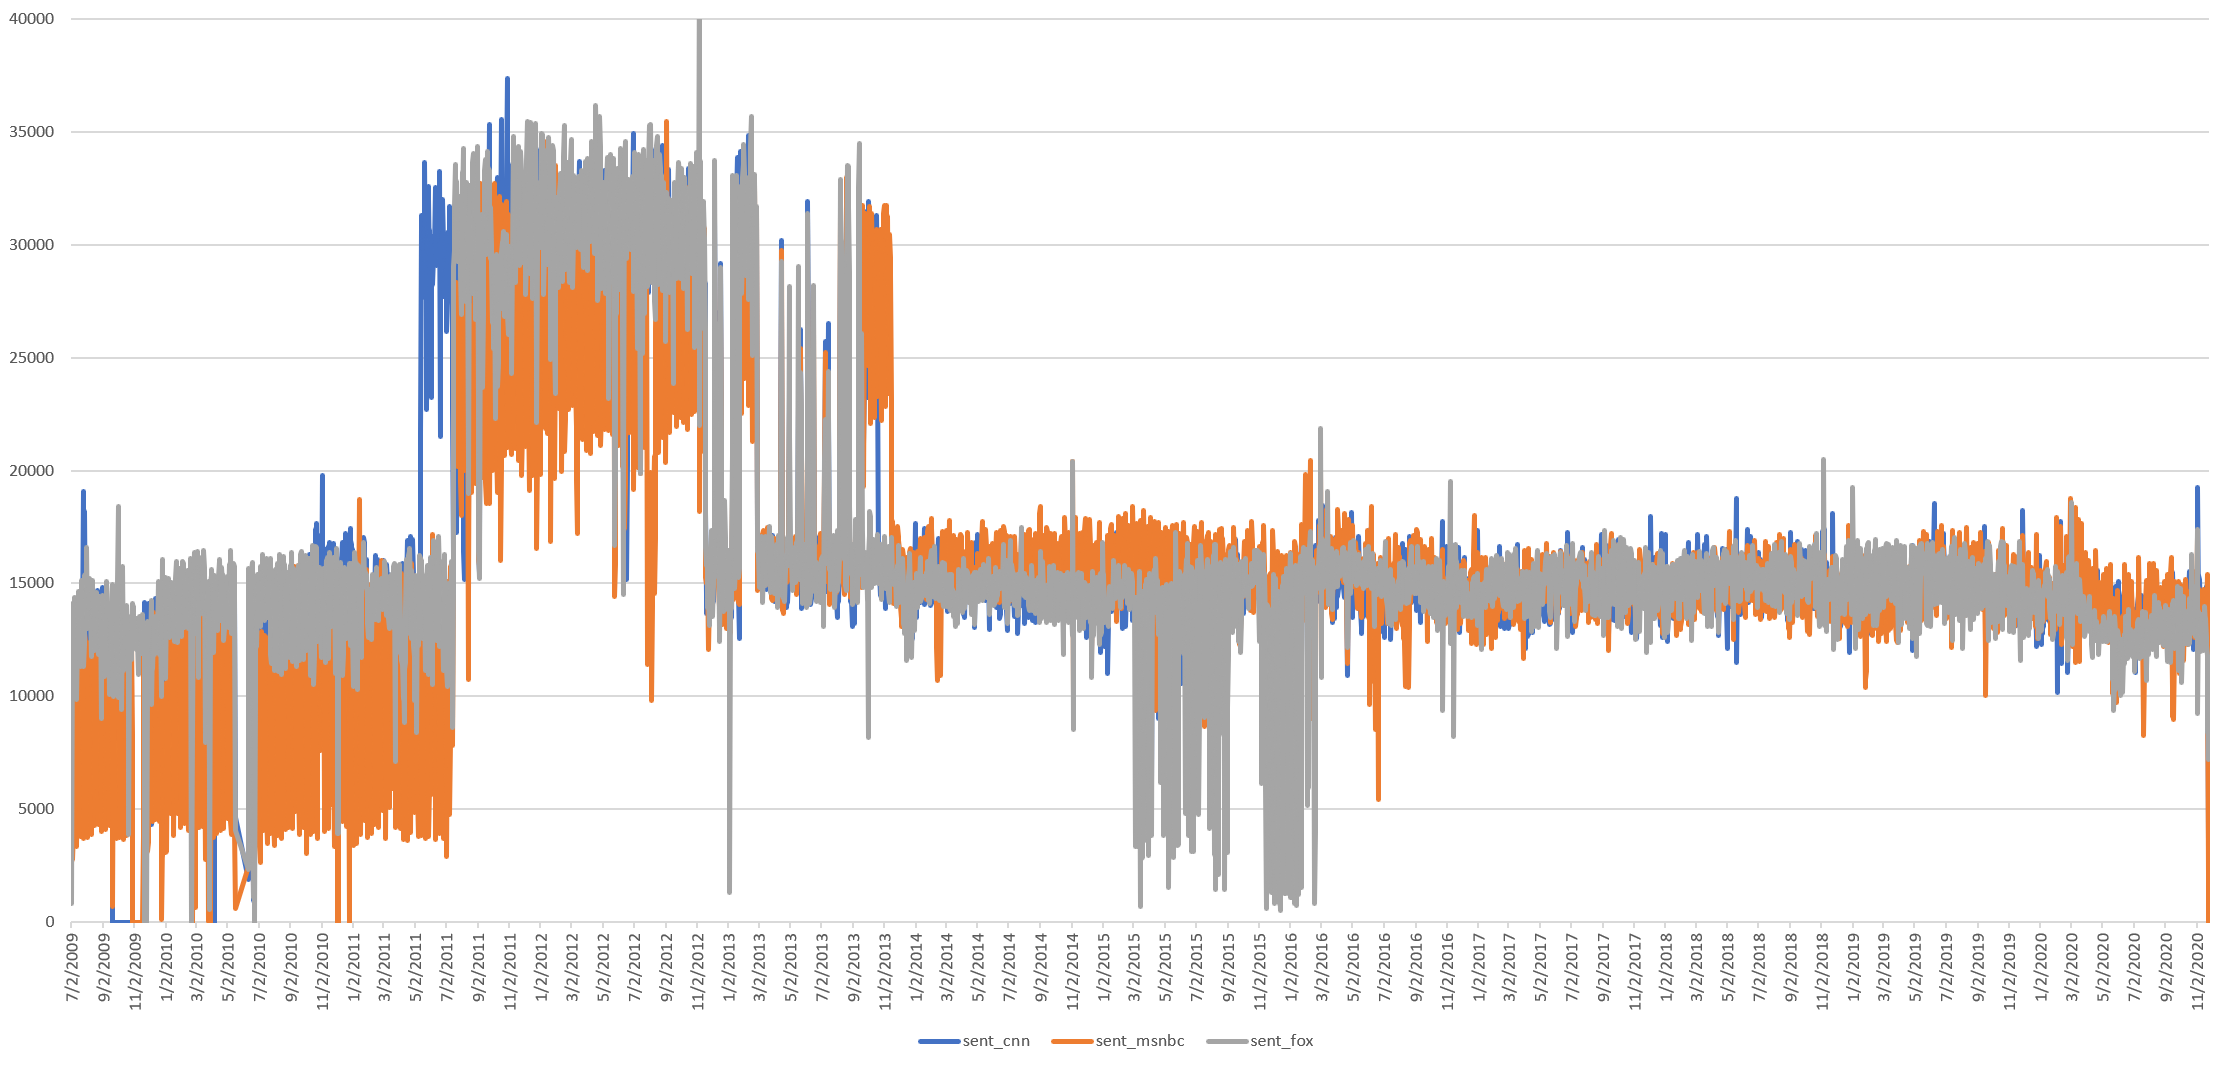
What about the average number of sentences per day as computed by GNU style? This isn't necessarily the actual number of sentences, but rather the number of sentences that style saw based on how it determines sentence boundaries. The readability statistics computed by style are heavily influenced by this metric, so any substantial shifts in sentence construction would have substantial consequences.
select day, SUM(sent_cnn) sent_cnn, SUM(sent_msnbc) sent_msnbc, SUM(sent_fox) sent_fox from (
SELECT DATE(date) day, AVG(CAST(REGEXP_EXTRACT(readabilityScores, r'(\d+) sentences') AS INT64)) sent_cnn, 0 sent_msnbc, 0 sent_fox FROM `gdelt-bq.gdeltv2.readability_iatv` WHERE station='CNN' and res='show' group by day
UNION ALL
SELECT DATE(date) day, 0 sent_cnn, AVG(CAST(REGEXP_EXTRACT(readabilityScores, r'(\d+) sentences') AS INT64)) sent_msnbc, 0 sent_fox FROM `gdelt-bq.gdeltv2.readability_iatv` WHERE station='MSNBC' and res='show' group by day
UNION ALL
SELECT DATE(date) day, 0 sent_cnn, 0 sent_msnbc, AVG(CAST(REGEXP_EXTRACT(readabilityScores, r'(\d+) sentences') AS INT64)) sent_fox FROM `gdelt-bq.gdeltv2.readability_iatv` WHERE station='FOXNEWS' and res='show' group by day
) group by day order by day asc
This yields the graph below which for the first time shows a shift around the same time that readability scores shift, however, values recover afterwards.
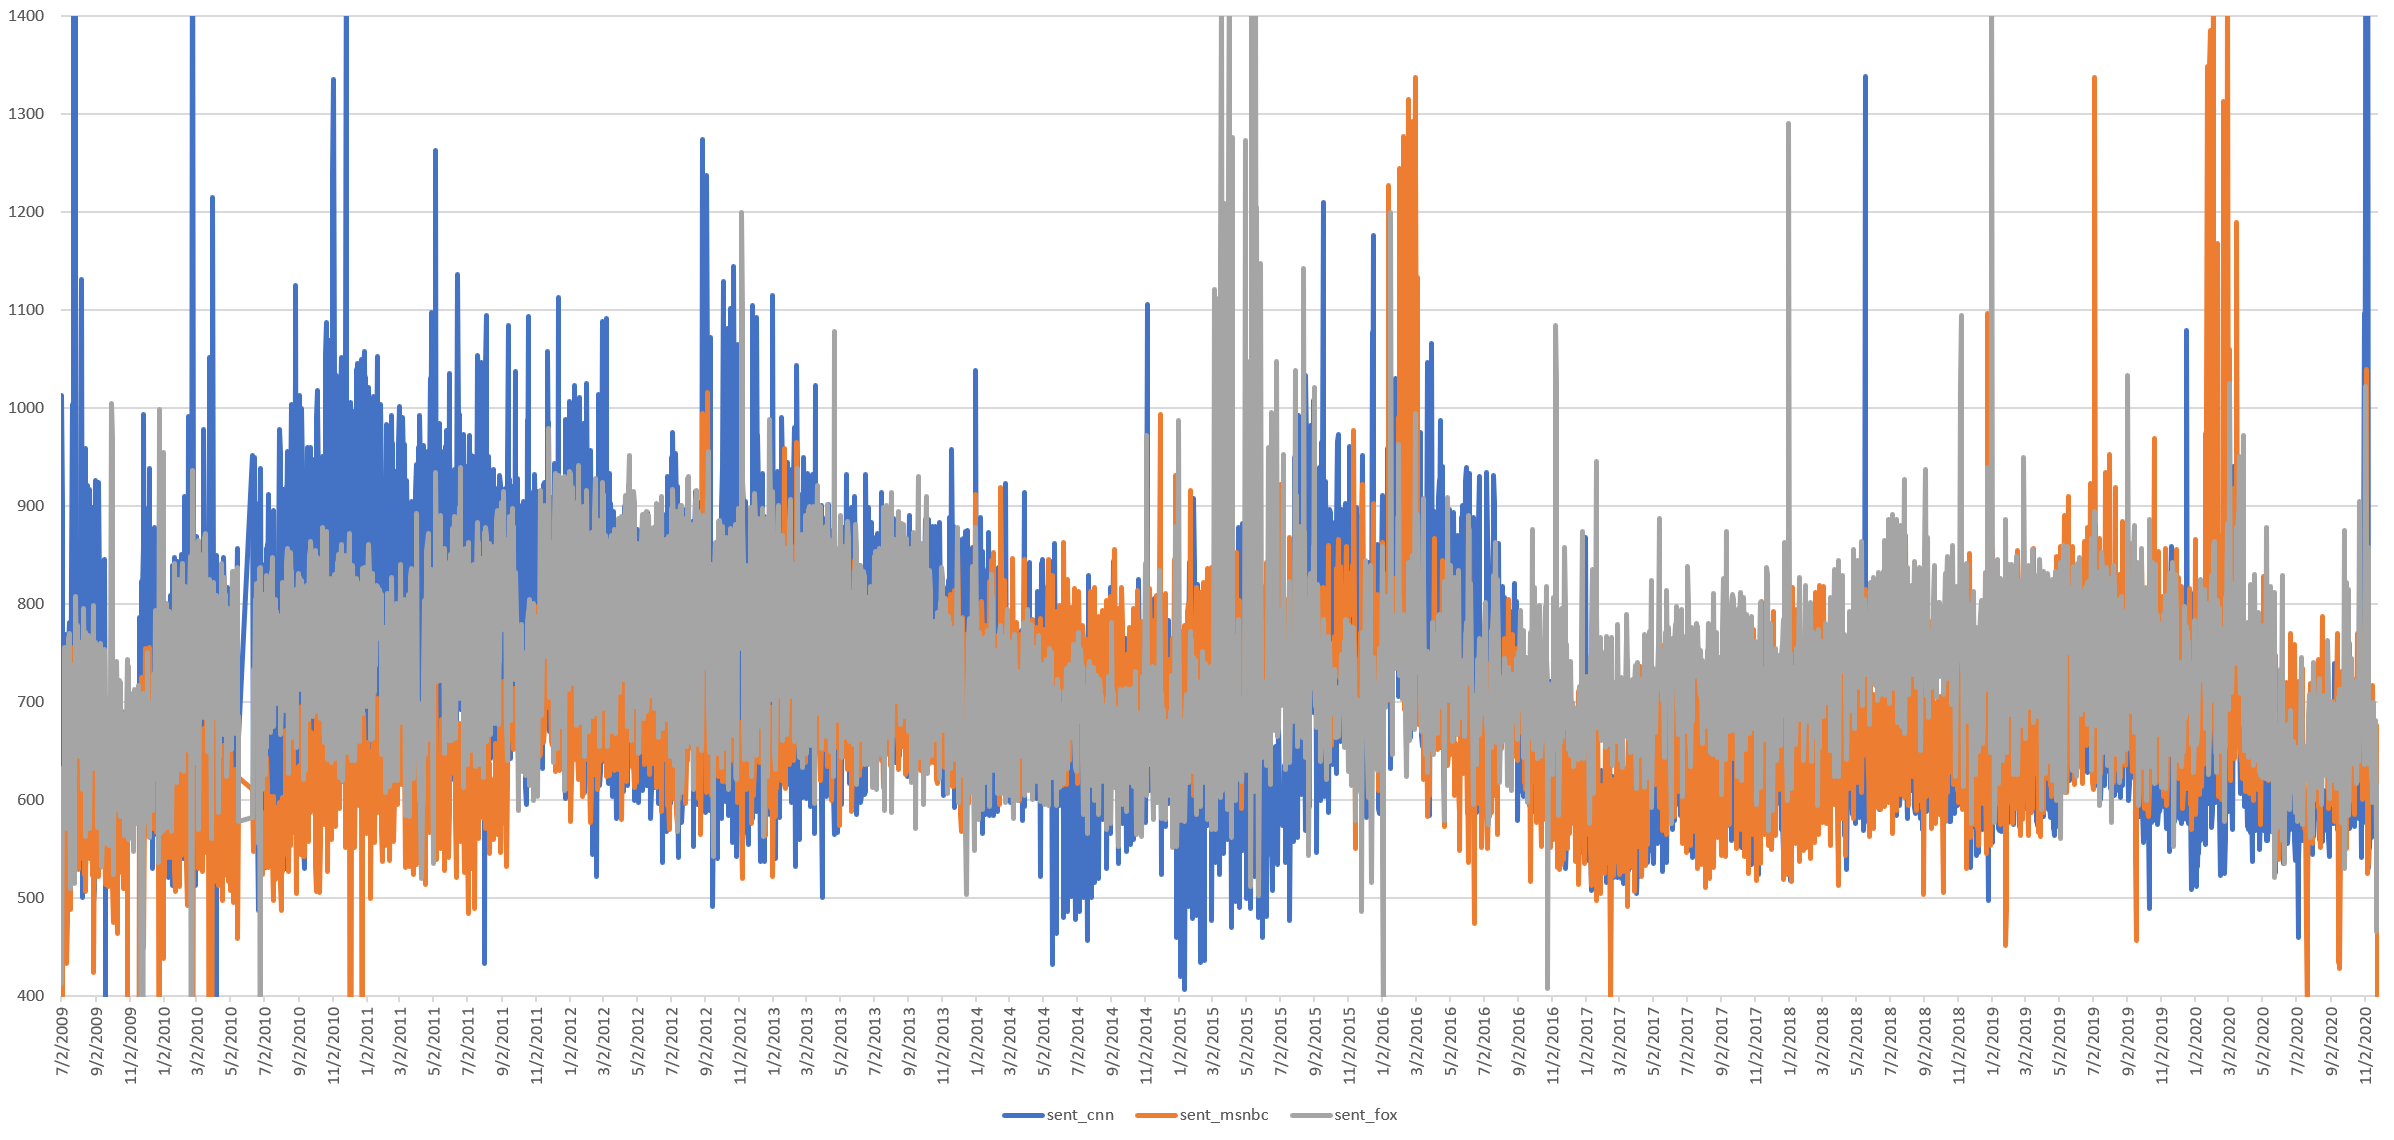
What about the total number of sentences per day, rather than the average number per broadcast? An average can mask substantial outliers.
select day, SUM(sent_cnn) sent_cnn, SUM(sent_msnbc) sent_msnbc, SUM(sent_fox) sent_fox from (
SELECT DATE(date) day, SUM(CAST(REGEXP_EXTRACT(readabilityScores, r'(\d+) sentences') AS INT64)) sent_cnn, 0 sent_msnbc, 0 sent_fox FROM `gdelt-bq.gdeltv2.readability_iatv` WHERE station='CNN' and res='show' group by day
UNION ALL
SELECT DATE(date) day, 0 sent_cnn, SUM(CAST(REGEXP_EXTRACT(readabilityScores, r'(\d+) sentences') AS INT64)) sent_msnbc, 0 sent_fox FROM `gdelt-bq.gdeltv2.readability_iatv` WHERE station='MSNBC' and res='show' group by day
UNION ALL
SELECT DATE(date) day, 0 sent_cnn, 0 sent_msnbc, SUM(CAST(REGEXP_EXTRACT(readabilityScores, r'(\d+) sentences') AS INT64)) sent_fox FROM `gdelt-bq.gdeltv2.readability_iatv` WHERE station='FOXNEWS' and res='show' group by day
) group by day order by day asc
Here we see an enormous deviation from mid-2011 to mid-2013 in which the number of daily sentences doubles. This begins reducing right around the period that readability scores change so dramatically. Sentence counts before 2011 and after 2013 are roughly the same, though ranges are far more narrow and stable post-2013. Recall from earlier, however, that the total number of spoken words does not change during this period, meaning the increased number of sentences is not due to more spoken text, but rather how that text was broken into sentences. This suggests from 2011-2013 there was a systematic shift across the captioning of the three channels that changed how GNU style broke them into sentences that will require further research.
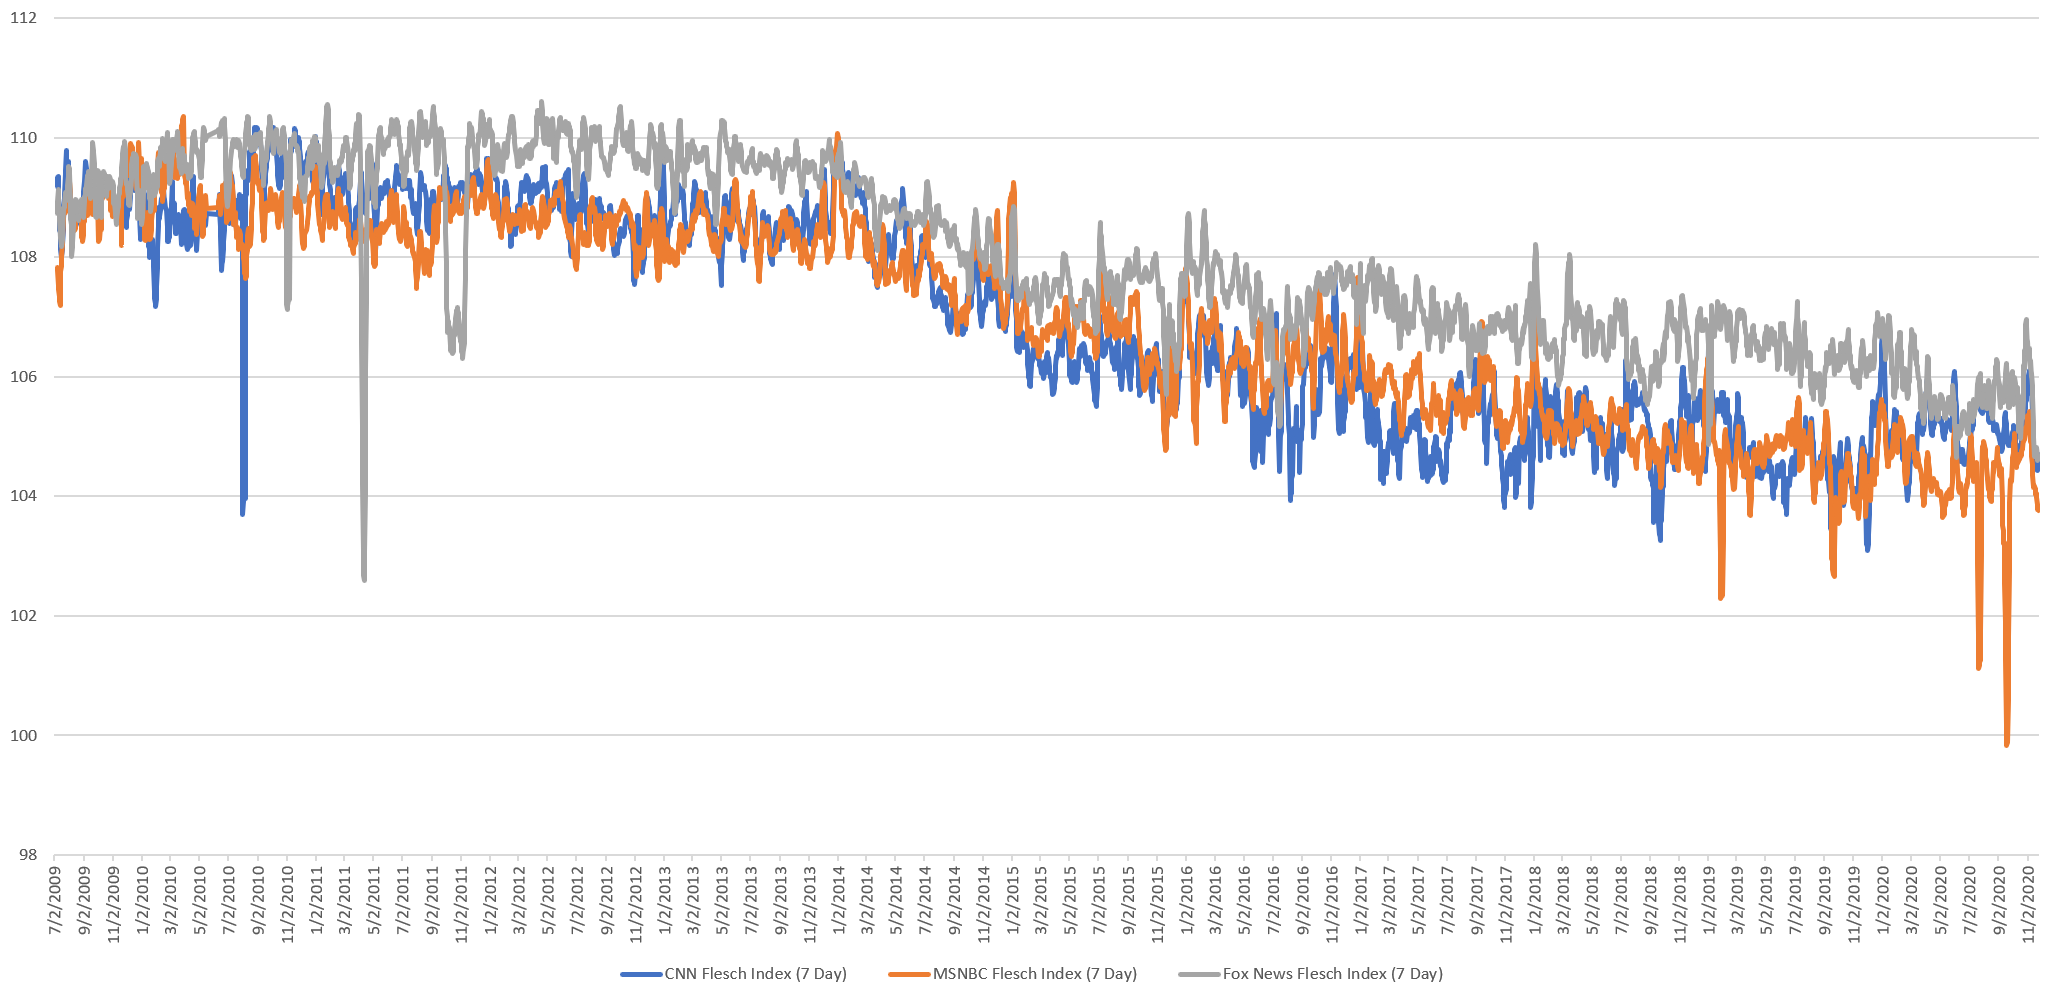
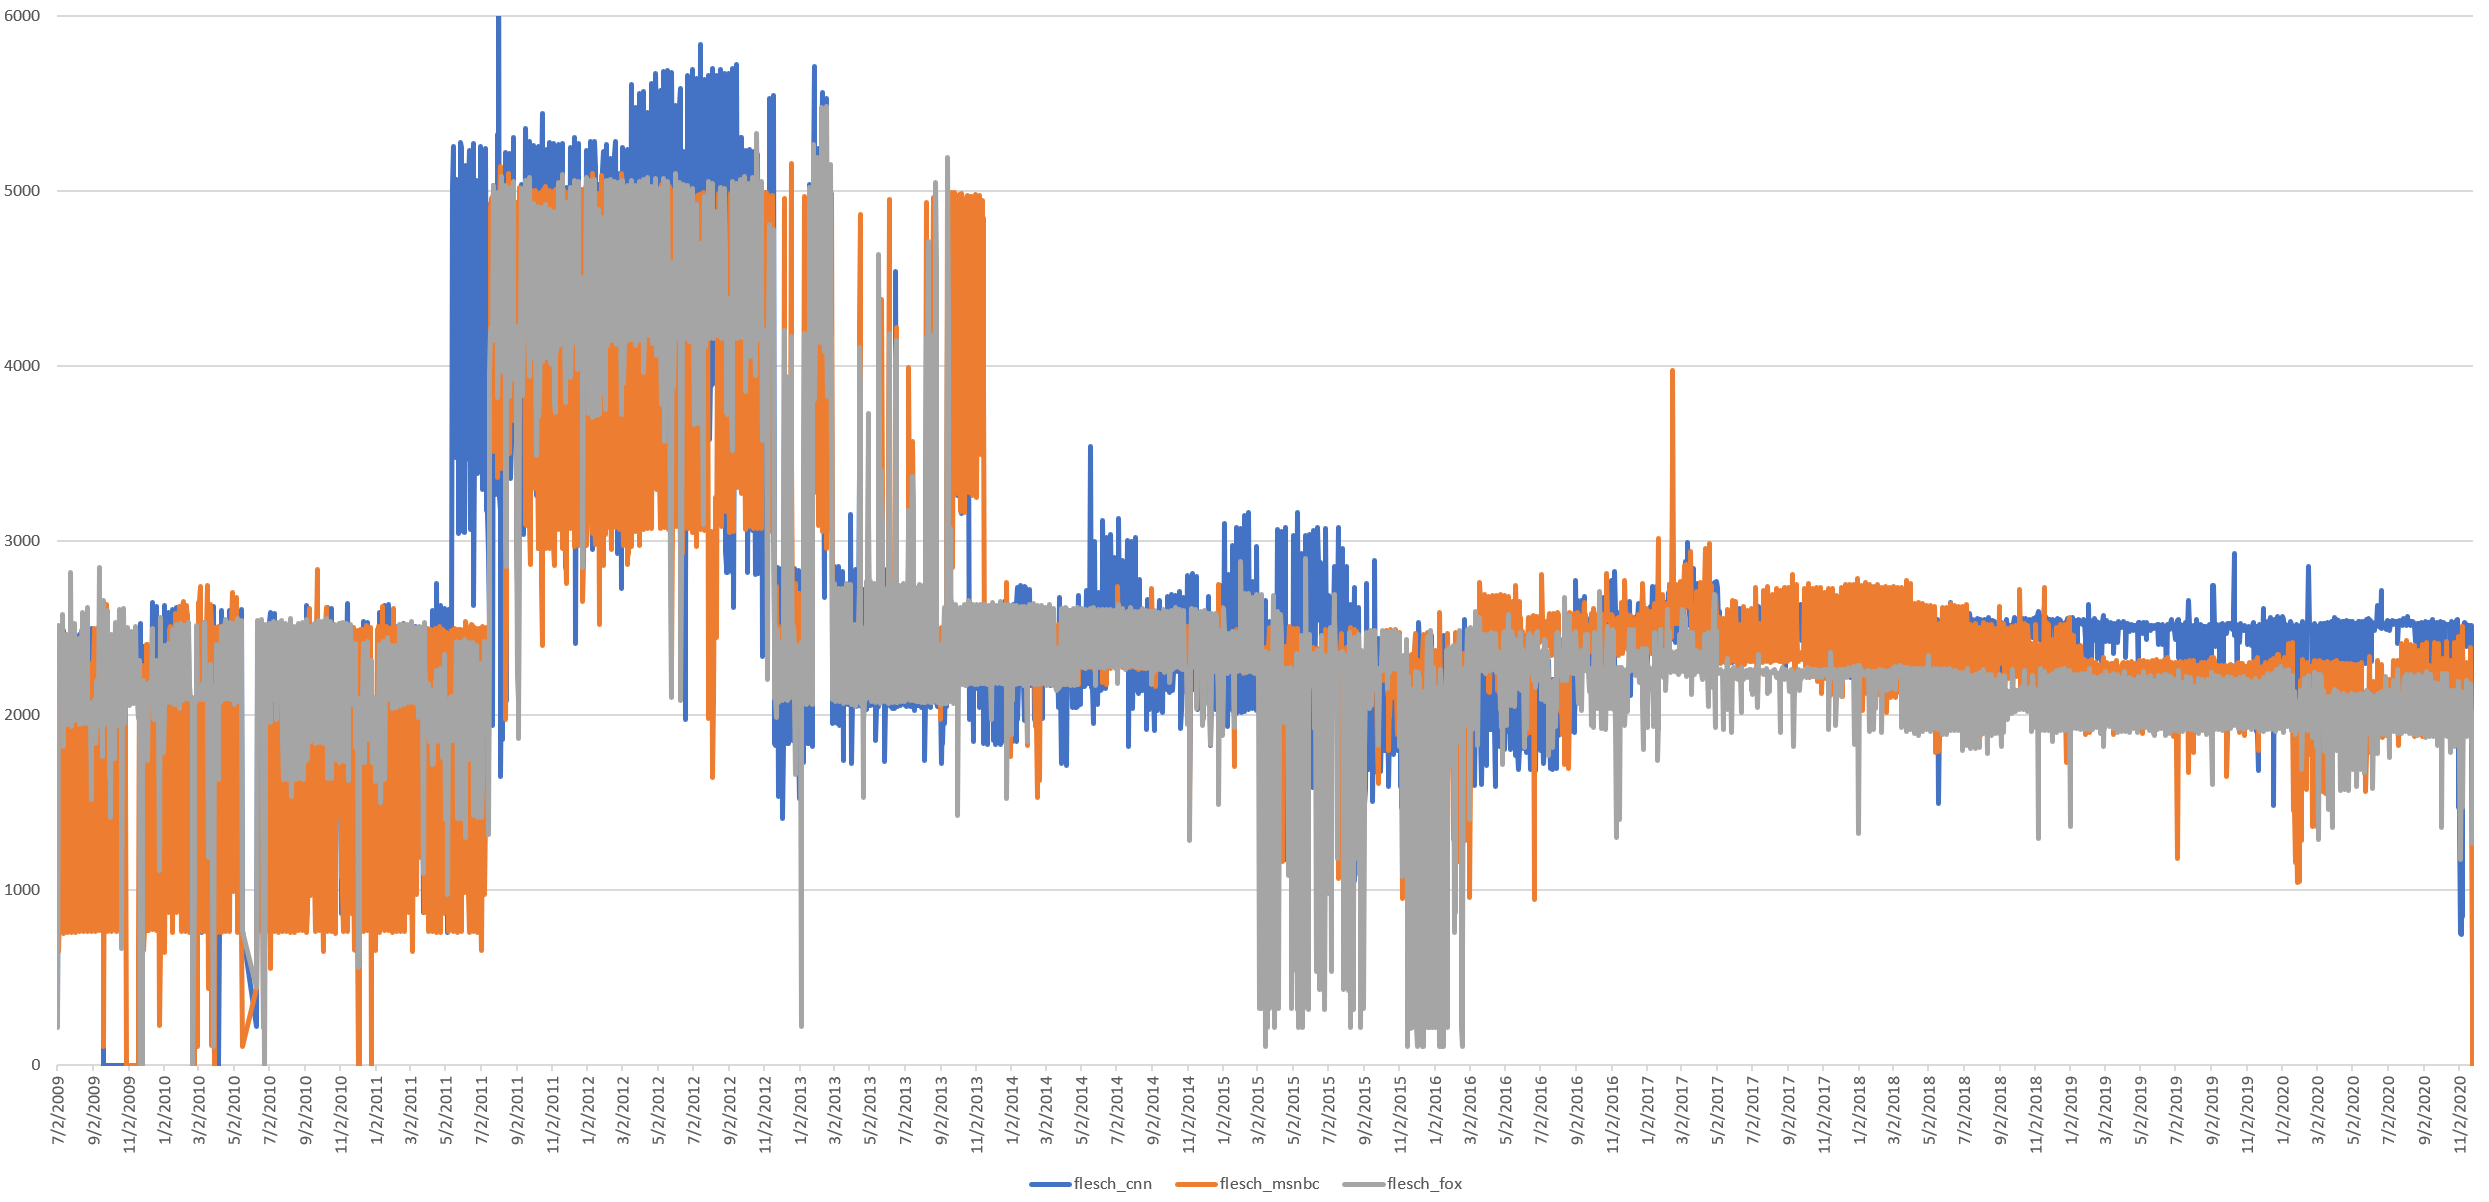
Similarly, if we plot the total sum of all Flesch scores across each channel each day, rather than their average, we see this same curve.
select day, SUM(flesch_cnn) flesch_cnn, SUM(flesch_msnbc) flesch_msnbc, SUM(flesch_fox) flesch_fox from (
SELECT DATE(date) day, SUM(CAST(REGEXP_EXTRACT(readabilityScores, r'Flesch Index: (.*?)/') AS FLOAT64)) flesch_cnn, 0 flesch_msnbc, 0 flesch_fox FROM `gdelt-bq.gdeltv2.readability_iatv` WHERE station='CNN' and res='show' group by day
UNION ALL
SELECT DATE(date) day, 0 flesch_cnn, SUM(CAST(REGEXP_EXTRACT(readabilityScores, r'Flesch Index: (.*?)/') AS FLOAT64)) flesch_msnbc, 0 flesch_fox FROM `gdelt-bq.gdeltv2.readability_iatv` WHERE station='MSNBC' and res='show' group by day
UNION ALL
SELECT DATE(date) day, 0 flesch_cnn, 0 flesch_msnbc, SUM(CAST(REGEXP_EXTRACT(readabilityScores, r'Flesch Index: (.*?)/') AS FLOAT64)) flesch_fox FROM `gdelt-bq.gdeltv2.readability_iatv` WHERE station='FOXNEWS' and res='show' group by day
) group by day order by day asc
Fox News scores are lower pre-post, while CNN and MSNBC appear more stable with less day-to-day deviation.
So what might explain the readability shift? The total number of words and characters spoken did not change dramatically during the readability shift. Average word length has changed, but in response to Donald Trump's rise, rather than during the 2013 readability shift. Clearly some change occurred in 2011-2013 that affected how style divided the realtime transcript into sentences, but the number of sentences is the same before and after, rather than reflecting the sharp downturn in readability scores pre/post.
The actual Flesch formula used by GNU style is:
206.835-84.6*syll/wds-1.015*wds/sent
Thus, it depends on the number of syllables, the number of words and the number of sentences. All three are seen in the graphs above to change over time, suggesting it is the interaction of these three, rather than a single driving variable, that is behind this readability shift.
Perhaps most important of all, given that the three channels are produced by three very different companies, why would there be alignment among them if this shift represents a change in closed captioning? The answer is that all three use the same captioning vendor Vitac, so any changes in captioning practices at that vendor would be reflected across all three channels in lockstep, exactly what we see here.
While MSNBC and Fox News have rarely included the Vitac credit line in their broadcasts, CNN has frequently included a credit at the start or end of each broadcast, as seen below. Intriguingly, mentions of Vitac increase sharply beginning in early 2013 right around when the change in readability begins and levels off at a new normal around mid-2015, which is around when the readability statistics level off.
In conclusion, the likely conclusion here is that the marked readability shift from 2009-2020 likely reflects more heavily changes in captioning practices at the vendor all three channels rely upon than a massive simultaneous shift in the readability of all three channels in lockstep. At the same time, the higher readability scores for Fox News compared with CNN and MSNBC suggest that may be a genuine trend. Moreover, the graphs here suggest there are genuine changes that have occurred to the television news landscape over this period, with the Era of Trump having an enormous impact on vocabulary and makeup of television news over the past half-decade. Perhaps most importantly, these graphs stand testament once again to the profound new methodological questions that await as we adapt approaches like readability estimates to new modalities like television news.