Yesterday we unveiled a massive new dataset of television news readability scores for 23 stations spanning portions of the past decade, totaling more than 1.15 million broadcasts, using data from the Internet Archive's Television News Archive. What insights might this data offer into how the "readability" of different stations compare and how their scores may have changed over the past decade?
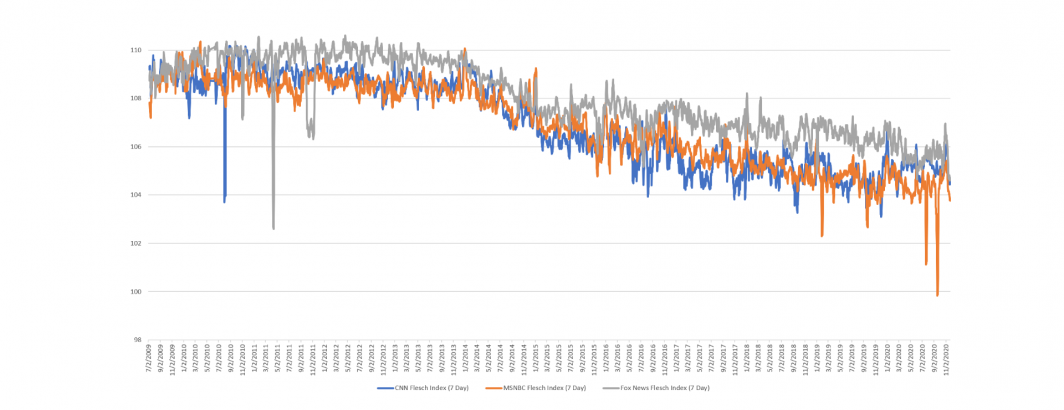
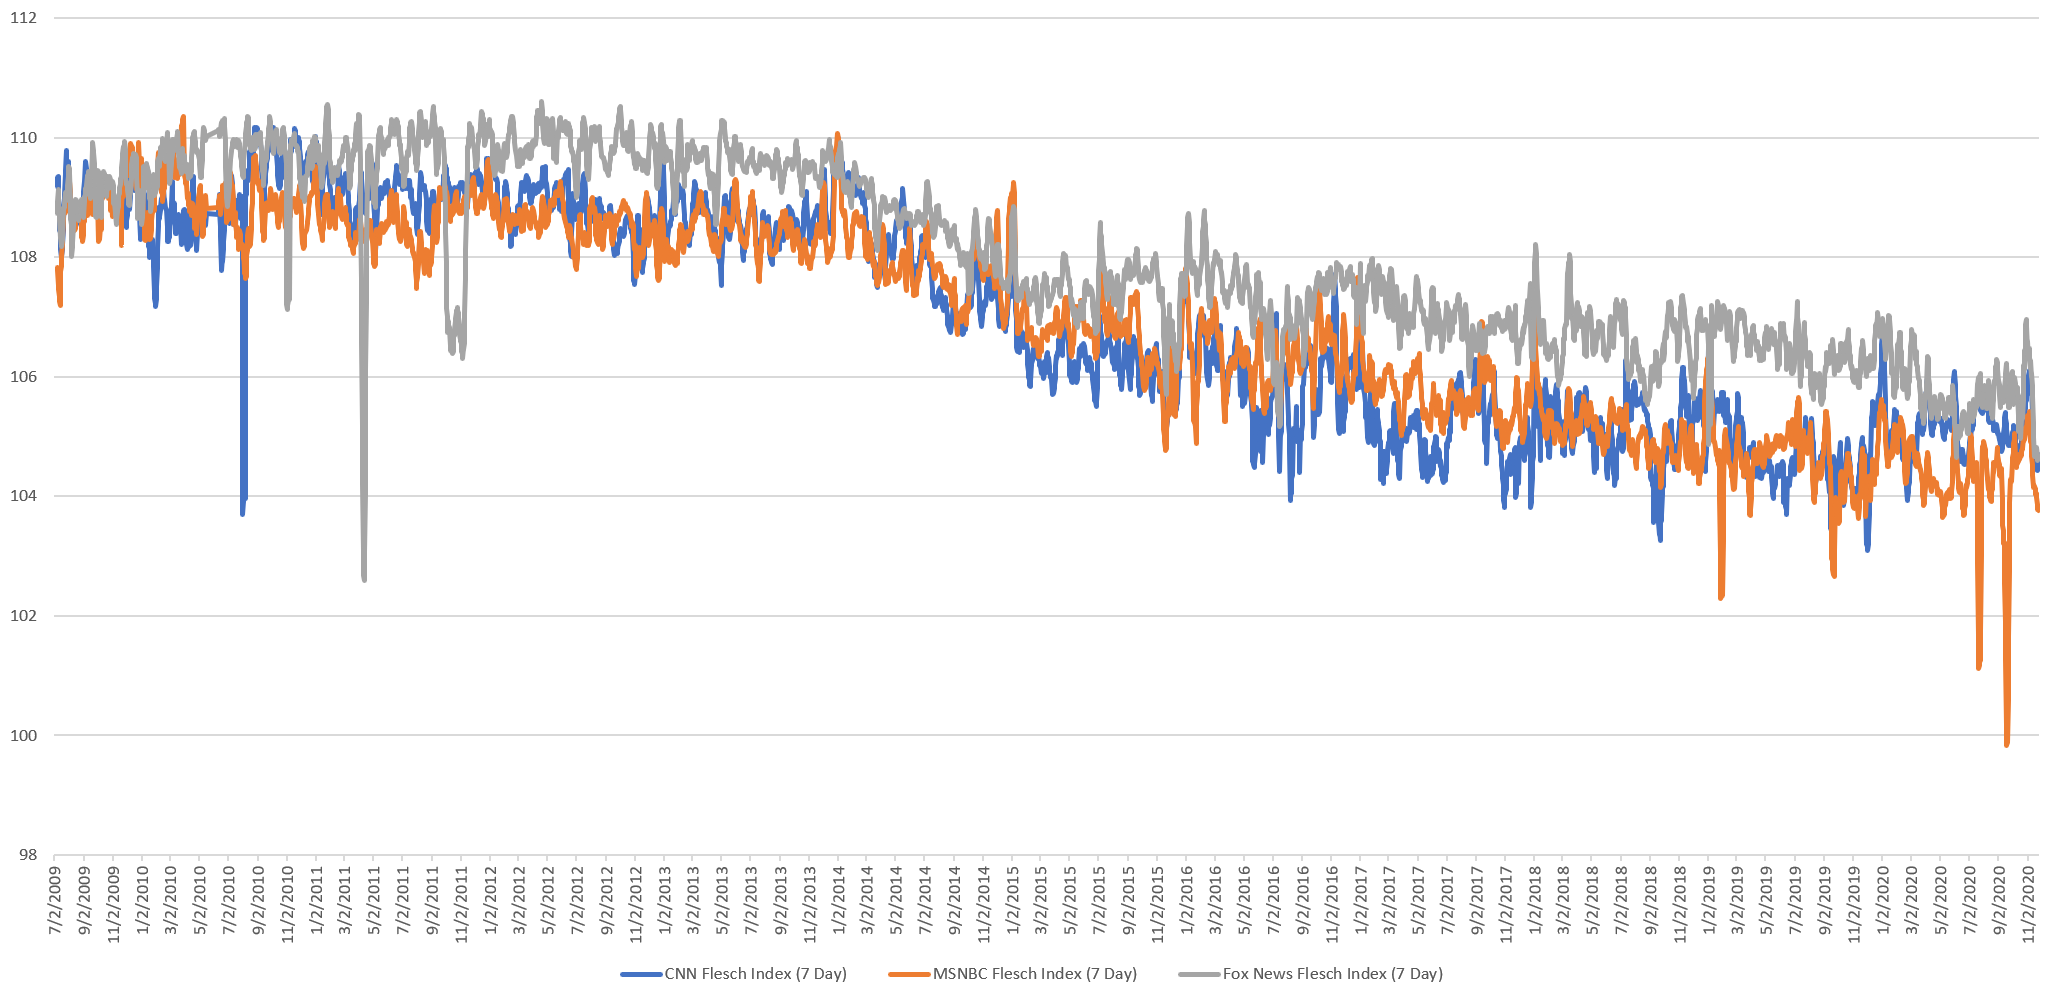
The query below plots the average daily broadcast-level Flesch readability score for CNN, MSNBC and Fox News for the past decade (smoothed using a 7-day rolling average) as computed by GNU style, with higher numbers indicating easier-to-understand texts and lower indicating harder texts. The Flesch score is not designed for the artificial sentence construction of spoken word transcripts, which explains why the values below are almost all above the Flesch score's traditional maximum value of 100.
Over the past decade, the average daily Flesch reading ease of Fox News broadcasts has been measurably higher than CNN and MSNBC, which track one another closer, suggesting that Fox News broadcasts are easier to understand, using shorter sentences with shorter and simpler words. However, it is important to remember when examining this graph that this could also be due to systematic differences in how Fox News transcribes its broadcasts, perhaps favoring shorter self-contained sentences while the other two channels prefer longer strung-together sentences. Either outcome cannot be discounted from the graph below.
Perhaps most noteworthy, however, is that decline in readability scores across all three channels from January 2014 through December 2014 and a slower decline through December 2017. It is unclear what might have driven such a systemic change across all three channels and this deserves further research.
UPDATE (12/3/2020): We've produced a deep dive analysis of this curve suggesting it may be due to a shift in captioning workflows by their shared captioning vendor.
TECHNICAL DETAILS
Computing the graph above took just a single SQL query in BigQuery:
select day, SUM(flesch_cnn) flesch_cnn, SUM(flesch_msnbc) flesch_msnbc, SUM(flesch_fox) flesch_fox from (
SELECT DATE(date) day, AVG(CAST(REGEXP_EXTRACT(readabilityScores, r'Flesch Index: (.*?)/') AS FLOAT64)) flesch_cnn, 0 flesch_msnbc, 0 flesch_fox FROM `gdelt-bq.gdeltv2.readability_iatv` WHERE station='CNN' and res='show' group by day
UNION ALL
SELECT DATE(date) day, 0 flesch_cnn, AVG(CAST(REGEXP_EXTRACT(readabilityScores, r'Flesch Index: (.*?)/') AS FLOAT64)) flesch_msnbc, 0 flesch_fox FROM `gdelt-bq.gdeltv2.readability_iatv` WHERE station='MSNBC' and res='show' group by day
UNION ALL
SELECT DATE(date) day, 0 flesch_cnn, 0 flesch_msnbc, AVG(CAST(REGEXP_EXTRACT(readabilityScores, r'Flesch Index: (.*?)/') AS FLOAT64)) flesch_fox FROM `gdelt-bq.gdeltv2.readability_iatv` WHERE station='FOXNEWS' and res='show' group by day
) group by day order by day asc
We're excited to see what fascinating trends you find in this dataset!