This guest post is by Amanda Traud, PhD, Data Scientist at L-3 Data Tactics.
The news media holds a prominent place in our lives. While it may not be as prominent as social media, many of us wake up to, or go to bed with some sort of news outlet, whether it be print, broadcast, or internet. These outlets ground us in the events of the present, but they can also help us study the events of the past. George Santayana once said, "Those who cannot remember the past are condemned to repeat it."
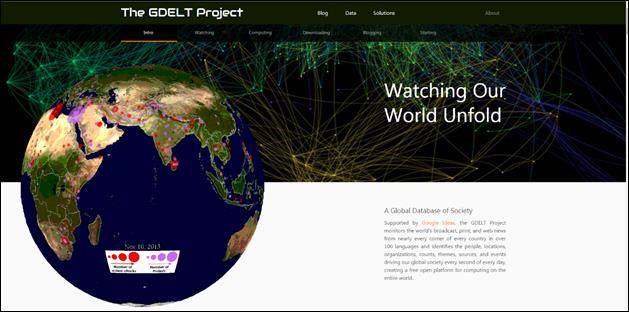
To better understand the events of the past, human interactions in these events, and how we might react to future events, Kalev H. Leetaru created the Global Dataset of Events, Locations, and Tone (GDELT) (http://gdeltproject.org/). GDELT is an event database that provides the largest available collection of machine-coded event data. Event data provide a rich and reliable feature set to characterize geopolitical events. Many variants of event data coding schemas have been developed, culminating in the CAMEO schema used by GDELT. This schema offers a rich array of Actor and Event codes which supports the coding of a large variety of international and domestic events. This database, with more than 200 million unique events since 1970, offers an expansive resource for mining, understanding, and predicting geopolitical events.
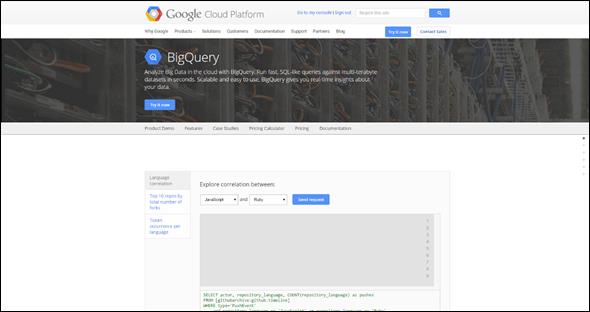
While you can go to the GDELT website and use their analysis tools (http://analysis.gdeltproject.org/), this database is also available in Google BigQuery (https://developers.google.com/bigquery/). BigQuery allows users to use a database query to extract information. Users can pull events happening in specific date ranges, in specific countries, specific event types or a combination of all three. To better understand the utility of the GDELT database, (and to keep from having to write many many database queries), part of the data science team at L-3 (Keegan Hines, PhD (@keeghin); Michael Czerny, MS (@m0_z); Amanda Traud, PhD (@altraud)) created a dashboard to access this data, using RShiny (shiny.rstudio.com) and JavaScript.
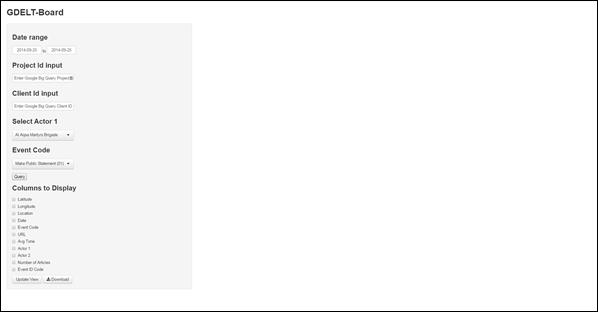
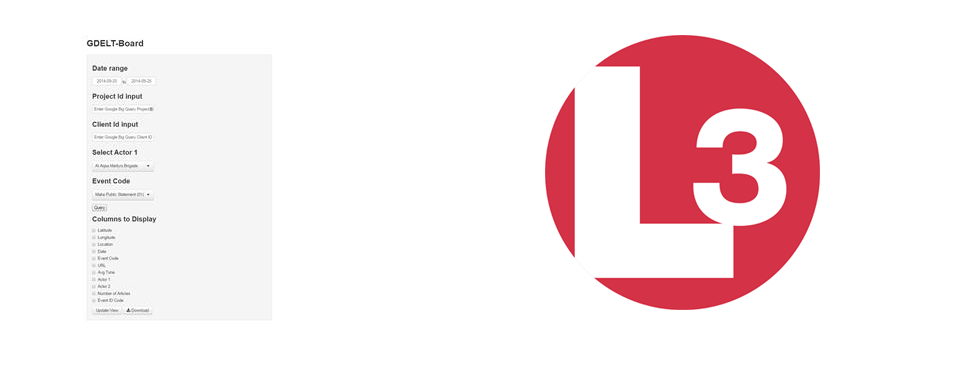
The dashboard allows a user to put in a date range, choose a country or entity, choose an event type and then choose the data they want to view. The dashboard then asks the database for this information and shows a table that displays user selected columns. The user can adjust the display columns until they have the exact dataset they want to download and then click a button to download a csv file containing that data. No querying knowledge required. There are, however, a few prelims to using this dashboard. You can play with the dashboard on the L-3 Data Tactics Shiny server at (https://shiny.data-tactics-corp.com/GDeltNetwork/) or download the source code at (https://github.com/DataTacticsCorp/GDELT-App). The user must have a Google Developer account. The dashboard requires a project id and a client id from Google BigQuery to call on this database. All of these items are free to sign up for and instructions are available below.
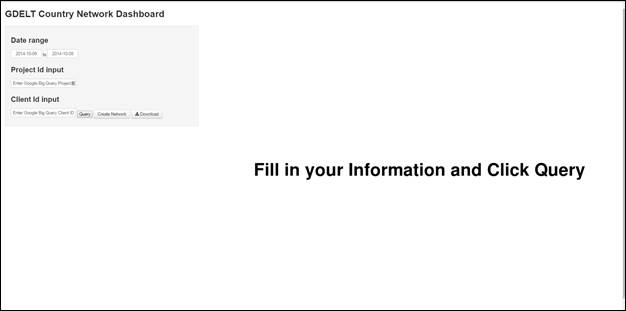
GDELT also offers a way to look at how the relationships between countries change over time. A second app studies these relationships and how they change over time. This app allows the user to choose a date range, and then view and download the network of countries for that date range. Countries are connected if they are actors in the same event and the connection is weighted by the mean of the Average Tone for each event. Instructions on how to use this app are available below.
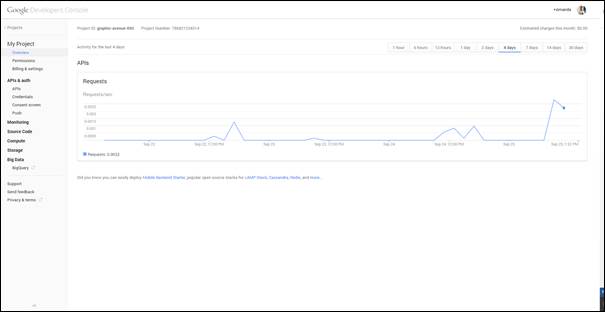
As I mentioned earlier, GDELT is housed on Google BigQuery. The dashboard requires a project id and a client id from Google BigQuery to call on this database. To use Google BigQuery, you must have a google account and then you must create a Developer account by going to http://console.developers.google.com.

You then have to create a project to hold your queries by clicking the Create Project button. After you create a project, you must activate the BigQuery API in your project by clicking on the project in the developer’s console, then clicking on APIs & auth, and then click APIs.
Make sure the switch next to BigQuery is on (if it isn’t, click it to turn it on).
Then, under APIs and auth, click Credentials.
Under OAuth, click Create New Client ID, and select Web Application and in the Authorized JavaScript Origins box paste (https://shiny.data-tactics-corp.com) and click Create Client ID. Then you have the project id and client id needed by the dashboard.
You will also need to make sure that an email and a product name are filled in on the Consent screen (Under APIs and auth).
This free BigQuery account has limits to the amount of queries one project can make in a day, so be mindful of that.
To use the GDELT-Board, fill in the information above the Query button and click the button. Then choose the data to display from the checkboxes and click the Update View button. If a table appears, you can click the Download button to download a .csv file of the data you displayed.
To use the GDELT Country Network Dashboard, the user inputs the date range they are interested in, their Project ID, and their Client ID, and Click Query. The App then sends your query to Google BigQuery. Once the query has returned, the Screen asks the user to “Click Create Network”. The network is created from the Google BigQuery data and is then displayed with each country colored by the weight of their connections (red to violet). The user can then download a CSV file of the network they just created for further analysis in any network analysis product they choose.
Don’t forget to tweet me (@altraud) pictures made using these Apps and Happy Data Hunting! Or, if you want to find out more about data science at L-3 please tweet (@rheimann) or email Richard Heimann, Chief Data Scientist (Richard.Heimann@l-3com.com). Our special thanks to Kalev H. Leetaru and GDELT.