To what degree was Twitterverse discussion about Donald Trump driven by the volume of his own tweeting? Did increased @realDonaldTrump tweeting leading to more mentions about him and less tweeting by him to a reduction in total mentions of him? If so, that would suggest he was directly driving the discussion about himself simply by the volume of his messaging. If there is less coupling, that would suggest coverage was driven by the specifics of what he was saying and his actions rather than his increased or decreased tweeting volume.
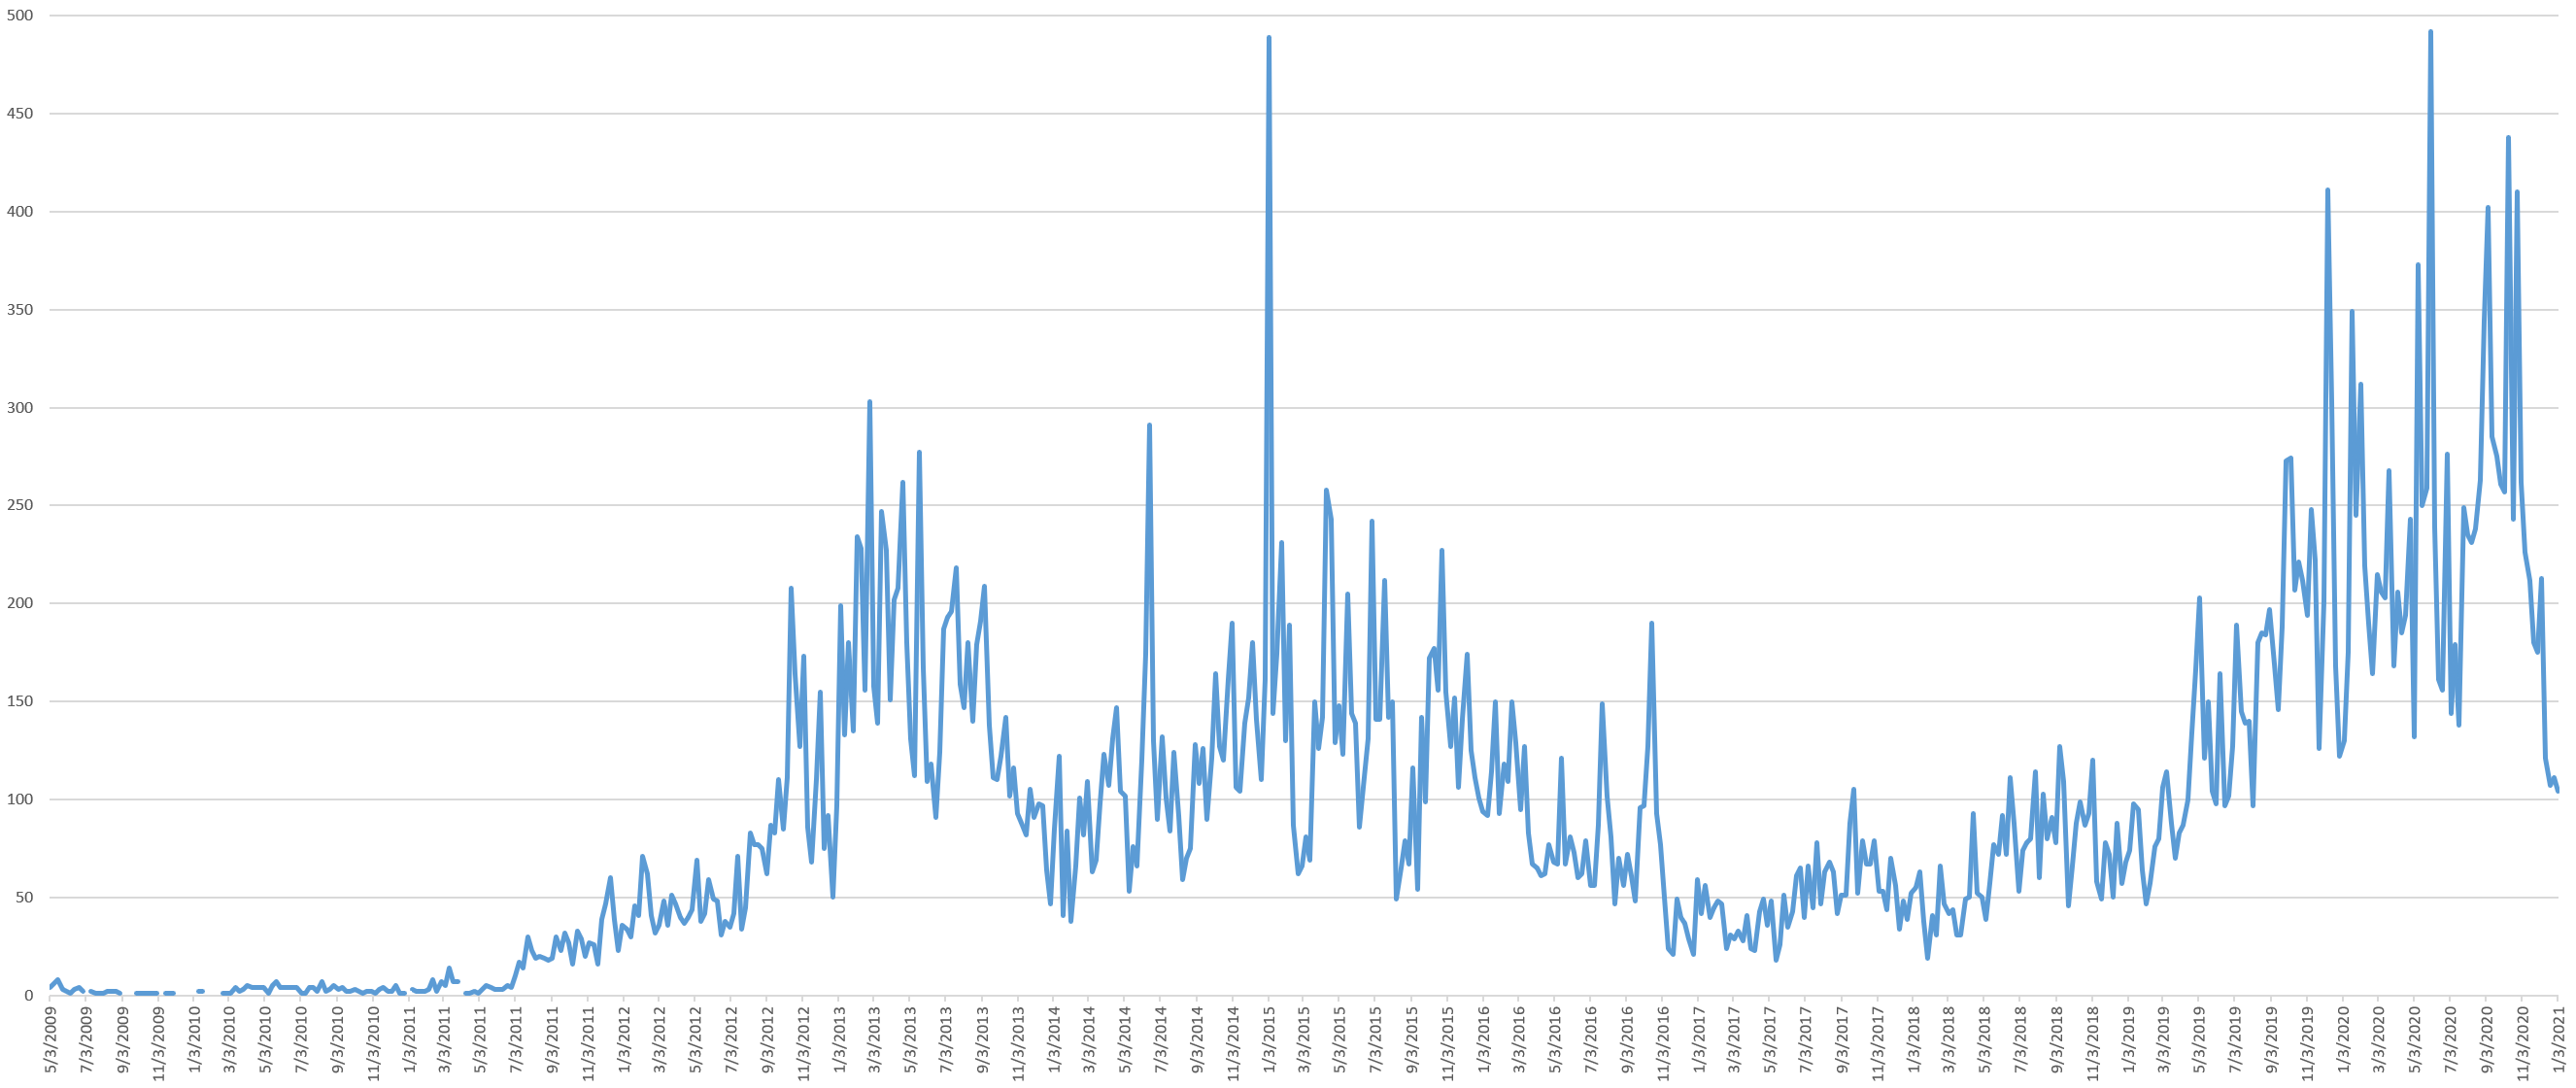
The timeline below shows the total number of weekly tweets sent by @realDonaldTrump since his first tweet in May 2009 through his January 2021 ban.
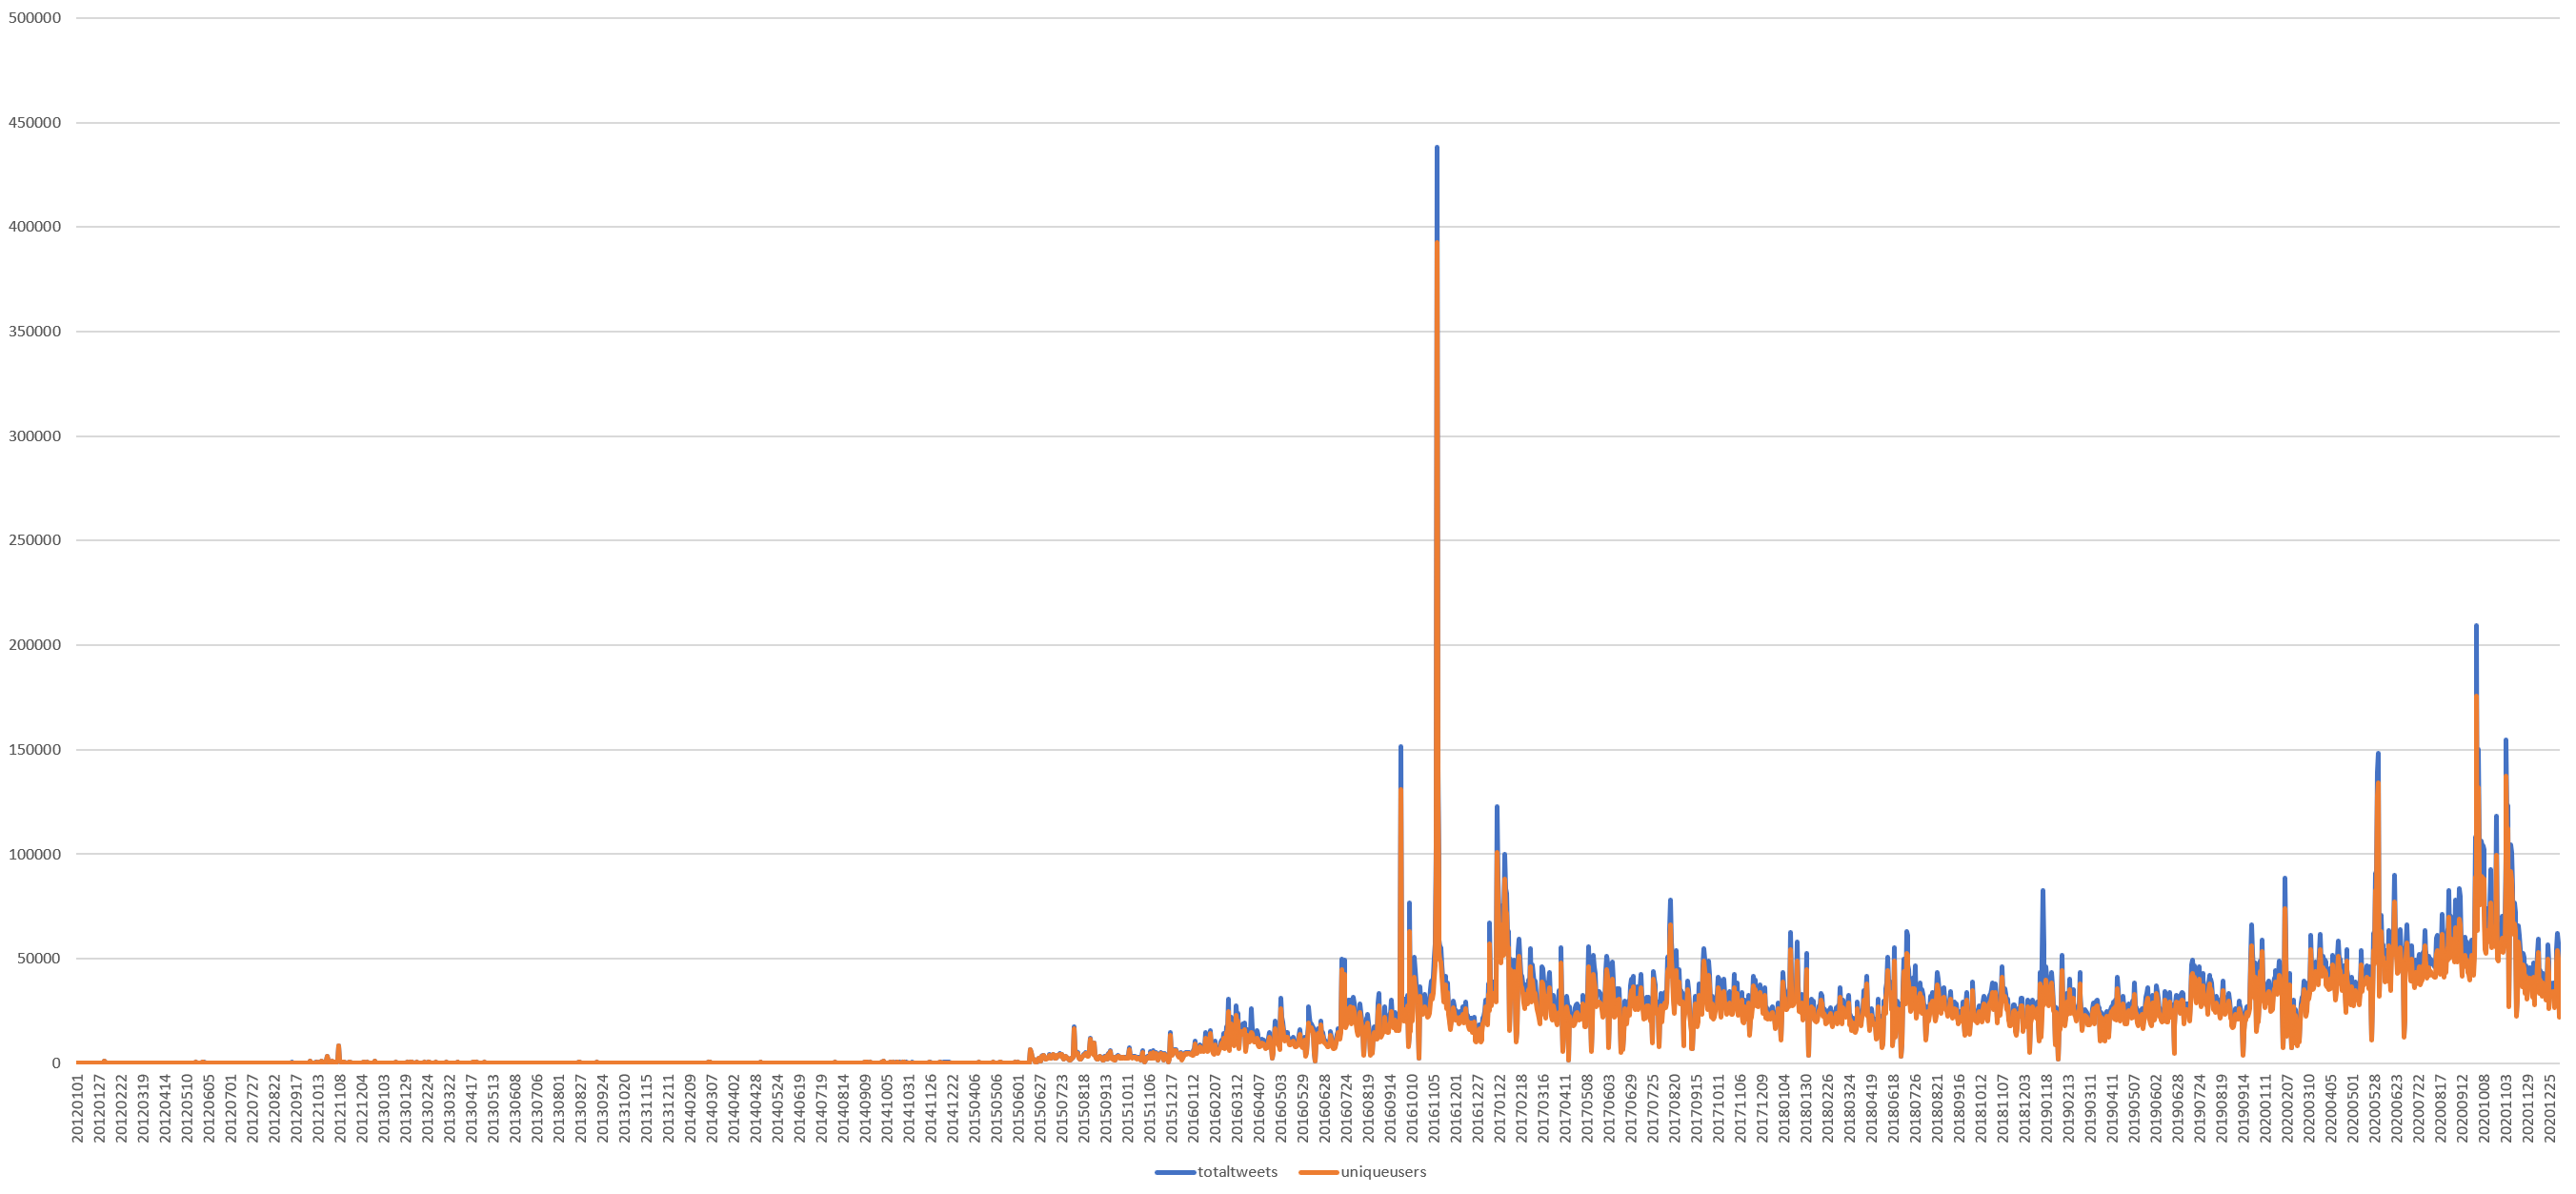
In contrast, the timeline below shows the total number of tweets containing the string "trump" in the Twitter 1% stream from January 1, 2012 through January 5, 2021. Remember that the Y axis reflects that this is a random sample of just 1% of all daily tweets. Note immediately how despite Trump making heavy use of his account from early 2011 through May 2015, he received few mentions at large on Twitter. Clearly in his pre-candidate stage his tweets were not driving an extended conversation about him.
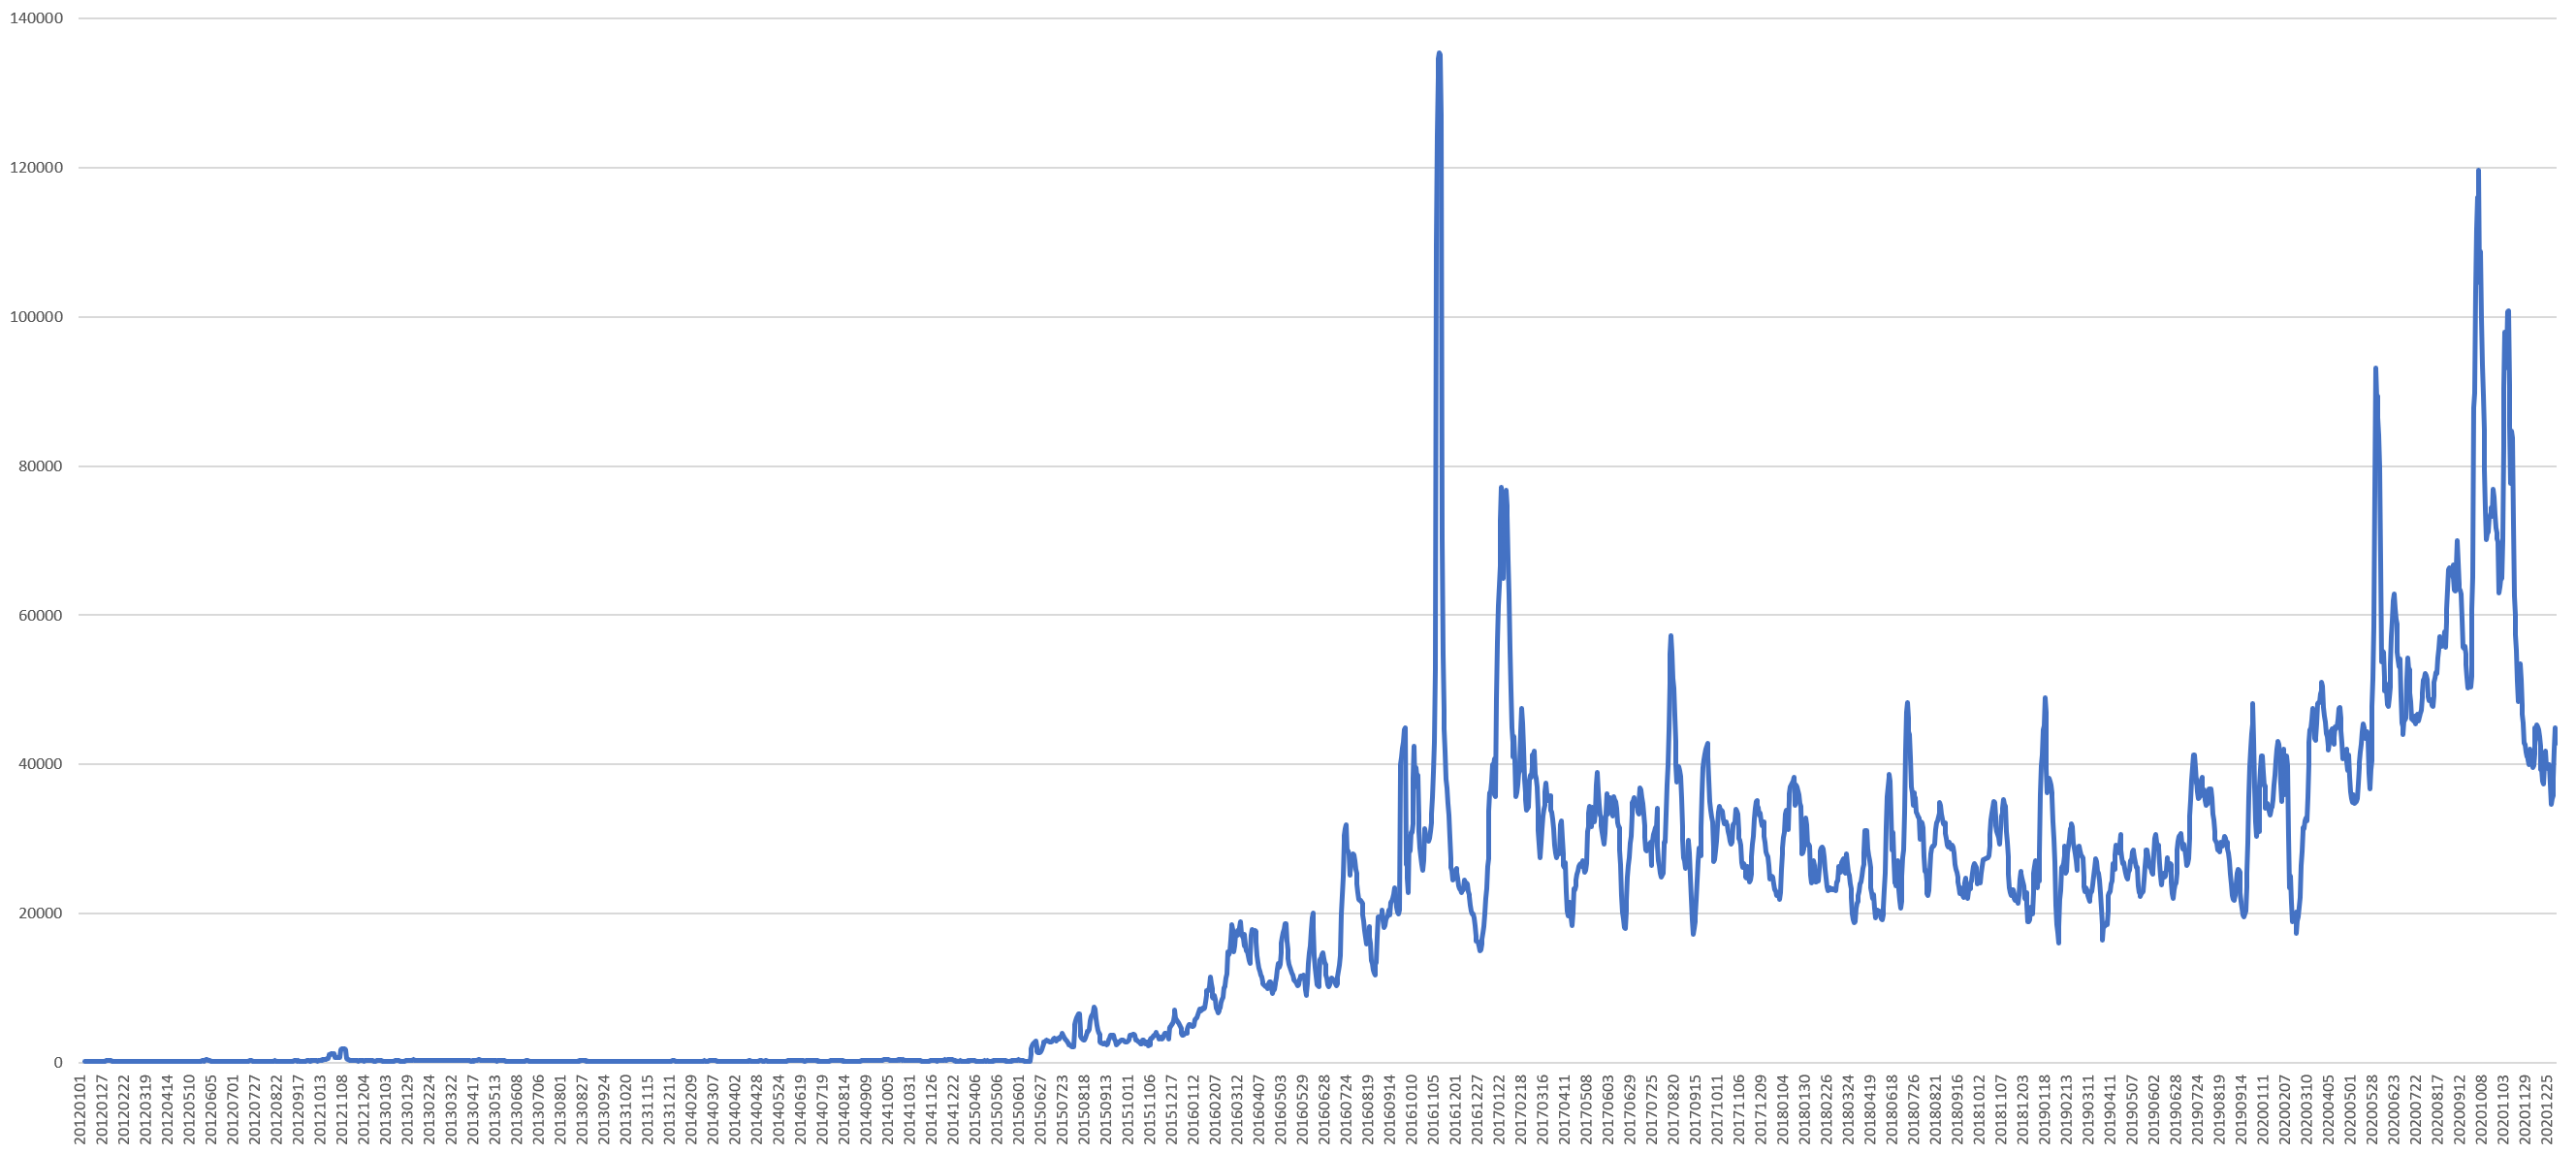
The timeline below shows the same graph as above, but smoothed to make its patterns clearer.
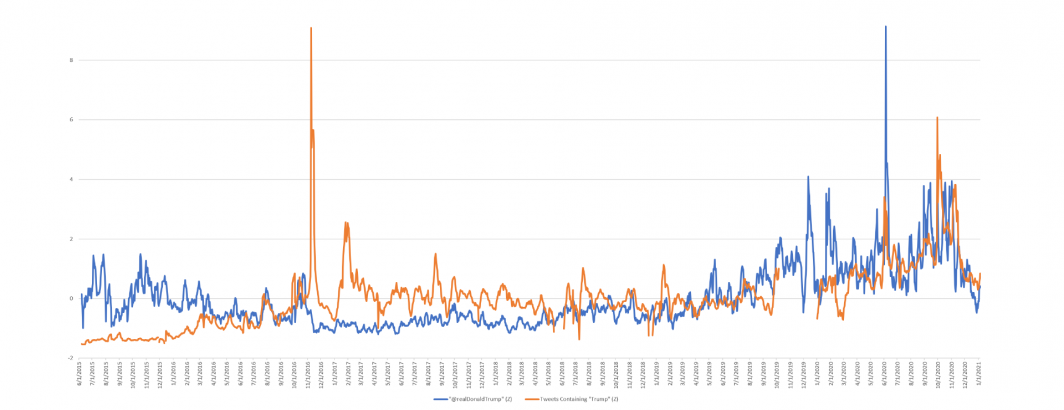
The timeline below compares the two timelines using Z-scores (standard deviations from the mean) using a 7-day rolling average to smooth the data. The blue line is the trend curve for the daily number of tweets from @realDonaldTrump, while the orange line is the trendline for all mentions of "trump" in the 1% Twitter stream. Since these are Z-scores, the Y axis represents the standard deviations from the mean, rather than counts.
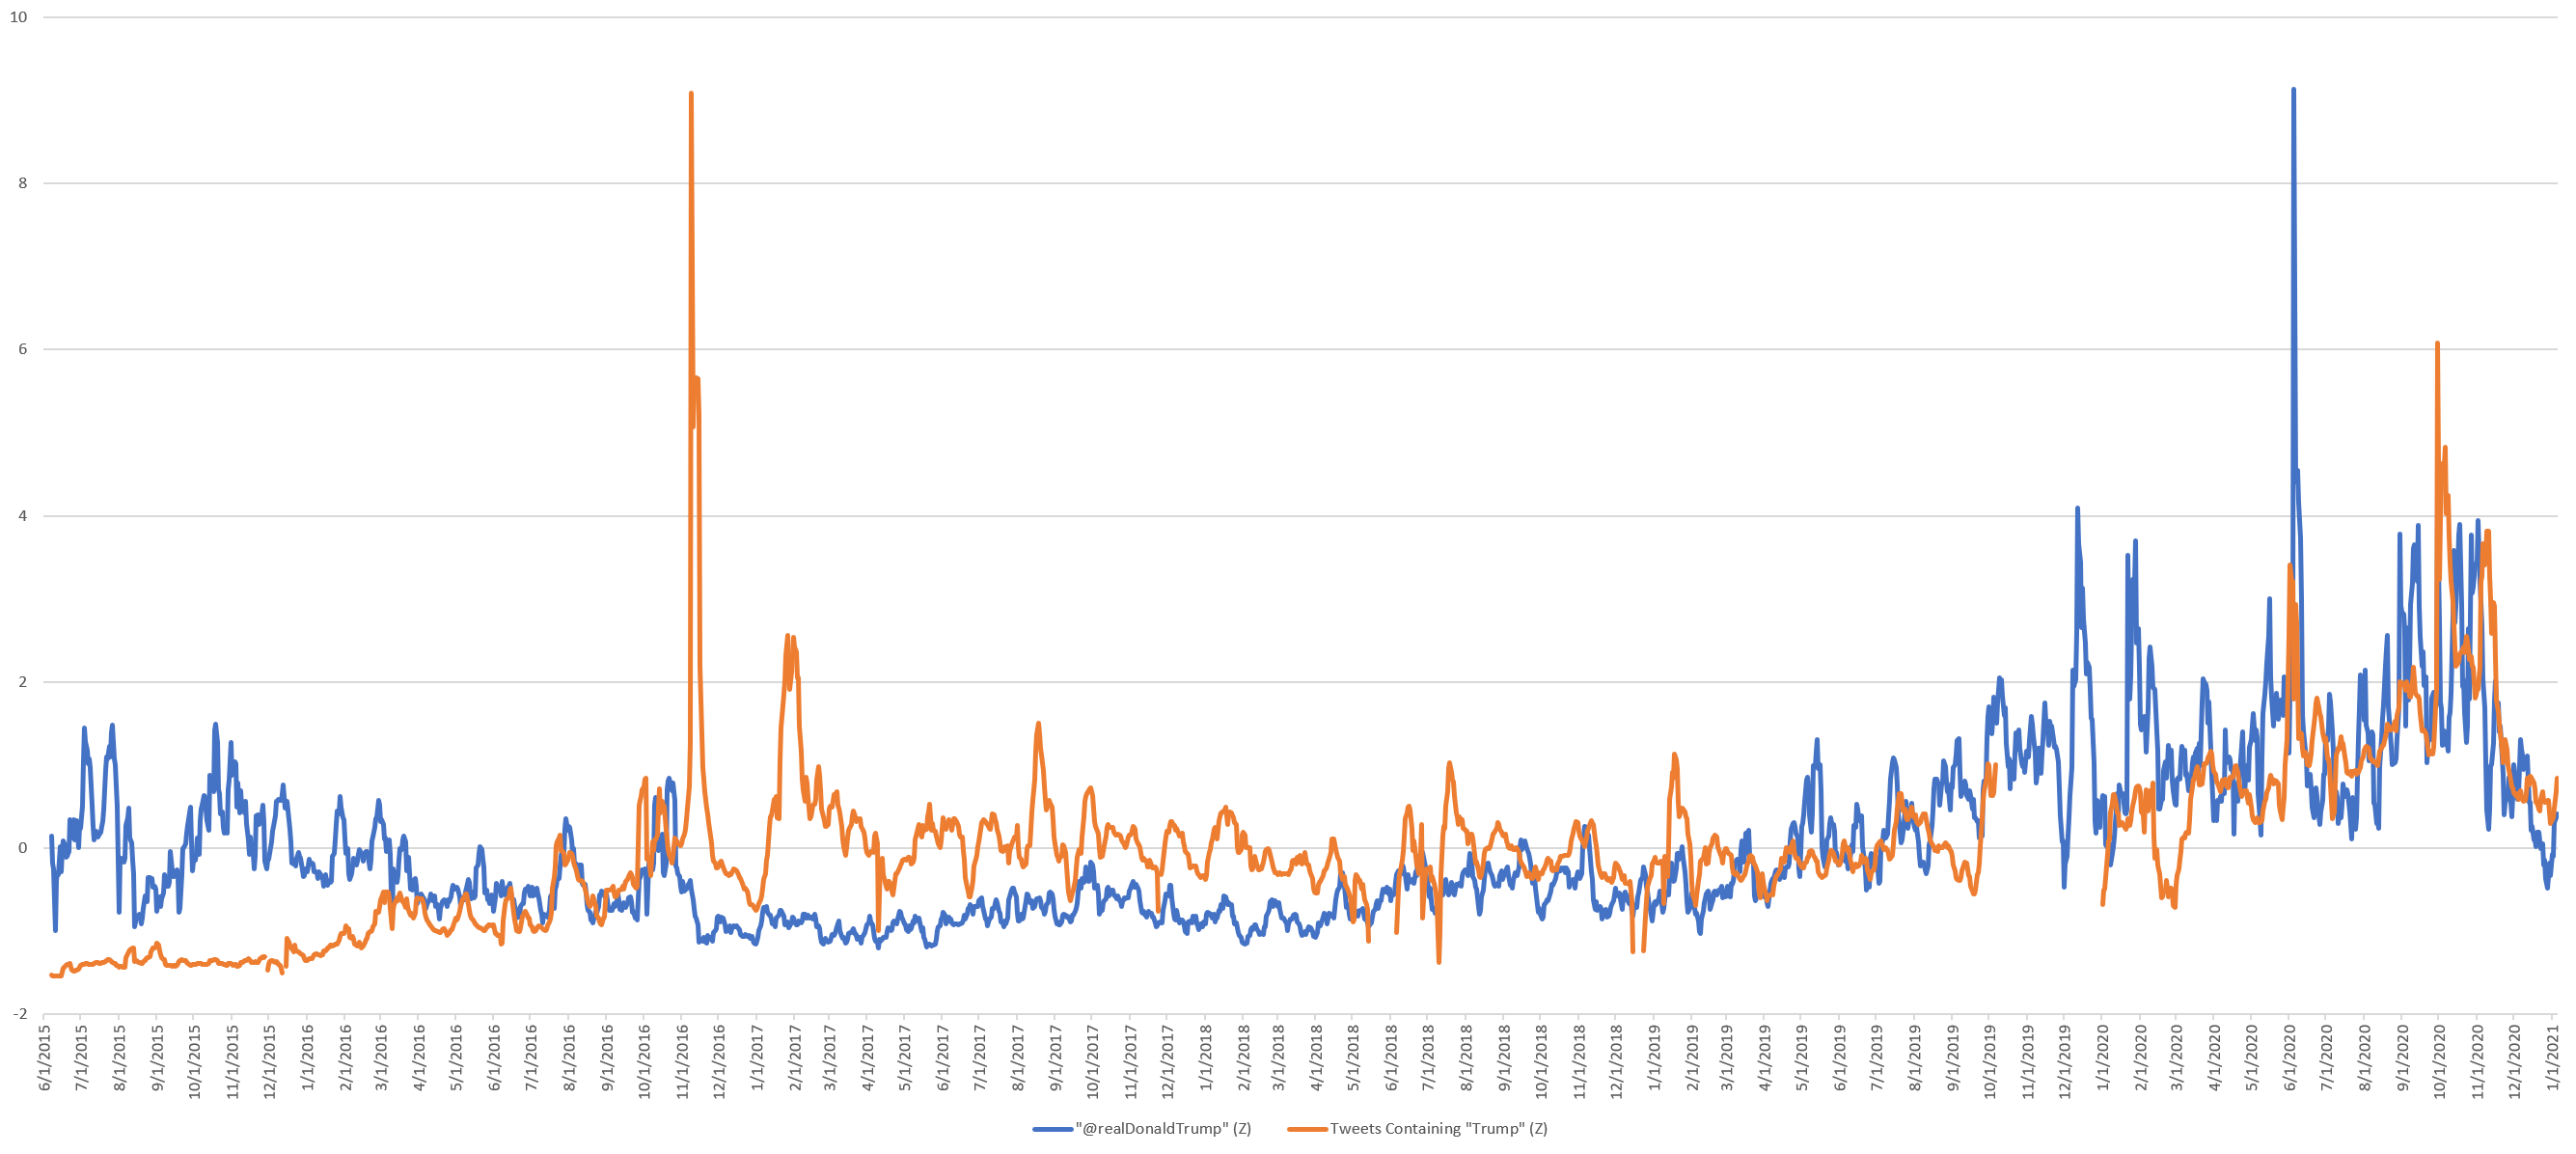
Immediately clear is that there is little similarity until until late 2018 when they move in closer sync, but while they both head upwards along a relatively similar arc, their day-to-day movements (even using a 7-day rolling average) are fairly different.
The Pearson correlation of the two timelines from June 1, 2015 through January 5, 2021 is r=0.39, while their correlation from January 1, 2019 through January 5, 2021 is r=0.34.
In short, while both trended upwards since late 2019, their day-to-day movements are largely out of sync, especially spikes and troughs. This suggests that it was not the volume of Trump's tweets that drove the volume of the discourse around him. He could not increase mentions simply by tweeting more. It was the specifics of those messages and his offline words and actions that drove the discourse. While unsurprising, this does show the limits of purely volume-based driving effects.