Using deep learning algorithms to read through a decade of closed captioning transcripts and compile a list of all of the topics and things they found mentioned within, what new insights can we derive regarding what evening news broadcasts have focused on over the past 10 years?
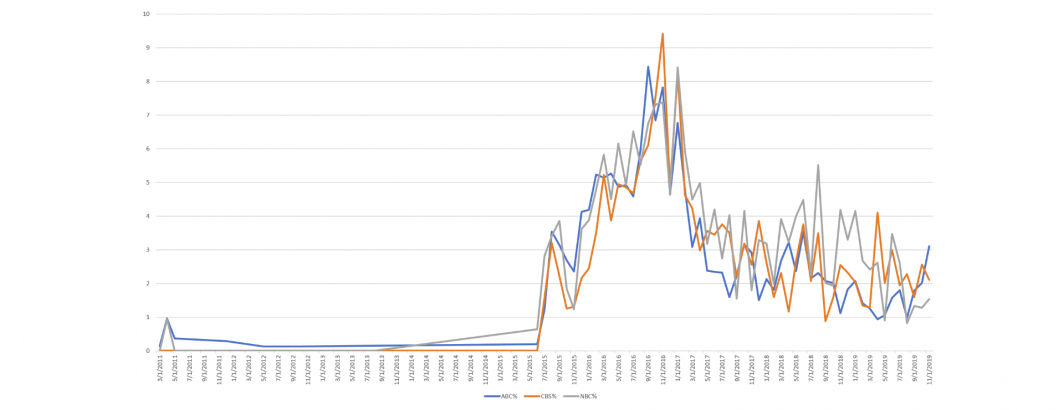
Donald Trump has unsurprisingly dominated, but mentions of him have faded from his post-election peak:
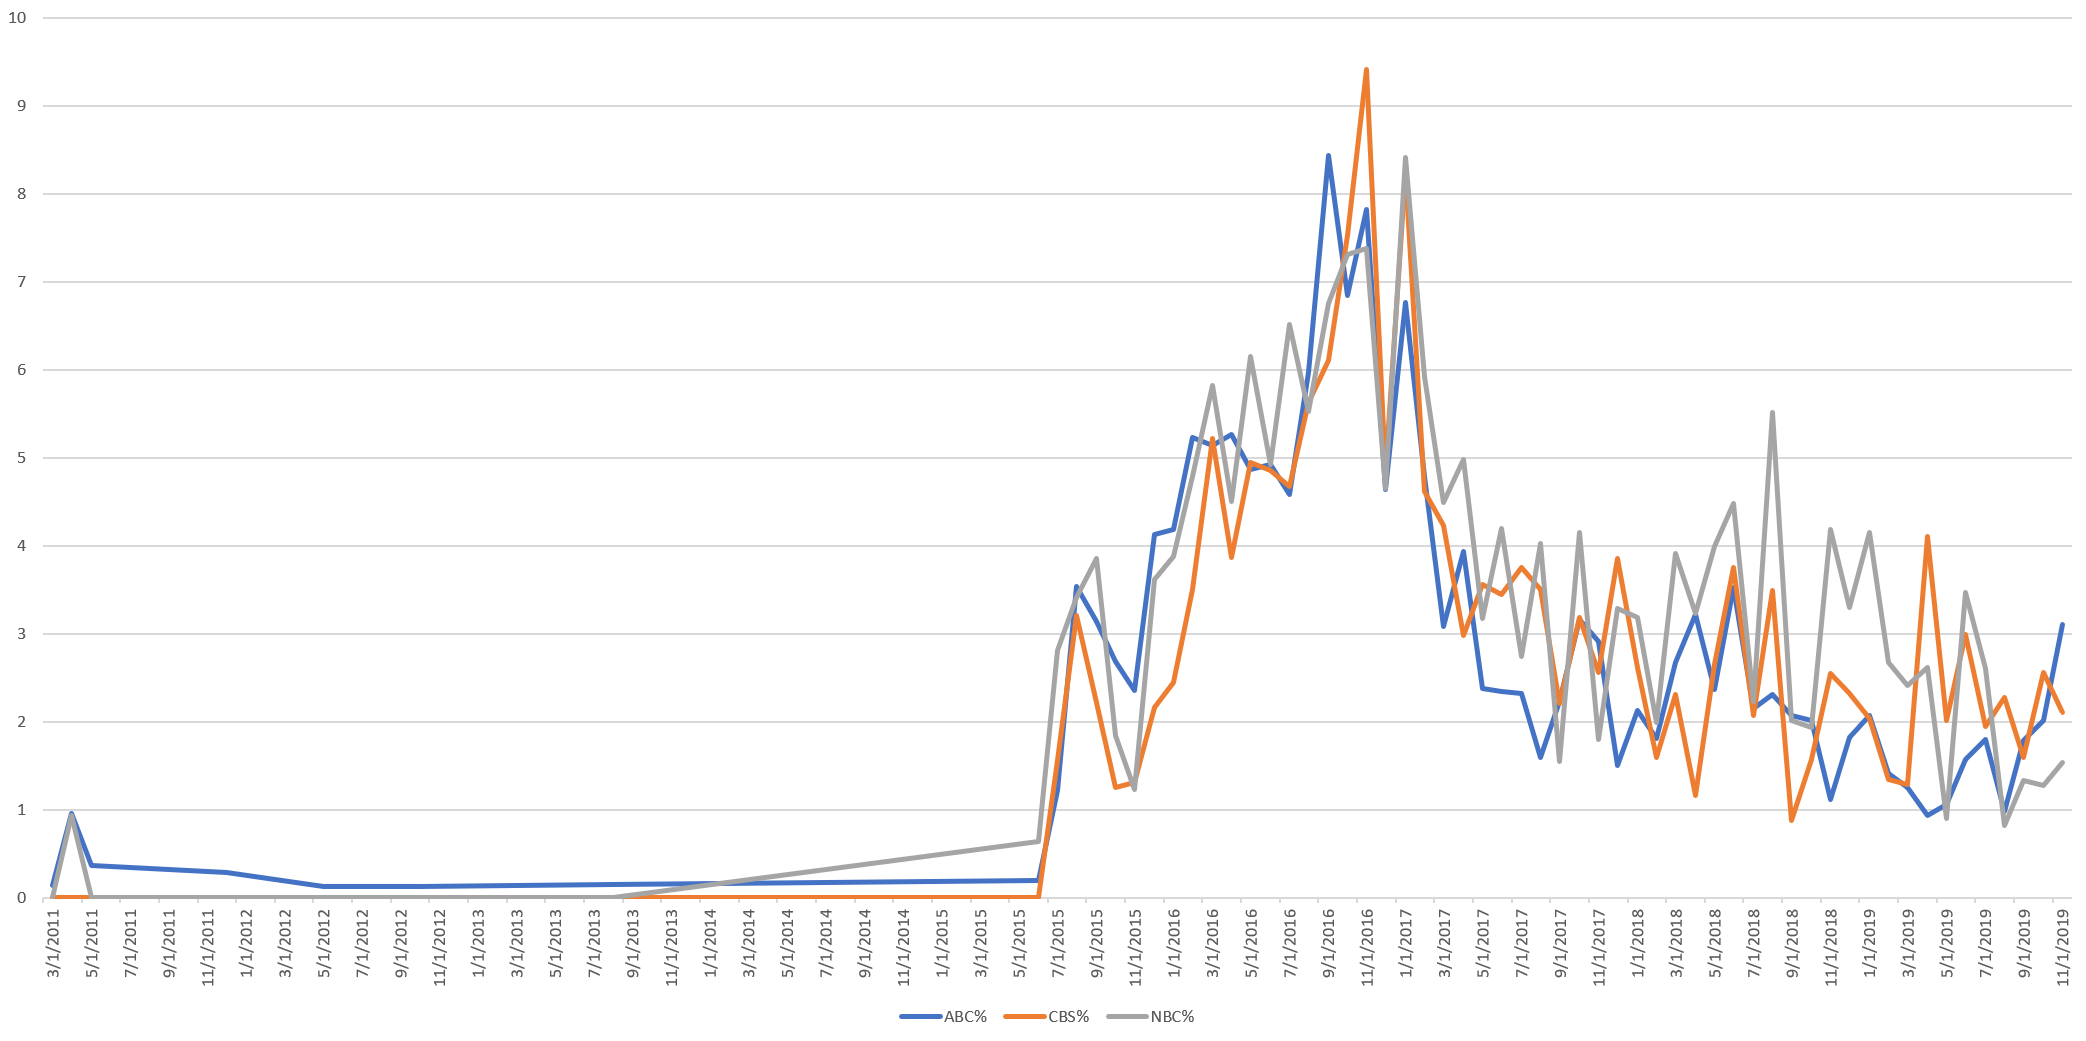
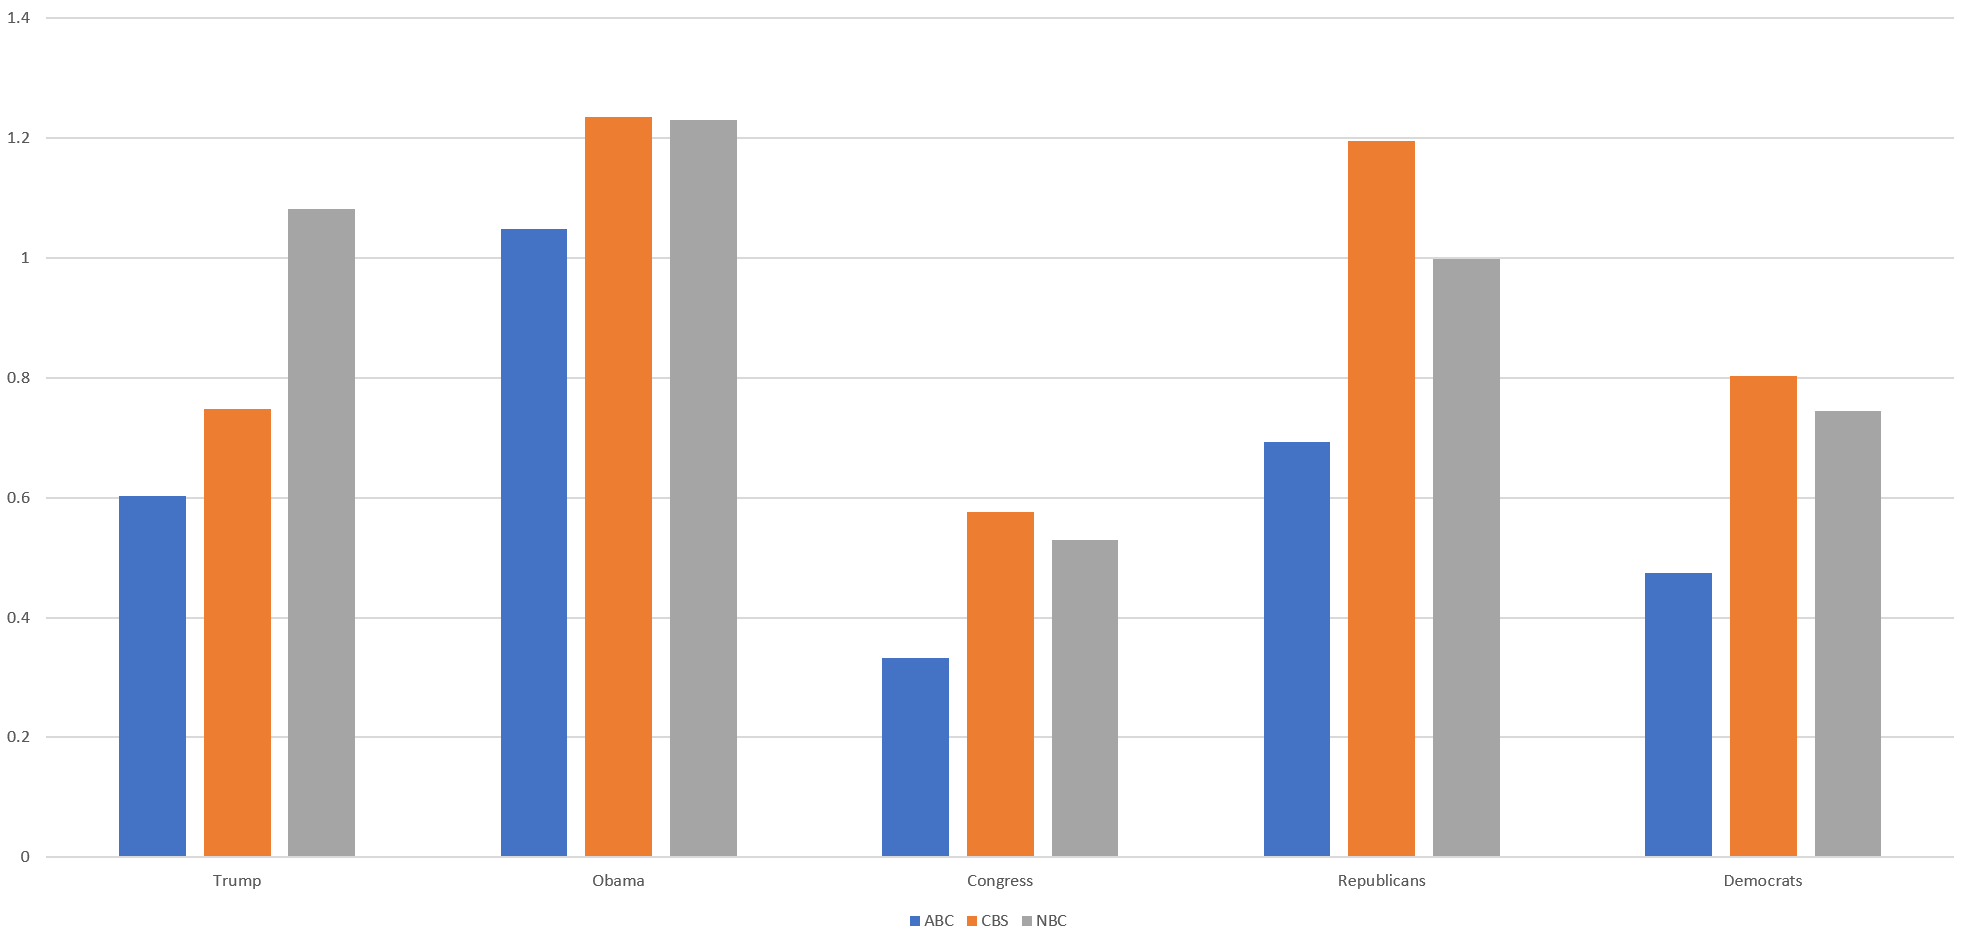
Barack Obama received steadily less coverage through his two terms and unsurprisingly has largely faded from mention after he left office.
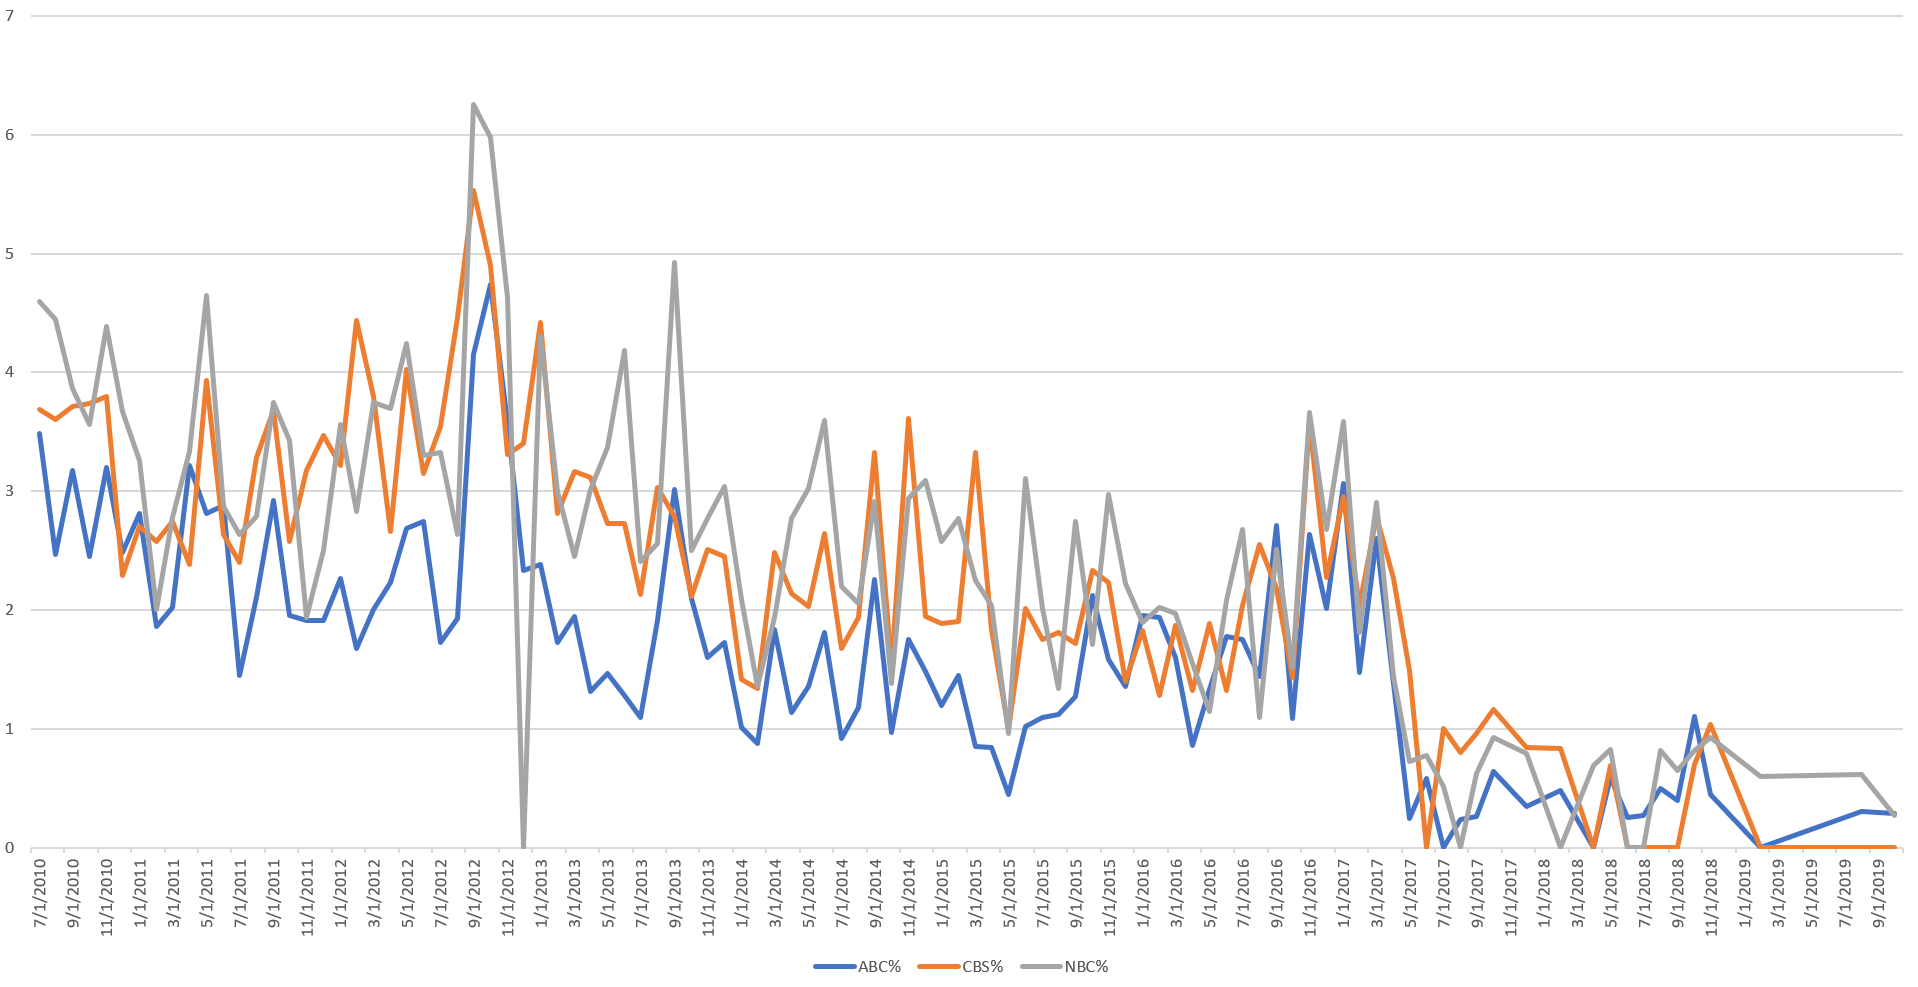
Mentions of the Republican Party are back, though have decreased in 2019:
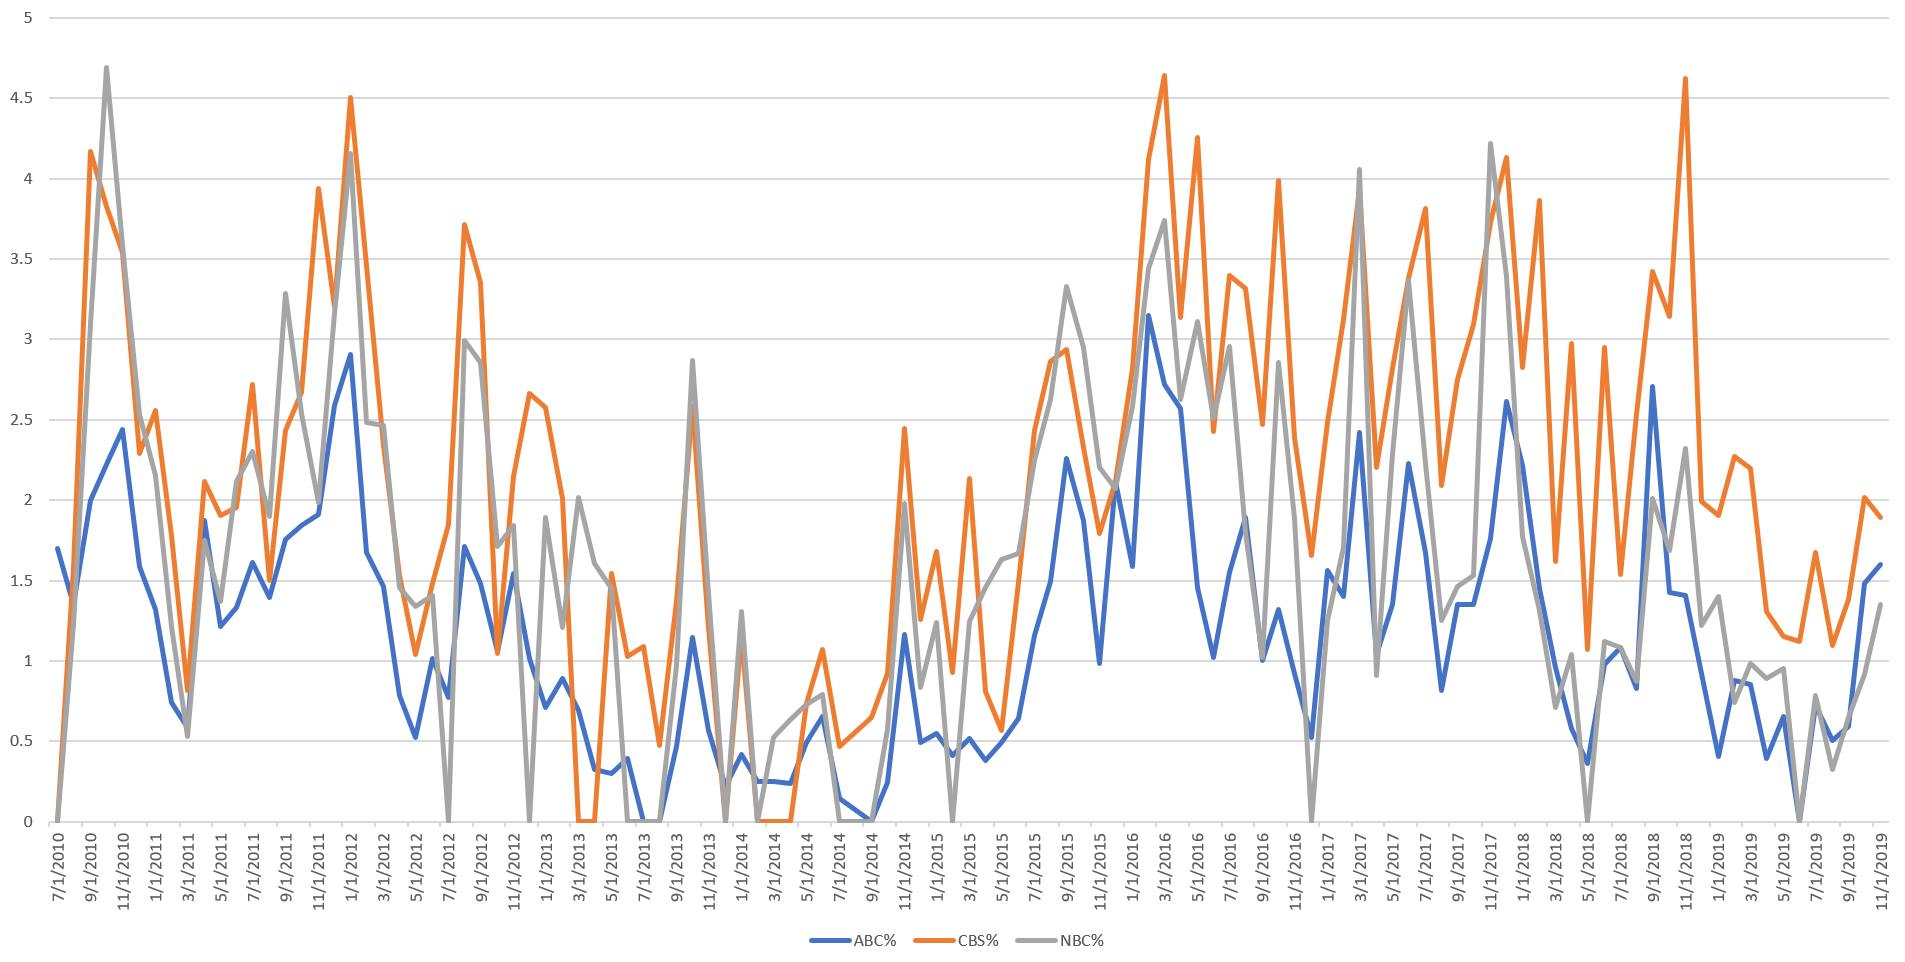
In contrast, mentions of the Democratic Party have soared since mid-2015:
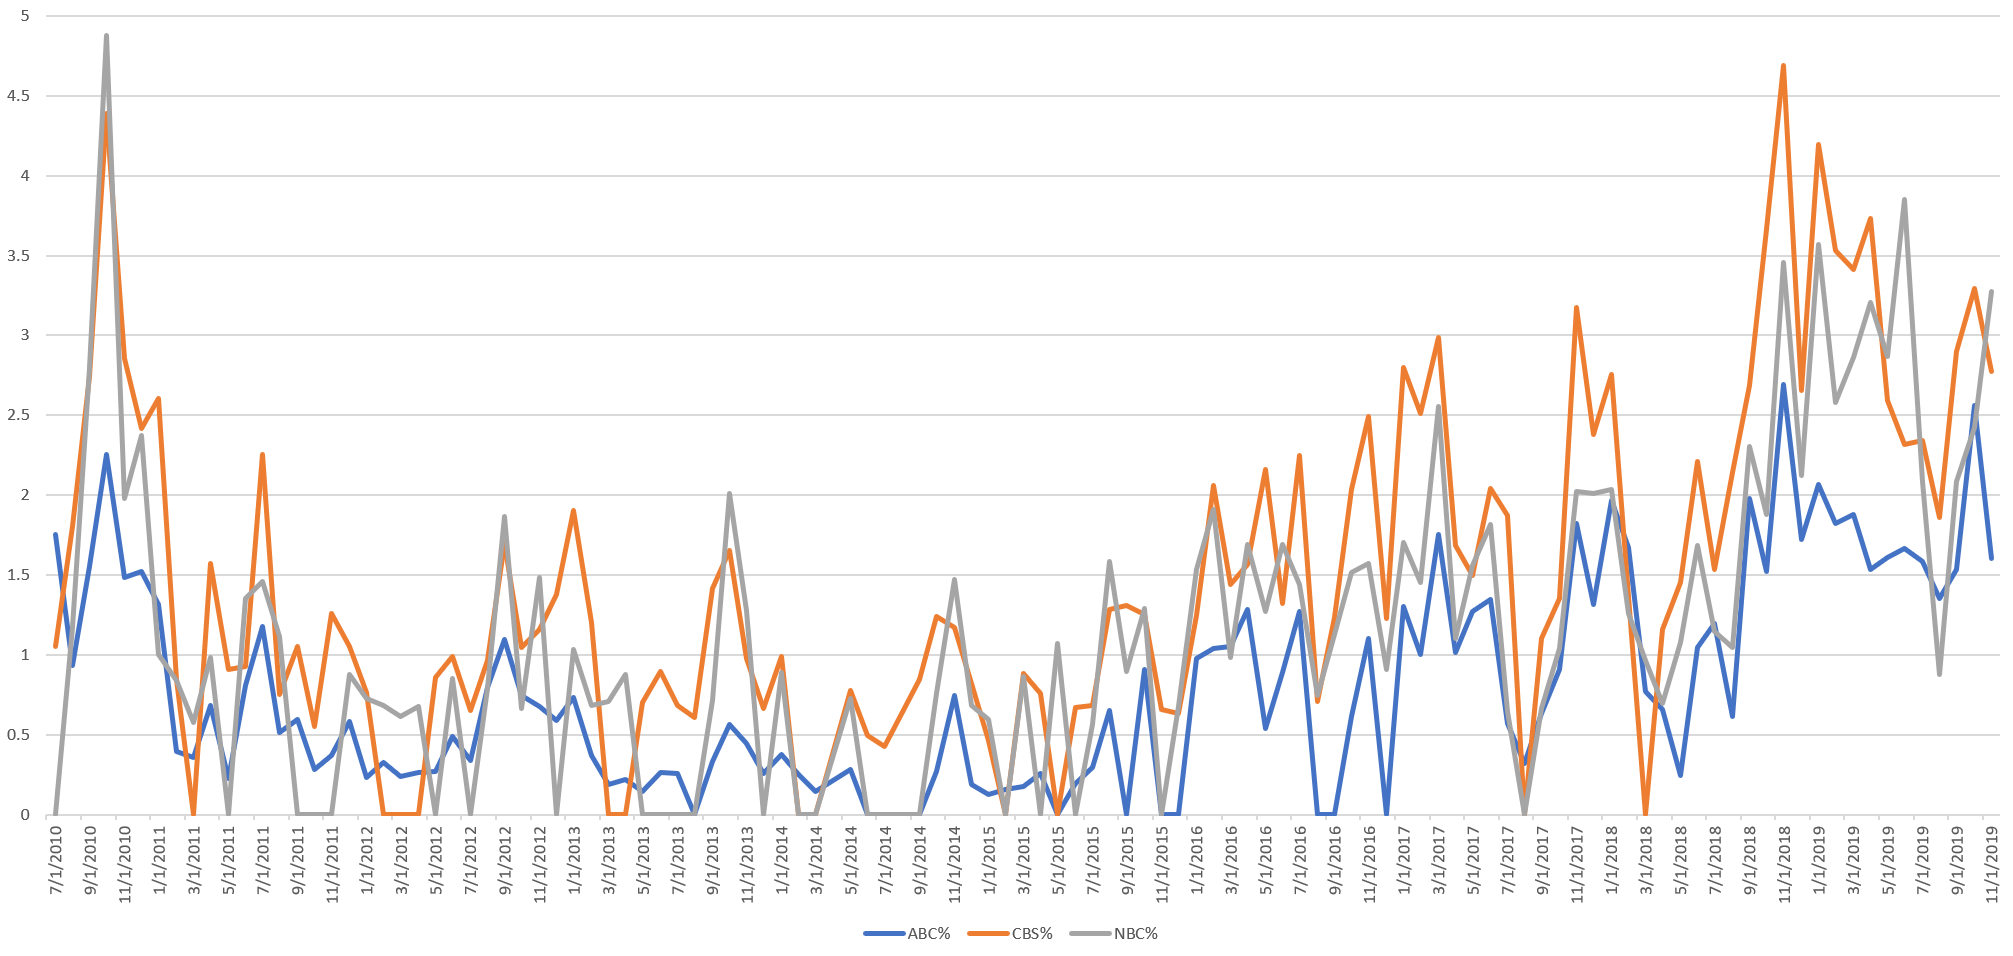
The chart below shows the breakdown of these mentions over the past 10 years across the three stations using their GEG entities:
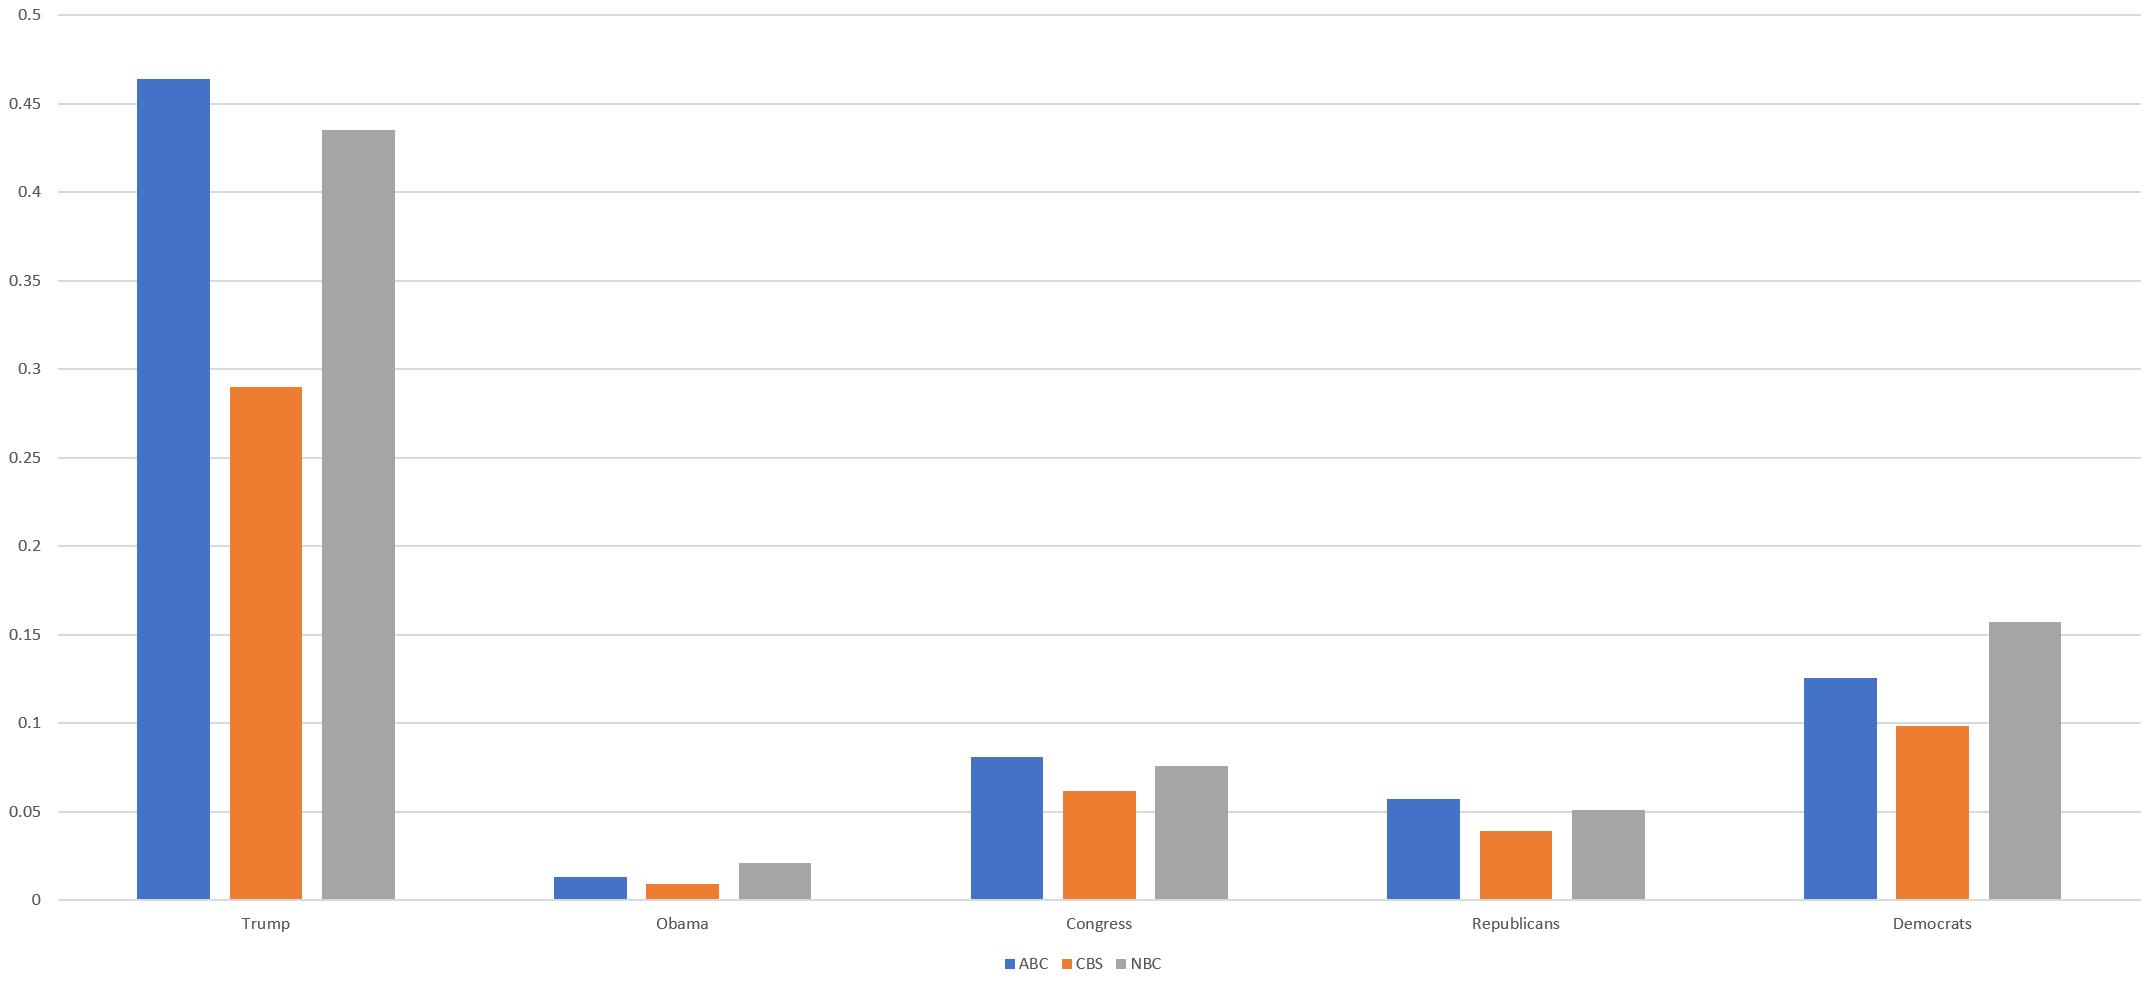
The graph below shows their breakdown in 2019 using the Television Explorer (ABC / CBS / NBC):
TECHNICAL DETAILS
Constructing the entity timelines above required just a single SQL query. The complexity of the query below comes from the fact that it runs two queries, one for the entity and one for all entity mentions and combines them to compute the entity's mentions as a percentage of all entity mentions. While this query could likely be substantially optimized, the version below makes the working components of the query more visible.
WITH

data_entity AS (
SELECT TIMESTAMP_TRUNC(date, MONTH) date, Station, entities.mid entity, count(1) count FROM `gdelt-bq.gdeltv2.geg_iatv`, unnest(entities) entities where entities.mid ='/m/0d075m' group by date, Station, entities.mid
),

data_all AS (
SELECT TIMESTAMP_TRUNC(date, MONTH) date, Station, entities.mid entity, count(1) count FROM `gdelt-bq.gdeltv2.geg_iatv`, unnest(entities) entities where entities.mid is not null group by date, Station, entities.mid
),

sheet_entity AS (
select DATE(date) date, SUM(ABC) ABC, SUM(CBS) CBS, SUM(NBC) NBC from (
(SELECT date, 0 CNN, 0 MSNBC, 0 FOXNEWS, 0 BBCNEWS, count ABC, 0 CBS, 0 NBC FROM data_entity where count > 10 and Station='KGO')
UNION ALL
(SELECT date, 0 CNN, 0 MSNBC, 0 FOXNEWS, 0 BBCNEWS, 0 ABC, count CBS, 0 NBC FROM data_entity where count > 10 and Station='KPIX')
UNION ALL
(SELECT date, 0 CNN, 0 MSNBC, 0 FOXNEWS, 0 BBCNEWS, 0 ABC, 0 CBS, count NBC FROM data_entity where count > 10 and Station='KNTV')
) GROUP BY date
),

sheet_all AS (
select DATE(date) date, SUM(ABC) ABC, SUM(CBS) CBS, SUM(NBC) NBC from (
(SELECT date, 0 CNN, 0 MSNBC, 0 FOXNEWS, 0 BBCNEWS, count ABC, 0 CBS, 0 NBC FROM data_all where count > 10 and Station='KGO')
UNION ALL
(SELECT date, 0 CNN, 0 MSNBC, 0 FOXNEWS, 0 BBCNEWS, 0 ABC, count CBS, 0 NBC FROM data_all where count > 10 and Station='KPIX')
UNION ALL
(SELECT date, 0 CNN, 0 MSNBC, 0 FOXNEWS, 0 BBCNEWS, 0 ABC, 0 CBS, count NBC FROM data_all where count > 10 and Station='KNTV')
) GROUP BY date
)

select a.date, SAFE_DIVIDE(a.ABC,b.ABC) * 100 ABCPerc, SAFE_DIVIDE(a.CBS,b.CBS) * 100 CBSPerc, SAFE_DIVIDE(a.NBC,b.NBC) * 100 NBCPerc from sheet_entity a JOIN sheet_all b ON a.date=b.date order by a.date asc
Hopefully these examples offer you a template for exploring the dataset!