Using the new Web News Ngram (WEB-NGRAM) dataset, it takes just a single line of SQL and Google BigQuery to perform sentiment mining across 46 billion words of global online news coverage. Simple create a new BigQuery table and fill it with a list of words from any sentiment dictionary of interest, then run the query below to apply it to 22 billion words of English news content January 1, 2019 to present with just a single SQL query taking just 27 seconds!
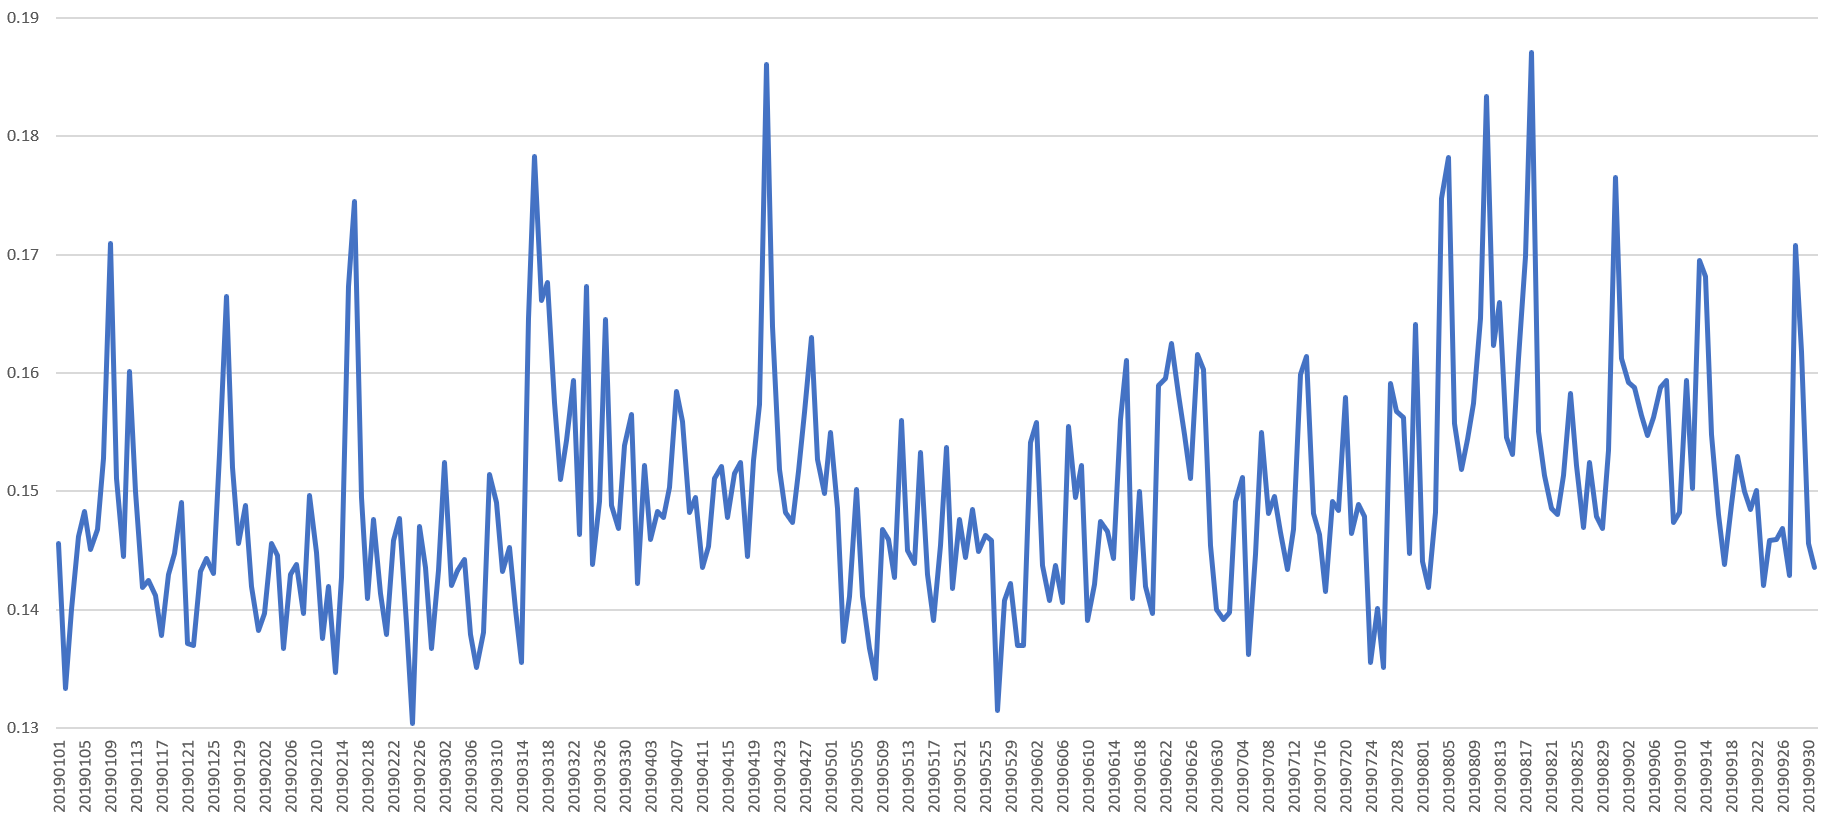
Using our earlier example from TV News Ngrams, are the results of plotting the intensity of "anxiety" in worldwide English language online news coverage from January 1, 2019 through September 30, 2019 using Colin Martindale's Regressive Imagery Dictionary (RID).
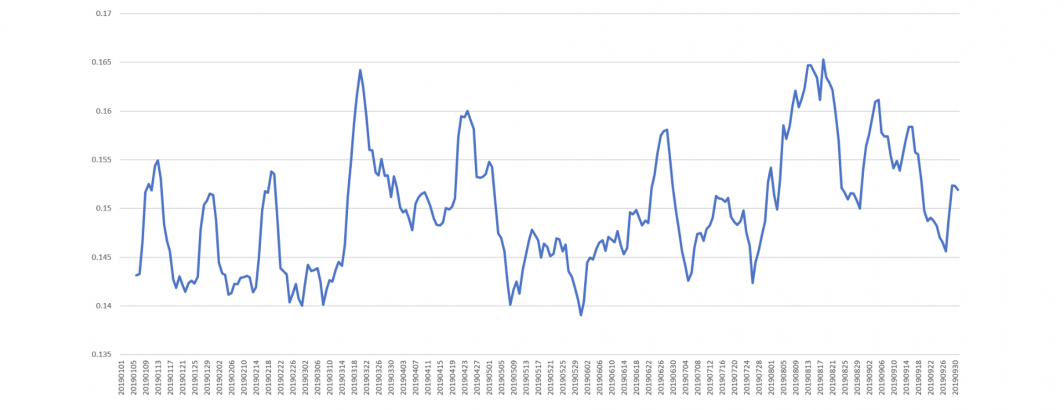
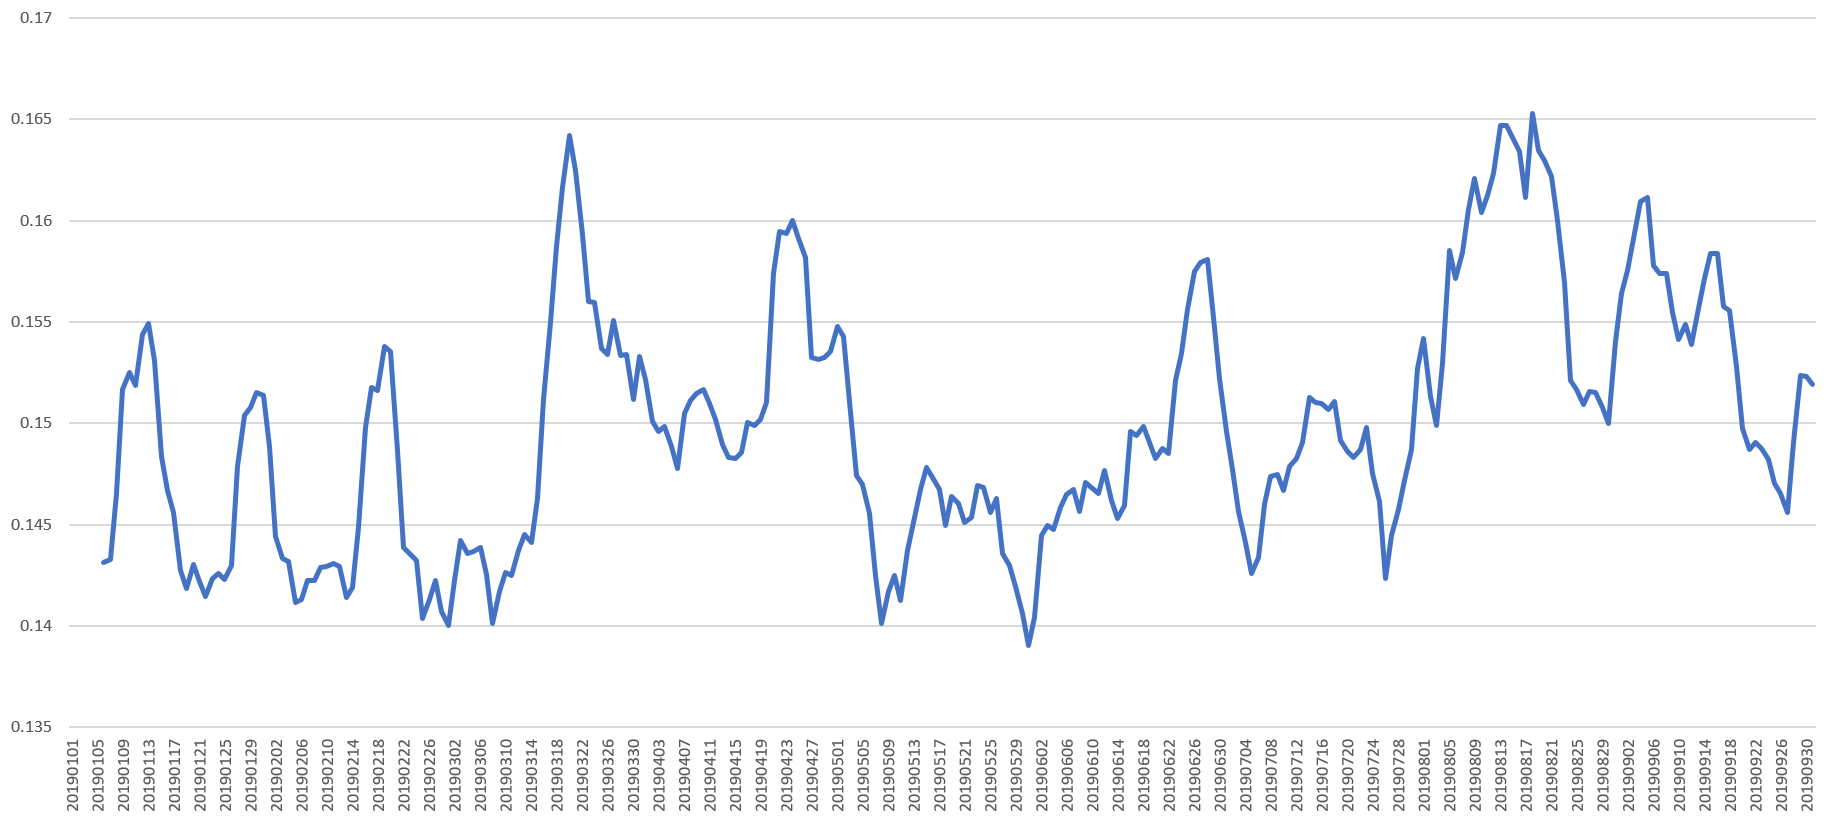
To make the trends more visible, here is the same graph using a 7-day rolling average to smooth the timeline and make its trends more visible.
TECHNICAL DETAILS
Here is the query used to create the graph above (substitute in your own sentiment dictionary).
SELECT DATE, SUM(TOTMENTIONS) TOTWORDS, SUM(TONECOUNT) TOTTONEWORDS, SUM(TONECOUNT) / SUM(TOTMENTIONS) * 100 perc_anxiety from (
SELECT SUBSTR(CAST(DATE AS STRING), 0, 8) DATE, SUM(COUNT) TOTMENTIONS, SUM(COUNT) TONECOUNT FROM `gdelt-bq.gdeltv2.web_1grams` where LANG='ENGLISH' and NGRAM in (SELECT WORD FROM `YOUR-SENTIMENT-TABLE`) group by DATE, NGRAM
UNION ALL
SELECT SUBSTR(CAST(DATE AS STRING), 0, 8) DATE, SUM(COUNT) TOTMENTIONS, 0 TONECOUNT FROM `gdelt-bq.gdeltv2.web_1grams` where LANG='ENGLISH' and NGRAM not in (SELECT WORD FROM `YOUR-SENTIMENT-TABLE`) group by DATE, NGRAM
) group by DATE order by DATE asc