The new Television News Ngram Datasets make an incredible range of new analyses possible. With just a single line of SQL and Google BigQuery, it is possible to perform sentiment mining across a decade of television news. Simple create a new BigQuery table and fill it with a list of words from any sentiment dictionary of interest, then run the query below to apply it to CNN's coverage over the past decade, computing the density of those words in its closed captioning, all within just 9.3 seconds!
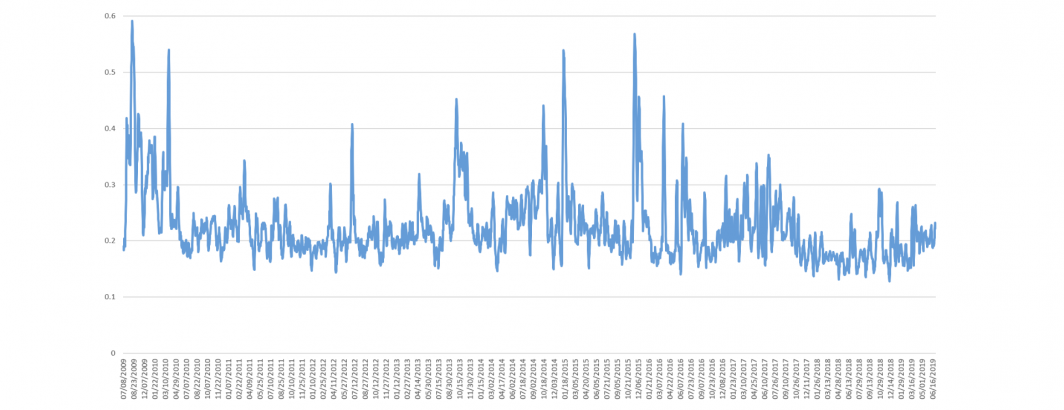
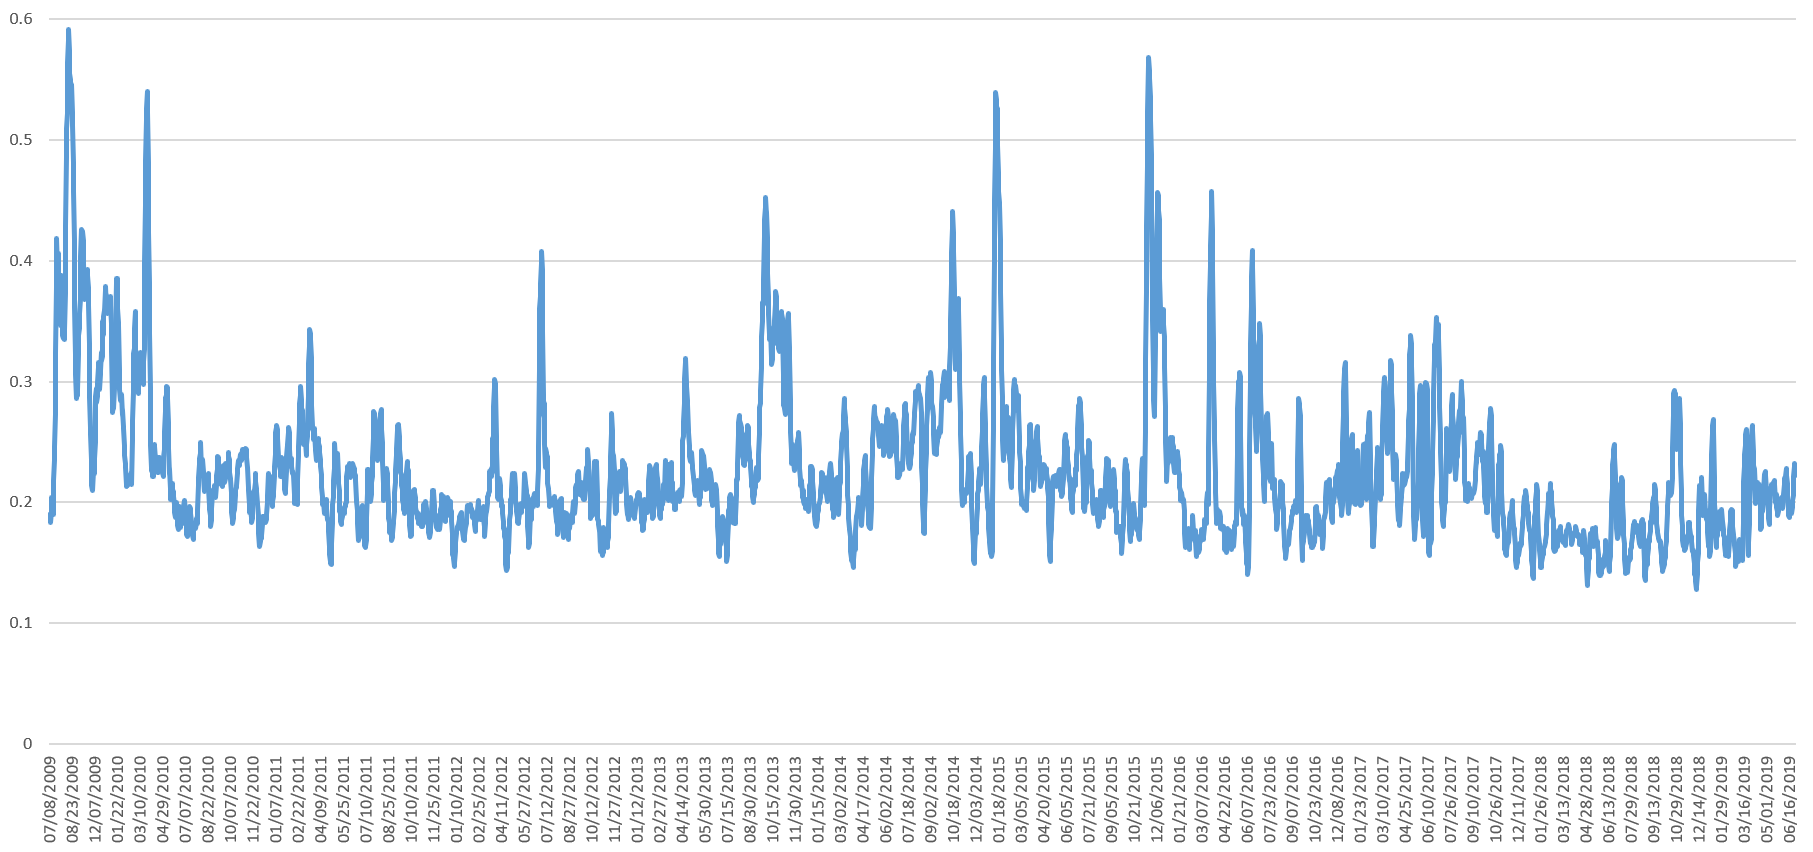
Here are the results of plotting the intensity of “anxiety” in CNN’s coverage from July 2, 2009 to June 30, 2019 using Colin Martindale's Regressive Imagery Dictionary (RID) using a 7-day rolling average to smooth the timeline and make its trends more visible.
TECHNICAL DETAILS
Here is the query used to create the graph above (substitute in your own sentiment dictionary).
SELECT DATE, SUM(COUNT) TOTWORDS, SUM(TONECOUNT) TOTTONEWORDS, SUM(TONECOUNT) / SUM(COUNT) * 100 perc_anxiety from (
SELECT DATE, WORD, COUNT, COUNT TONECOUNT FROM `gdelt-bq.gdeltv2.iatv_1grams` WHERE STATION='CNN' and WORD in (SELECT WORD FROM `YOUR-SENTIMENT-TABLE`)
UNION ALL
SELECT DATE, WORD, COUNT, 0 TONECOUNT FROM `gdelt-bq.gdeltv2.iatv_1grams` WHERE STATION='CNN' and WORD not in (SELECT WORD FROM `YOUR-SENTIMENT-TABLE`)
) group by DATE order by DATE asc