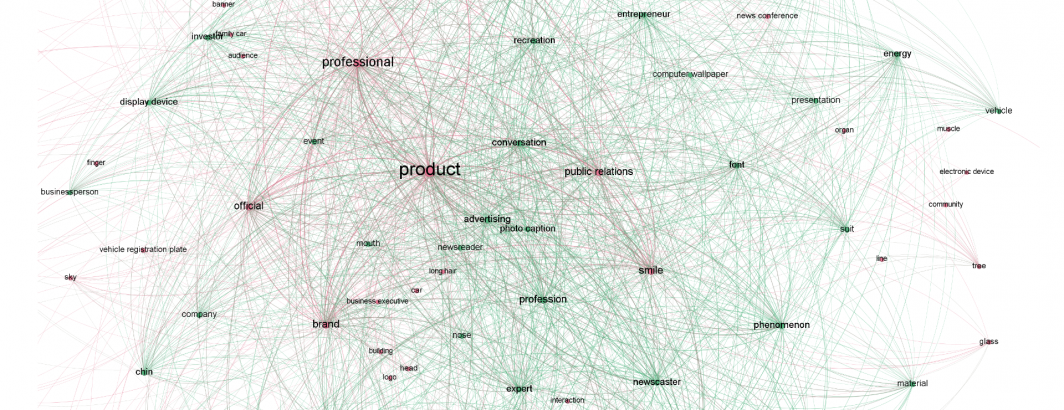
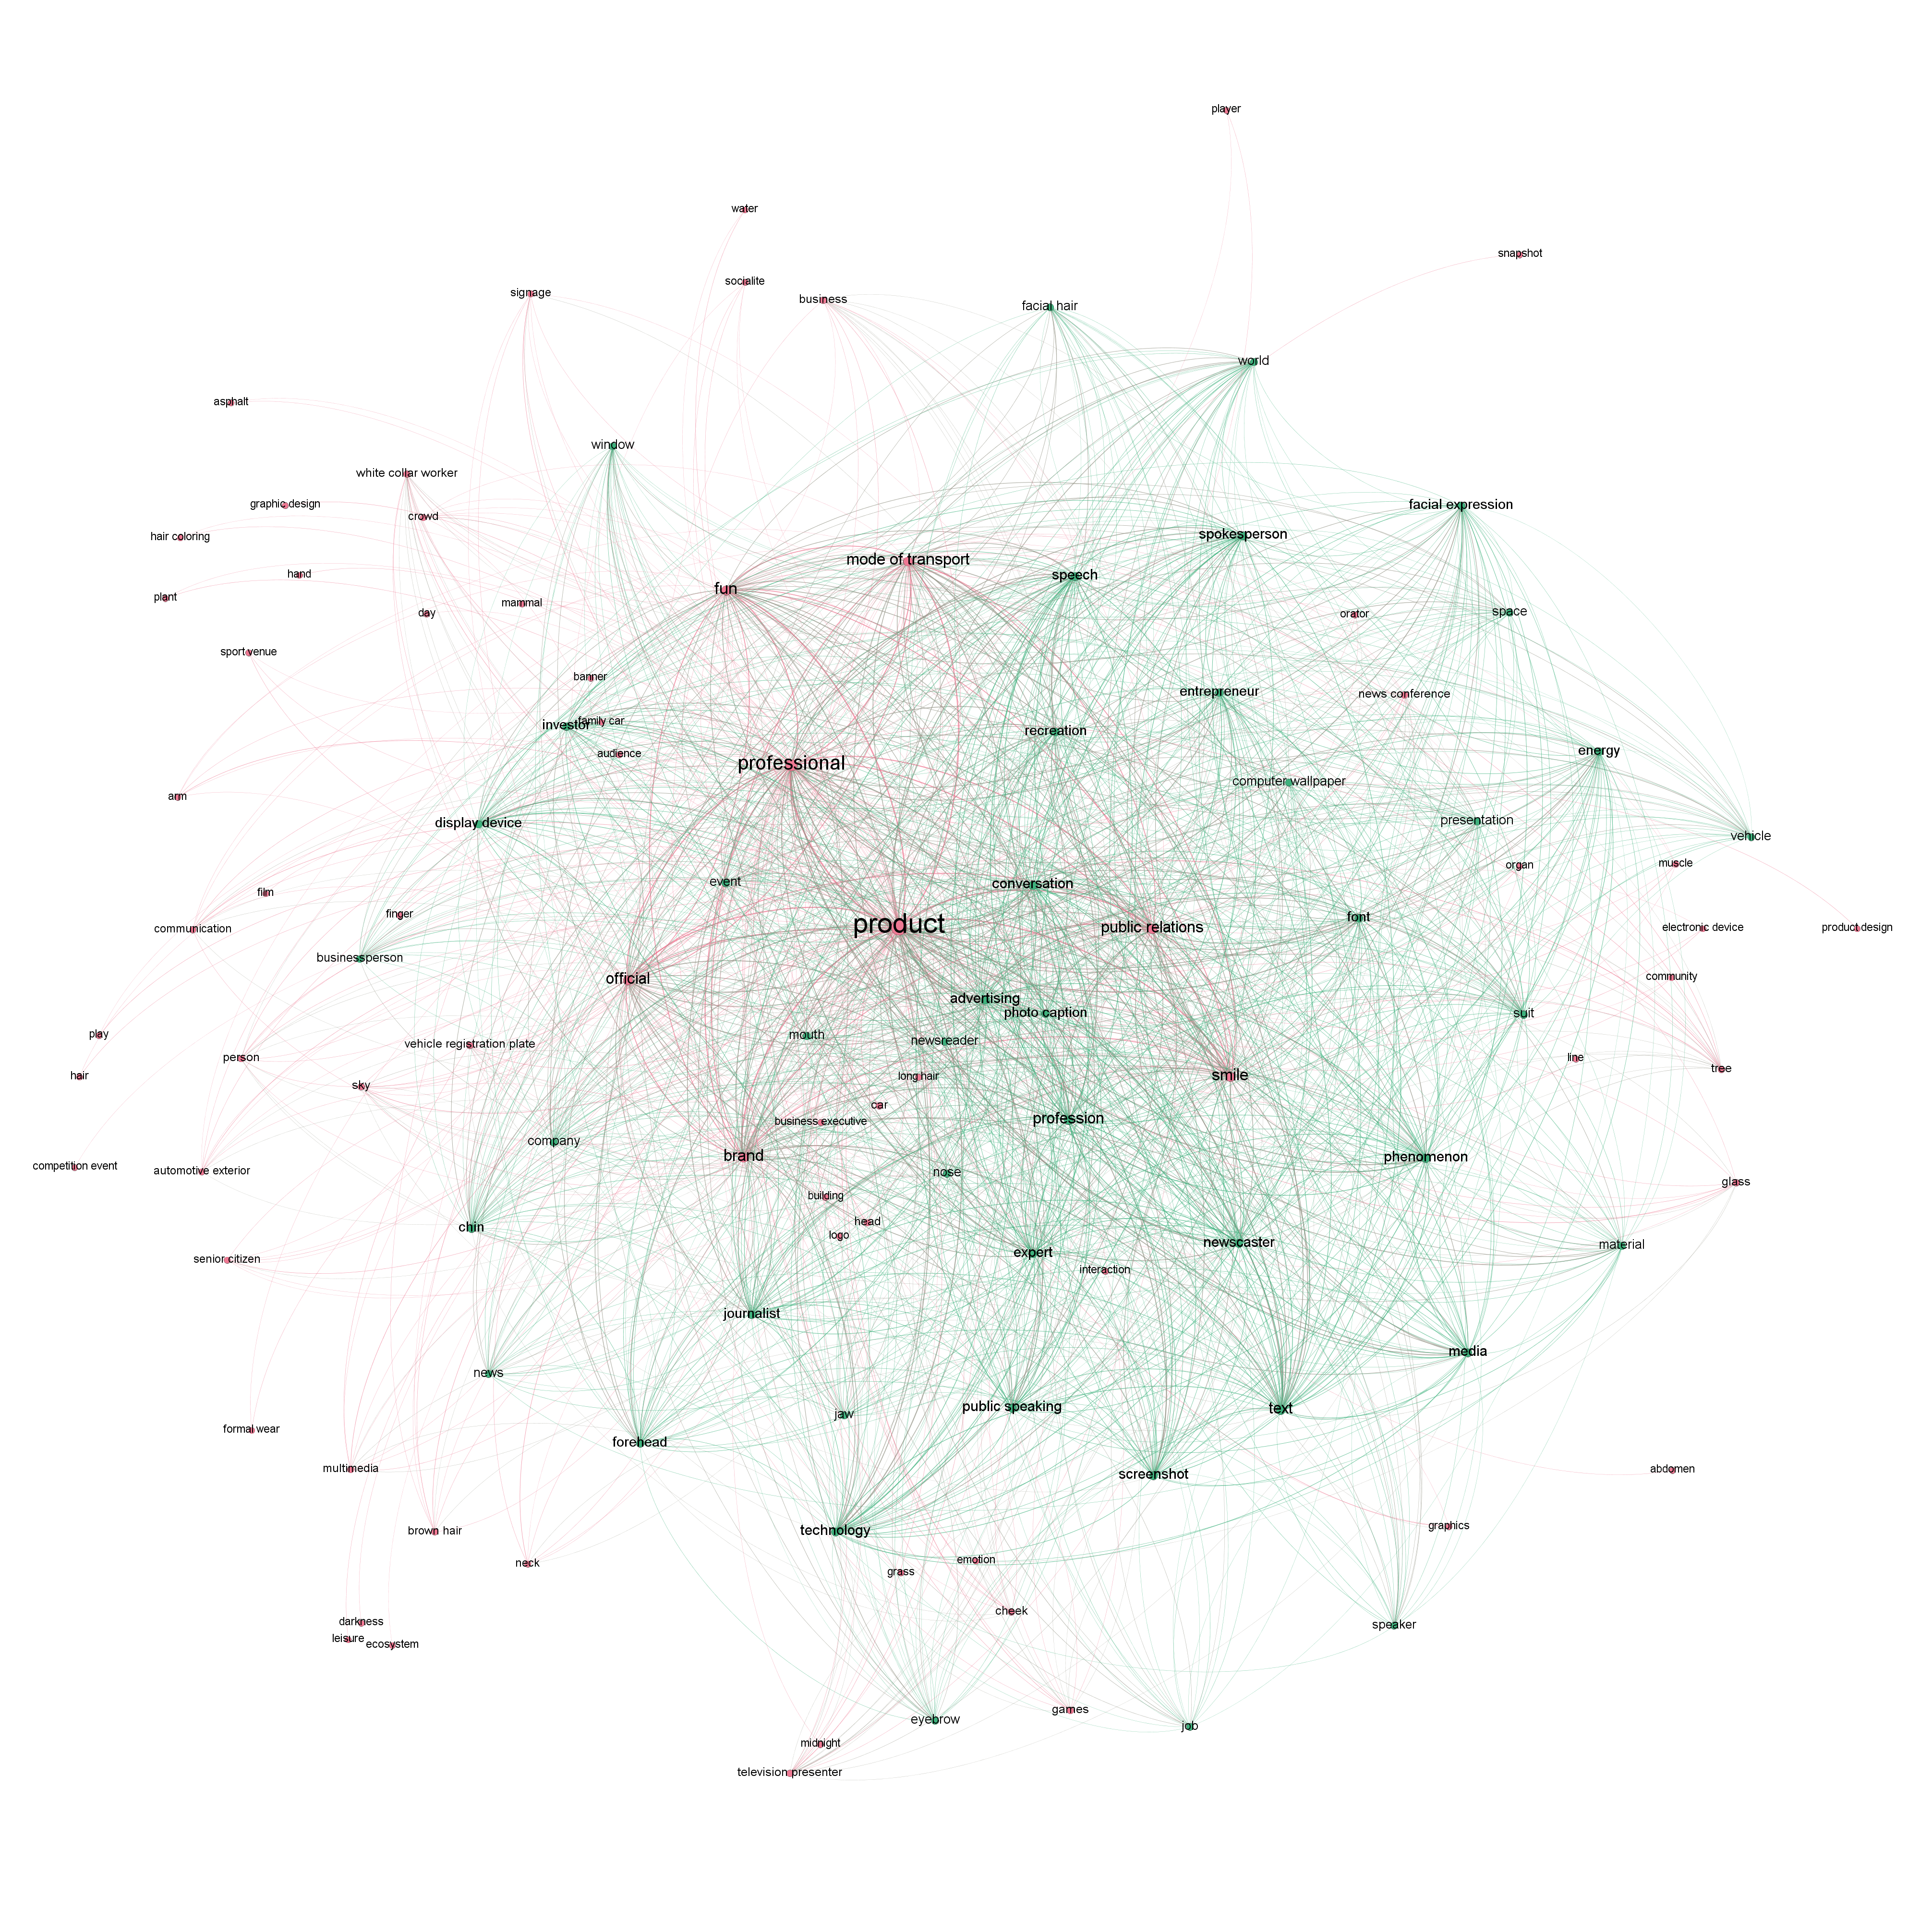
Using the new visual entity graph constructed by having the Cloud Video API watch a decade of evening news broadcasts on ABC, CBS and NBC in the Internet Archive's Television News Archive, what can we learn about the co-occurrences of the 10,000 identified labels? Using a single SQL query in BigQuery we can construct a co-occurrence graph of the top 1,500 pairs of entities that appear the most often together in the same minute of airtime and which appeared at least 5 seconds during that minute. The end result can be seen below.
TECHNICAL DETAILS
Creating the graph above required only a single BigQuery query, modified from the original by Felipe Hoffa. In this case, we cluster all labels appearing in the same minute together and exclude labels that appeared for less than 5 seconds in a given minute.
SELECT Source, Target, Count RawCount, "Undirected" Type, ( Count/SUM(Count) OVER () ) Weight FROM (
SELECT a.entity Source, b.entity Target, COUNT(*) as Count
FROM (
 (SELECT date, entities.name entity FROM `gdelt-bq.gdeltv2.vgeg_iatv`, unnest(entities) entities where entities.numSeconds > 5)
) a
JOIN (
 (SELECT date, entities.name entity FROM `gdelt-bq.gdeltv2.vgeg_iatv`, unnest(entities) entities where entities.numSeconds > 5)
) b
ON a.date=b.date
WHERE a.entity<b.entity
GROUP BY 1,2
ORDER BY 3 DESC
LIMIT 1500
)
order by Count Desc