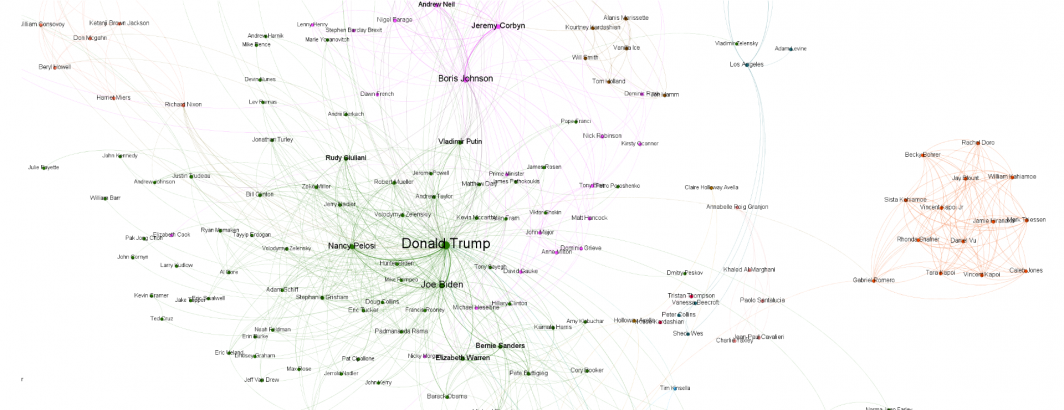
Rather than examine the most important people of 2019 as a whole or those dominating the discourse around free trade for the year, what might it look like to visualize the top 1,500 most commonly co-occurring people in the worldwide news media for a single day across the 65 languages monitored by GDELT?
The image below captures precisely that – the top 1,500 co-occurrence connections among the people mentioned this past Friday, December 6, 2019 in worldwide news media. (Click to enlarge).
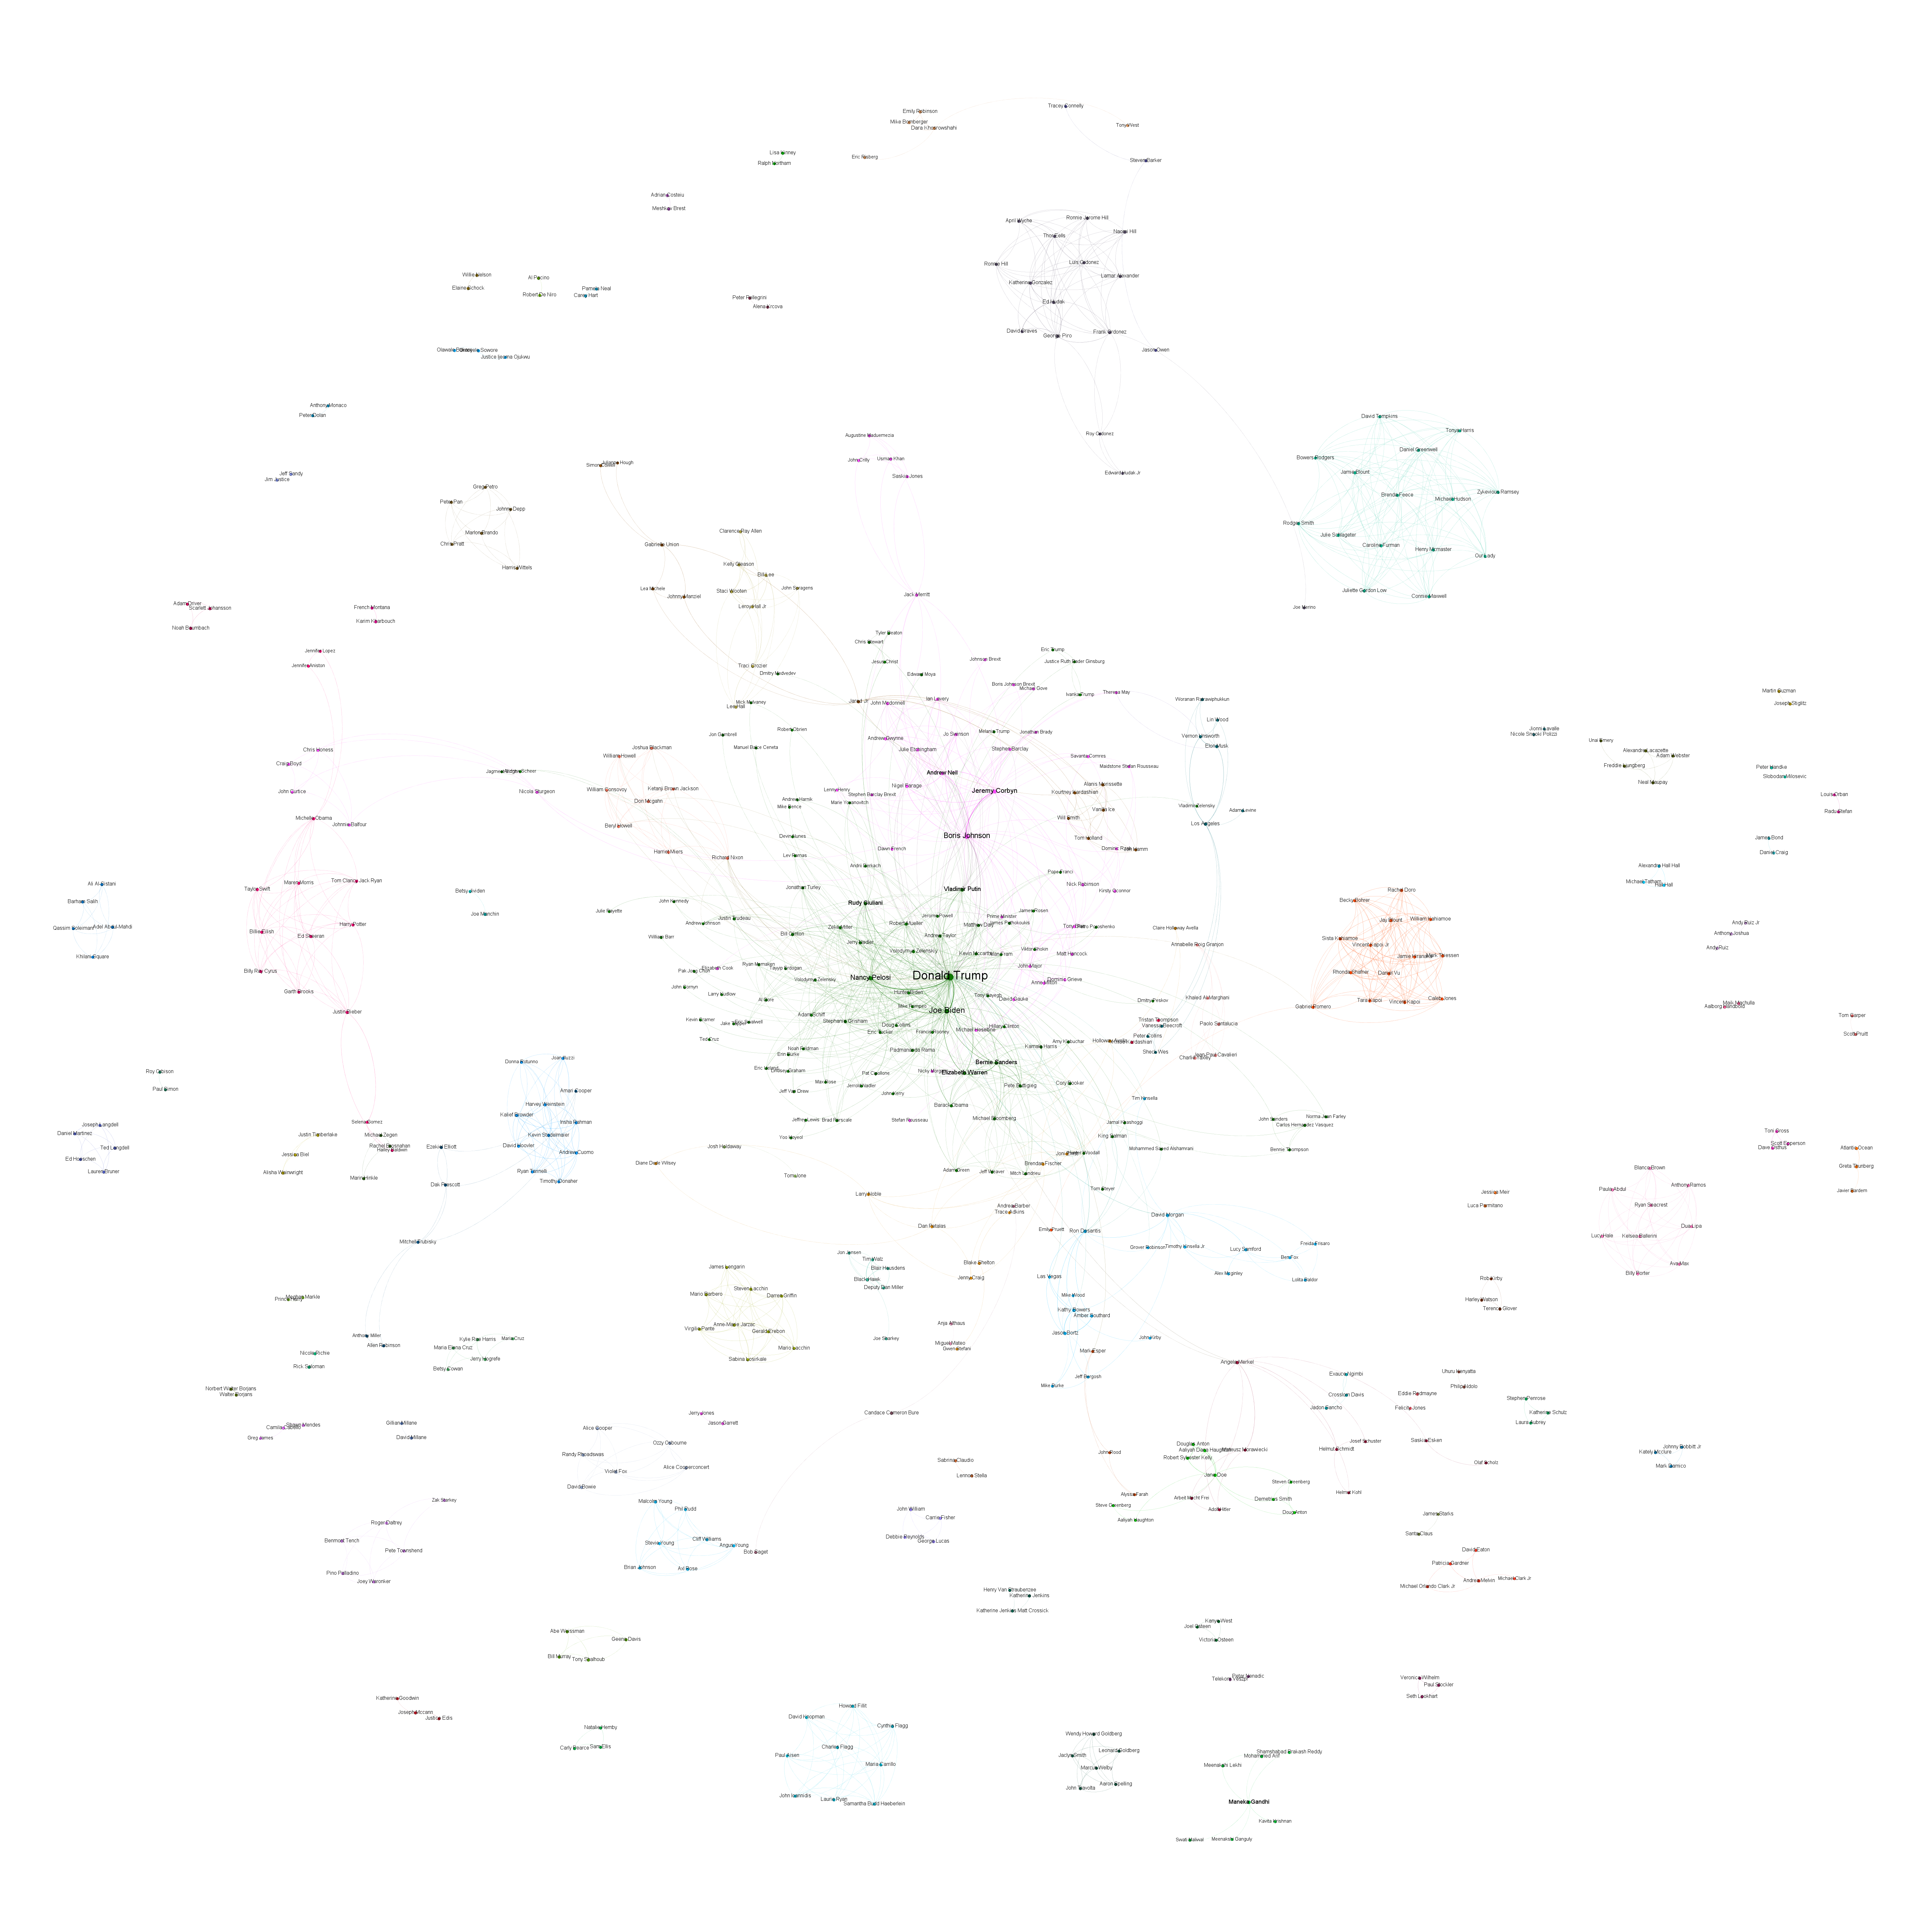
Files for this visualization:
This graph was created using Gephi's Force Layout 2 algorithm, which emphasizes diffuse layouts. What if we instead used Gephi's OpenOrd layout algorithm, which prefers denser graphs?
The image below shows the exact same graph arranged using OpenOrd to show the difference. (Click to enlarge).
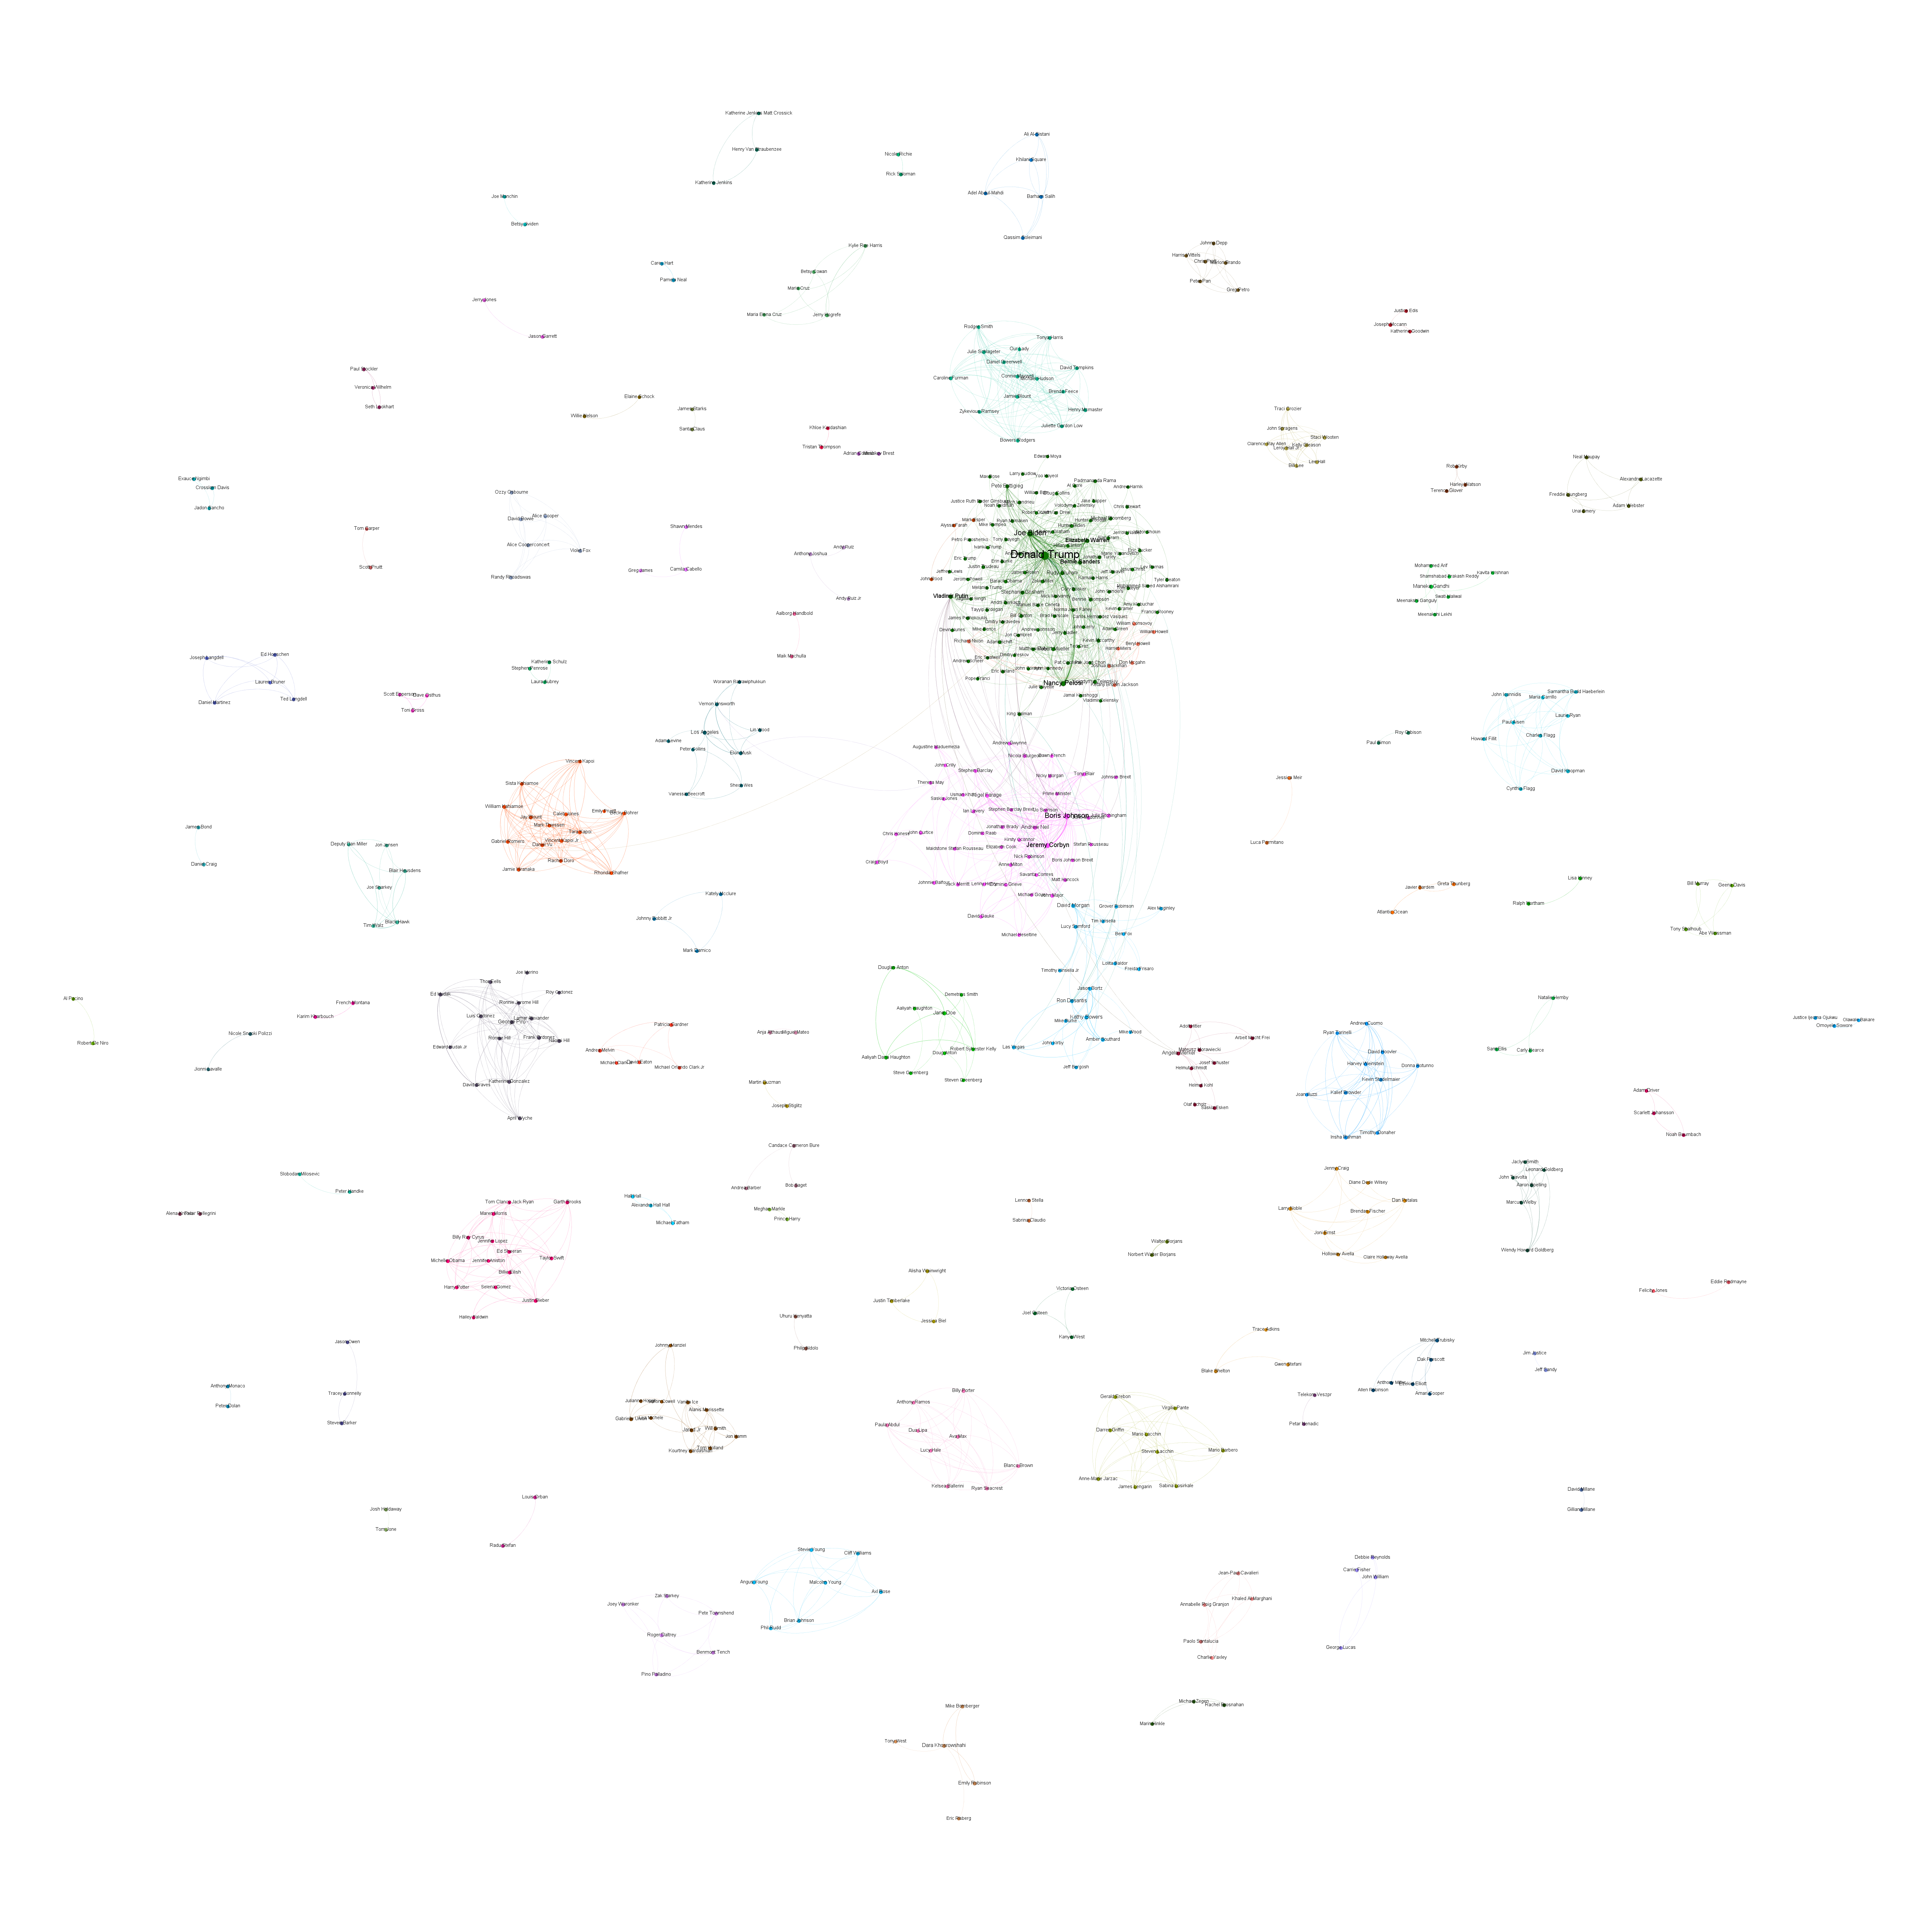
Files for this visualization:
TECHNICAL DETAILS
Creating the graph above required just a single SQL query in BigQuery using a modified version of the original graph code from Felipe Hoffa:
SELECT Source, Target, Count RawCount, "Undirected" Type, ( Count/SUM(Count) OVER () ) Weight FROM (
SELECT a.entity Source, b.entity Target, COUNT(*) as Count
FROM (
 (SELECT DocumentIdentifier url, entity FROM `gdelt-bq.gdeltv2.gkg_partitioned`, UNNEST(SPLIT(REGEXP_REPLACE(V2Persons, r',\d+', ''),';')) AS entity WHERE DATE(_PARTITIONTIME) = "2019-12-06" group by url,entity)
) a
JOIN (
 (SELECT DocumentIdentifier url, entity FROM `gdelt-bq.gdeltv2.gkg_partitioned`, UNNEST(SPLIT(REGEXP_REPLACE(V2Persons, r',\d+', ''),';')) AS entity WHERE DATE(_PARTITIONTIME) = "2019-12-06" group by url,entity)
) b
ON a.url=b.url
WHERE a.entity<b.entity
GROUP BY 1,2
ORDER BY 3 DESC
LIMIT 1500
)
order by Count Desc