Today we announce the release of an incredibly exciting new dataset: all 540,000 hours of English-language news broadcasts monitored by the Internet Archive back to July 2010 have been processed using the GDELT Global Knowledge Graph (GKG) 2.0 system. Every person, organization, location, and theme has been extracted from the closed captioning of each broadcast, along with all 2,238 emotions from the new Global Content Analysis Measures (GCAM) pipeline, which processes each broadcast through 18 packages including Forest Values, General Inquirer, Lexicoder, Linguistic Inquiry and Word Count (LIWC), Loughran & McDonald Financial Sentiment, Opinion Observer, Regressive Imagery Dictionary, Roget's Thesaurus, SentiWordNet, SentiWords, Subjectivity Lexicon, Body Boundary Dictionary, WordNet Affect, WordNet Domains, and WordNet Lexical Categories. Imagine being able to dive into the data underpinning the Geography of Television map, create a histogram of which countries and world leaders are mentioned most alongside which topics, or trace the emotions of the world’s news over the years.
In the next few weeks we will be rolling this out as part of the core GDELT system, meaning every single news article processed by GDELT will have all 2,238 emotional/thematic dimensions extracted!
Interactive Timeline Visualization
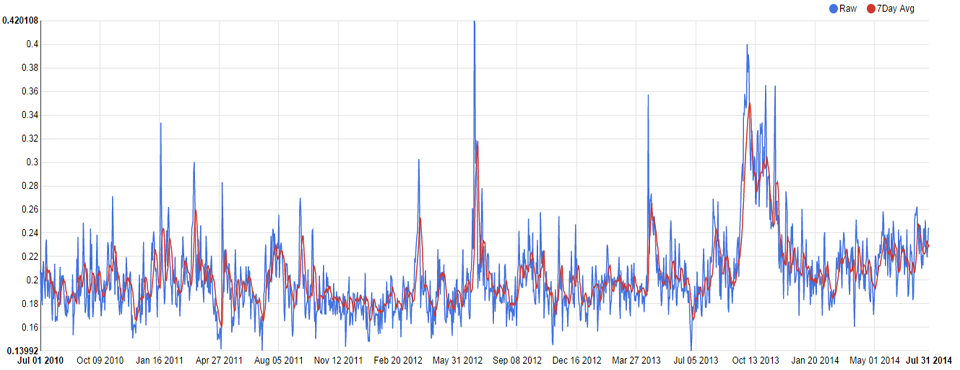
To show off the incredible power of this new dataset, we’ve created an interactive timeline visualization that allows you to select an emotion and view its intensity in American television news over time, along with which networks invoke that emotion the most in their broadcasts. Try Anxiety to see the impact of the US Government shutdown in October 2013 or Holidays to see the cyclic discussion of the holiday season each year.
Raw Dataset
For the data scientists out there, the complete 9.4GB dataset (3.1GB ZIP) is now available for download. Like all GKG files, the dataset does NOT contain any of the text of the broadcasts, it contains only the codified metadata computed from each broadcast. This file requires advanced scripting and parsing expertise to work with and few software packages are able to cope with datasets of this size, so it is recommended that only expert users download this dataset. Note that several of the GKG 2.0 fields relating to proximity are blank in this file due to the way the material was processed. Also, please note that the closed captioning found in American television broadcasts has a very high degree of error that can exceed that of OCR'd historical documents in some cases, leading to error in the final results.
- GKG 2.0 + GCAM Codification of Internet Archive Television News Archive (NOTE: 3.2GB ZIP / 9.4GB uncompressed)
- GKG 2.0 Codebook (Includes Details on GCAM Field)
- GCAM Description
- GCAM Master Codebook