Rather than having the Cloud Inference API surface the most significant visual labels of each day from television news of the past decade using the Cloud Video API and the visual entity graph, what if we instead asked the Cloud Inference API to find the hidden correlations among those labels? In short, the Cloud Video API watched a decade of evening television news broadcasts on ABC, CBS and NBC and assigned a set of visual labels describing what it saw second-by-second, which we collapsed to a minute-by-minute chronology of the visual narratives of television news over the past decade. In turn, we asked the Cloud Inference API to take this massive dataset and take the top 2,000 labels (those that appeared at least 10 seconds in at least 100 different one minute intervals) and determine the labels that appear more commonly with that label within a given minute than in minutes that don't contain that label. In short, the visual narratives that are highly related.
The resulting list contains entries like the following, offering a list of "visual synonyms" in the vocabulary of Cloud Video API's labels.
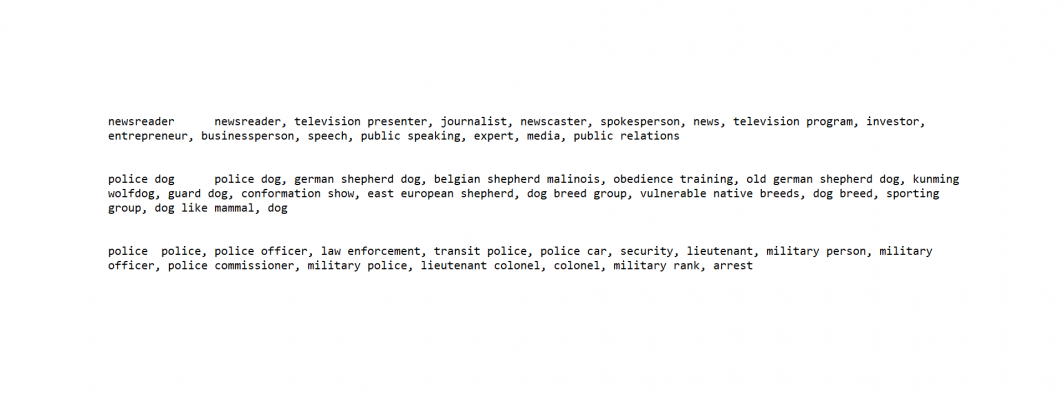
- Newsreader: newsreader, television presenter, journalist, newscaster, spokesperson, news, television program, investor, entrepreneur, businessperson, speech, public speaking, expert, media, public relations
- Police: police, police officer, law enforcement, transit police, police car, security, lieutenant, military person, military officer, police commissioner, military police, lieutenant colonel, colonel, military rank, arrest
- Police Dog: police dog, german shepherd dog, belgian shepherd malinois, obedience training, old german shepherd dog, kunming wolfdog, guard dog, conformation show, east european shepherd, dog breed group, vulnerable native breeds, dog breed, sporting group, dog like mammal, dog
You can download the complete list below:
TECHNICAL DETAILS
First we compiled a list of the top visual labels that appeared at least 10 seconds in at least 100 different one minute intervals, using a single BigQuery SQL query:
SELECT entity.name EntityName FROM `gdelt-bq.gdeltv2.vgeg_iatv`,UNNEST(entities) AS entity where entity.numSeconds>=10 group by entity.name having count(1) > 100 order by sum(entity.numSeconds) desc
We then exported this list as a CSV file and saved it locally as "TERMS.CSV.TMP". The header row was removed and the new file saved to "TERMS.TXT" using ("tail -n + 2" returns all but the first row of a file):
tail -n +2 ./TERMS.CSV.TMP ./TERMS.TXT
Then we downloaded a special PERL script and JSON query template:
This PERL script takes an input list of terms and cycles over them, running each one at a time against the specified table to find the other terms most correlated with it. The Inference API does all of the work – the PERL script just issues the queries.
Using the same Inference API table we created earlier today, we hand the PERL script our list of terms and let it do the rest:
time ./infer_run_terms.pl [YOURPROJECTID] Entity10S Entity10S gdeltbq_vgegiatv_v1 ./TERMS.TXT ./2010-2019-VGEG-IATV-CORRELATEDLABELS.TXT
That's all there is to it!