Unemployment is a common measure of the economic health of developed countries that also receives considerable media and search interest, providing quantitative real-time indicators on press and public attention.
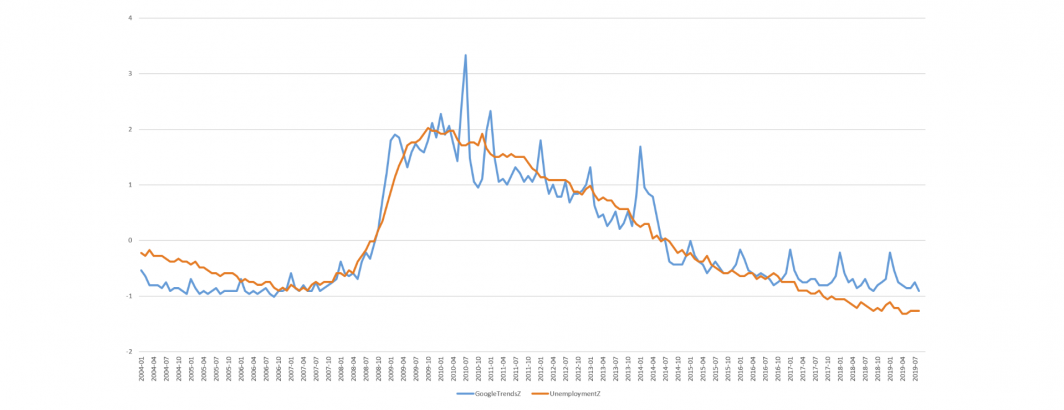
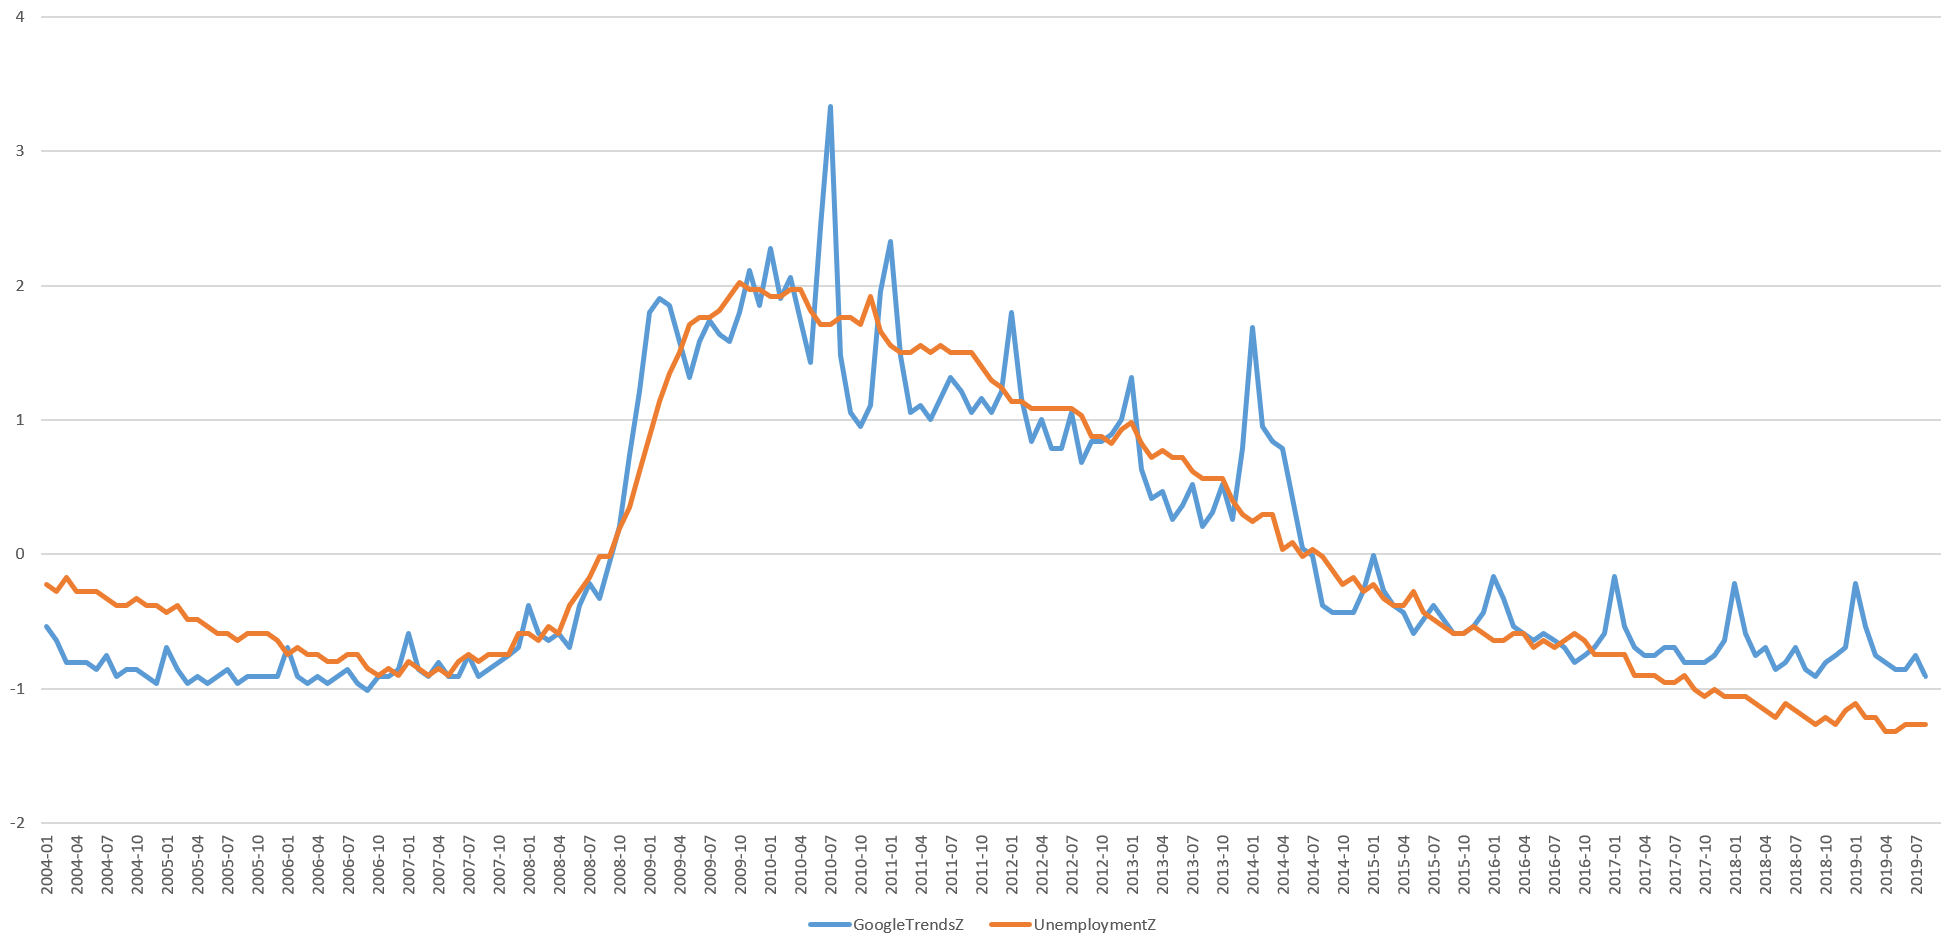
Below is a plot comparing US-based search interest for the word "unemployment" using Google Trends compared with US Bureau of Labor Statistics official unemployment rate data from January 1, 2004 (the start of the Google Trends data) through August 2019, reported as Z-scores (standard deviations from mean, allowing the two different Y scales to be reported together). The two graphs are nearly identical, with a correlation of r=0.93. Look more closely, however, and real unemployment clearly leads search interest until November 2008, at which point search interest surges vertically while unemployment takes a few extra months. Again, actual unemployment leads search interest on the downswing as well, suggesting that while search interest may act as a useful proxy for unemployment, it does not appear to be predictive, but rather reactive.
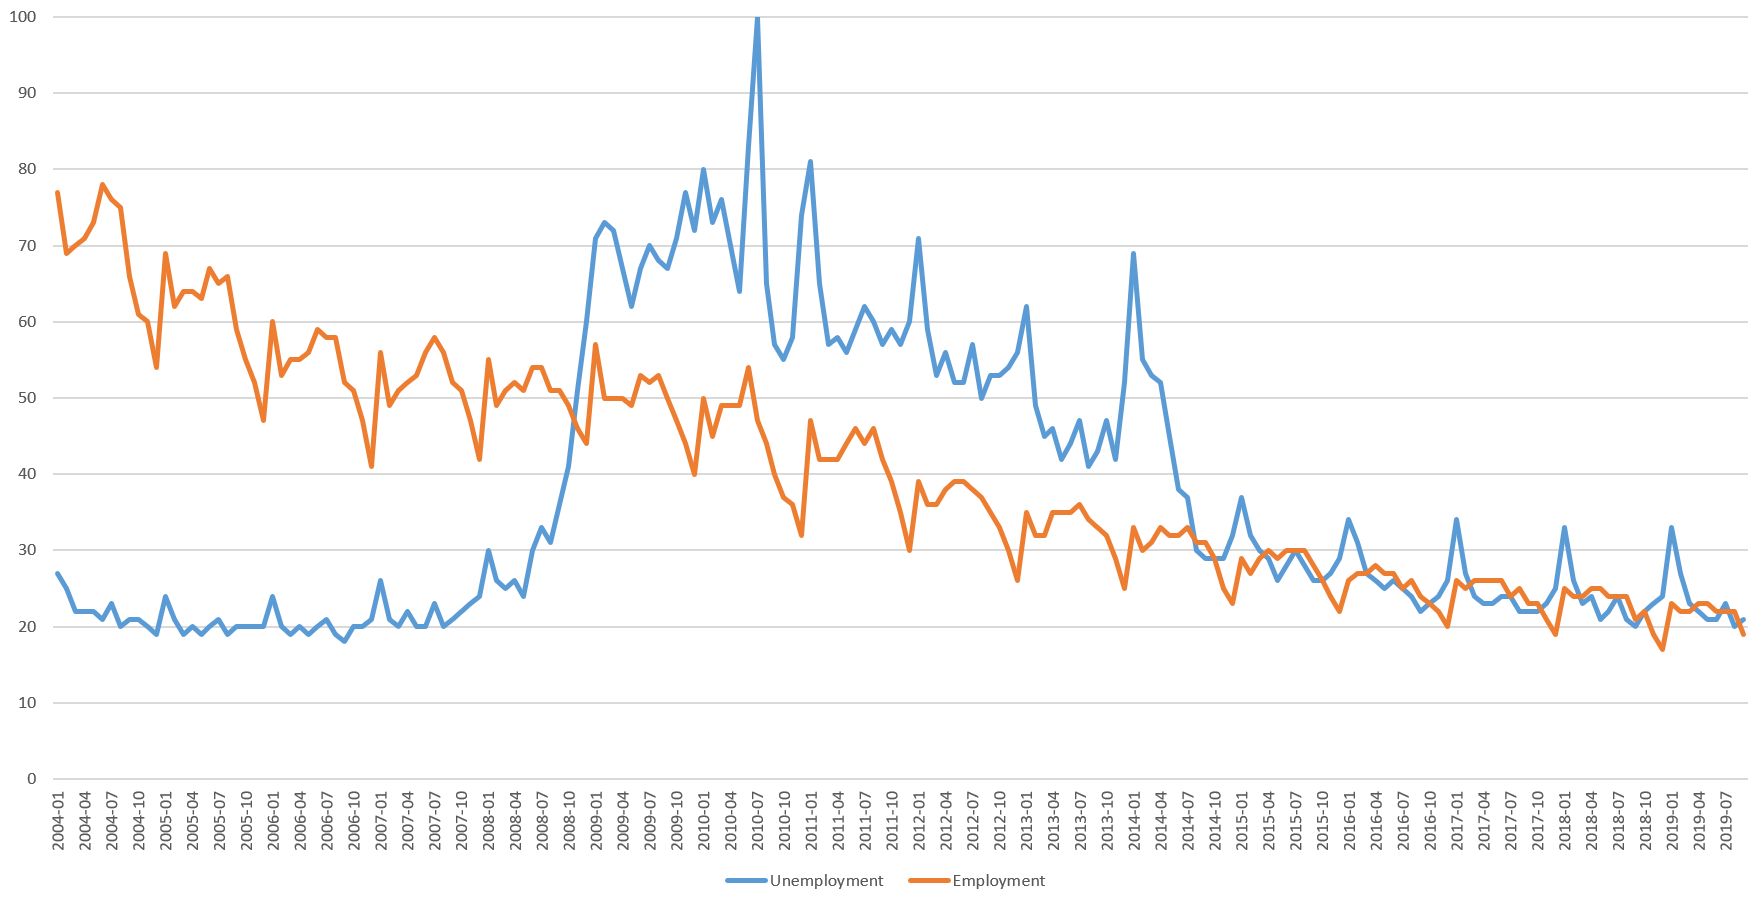
At the same time, the graph below plots Google Trends searches for "unemployment" against its inverse "employment." Here the tight alignment with actual unemployment data can be seen to entirely disappear. Searches for "employment" have almost linearly decreased year over year since the 2004 start of the data, with effectively zero reflection of the 2008 recession. This is a cautionary reminder that when it comes to using data-driven insights like search interest, word choice can mean the difference between a powerful signal and noise.
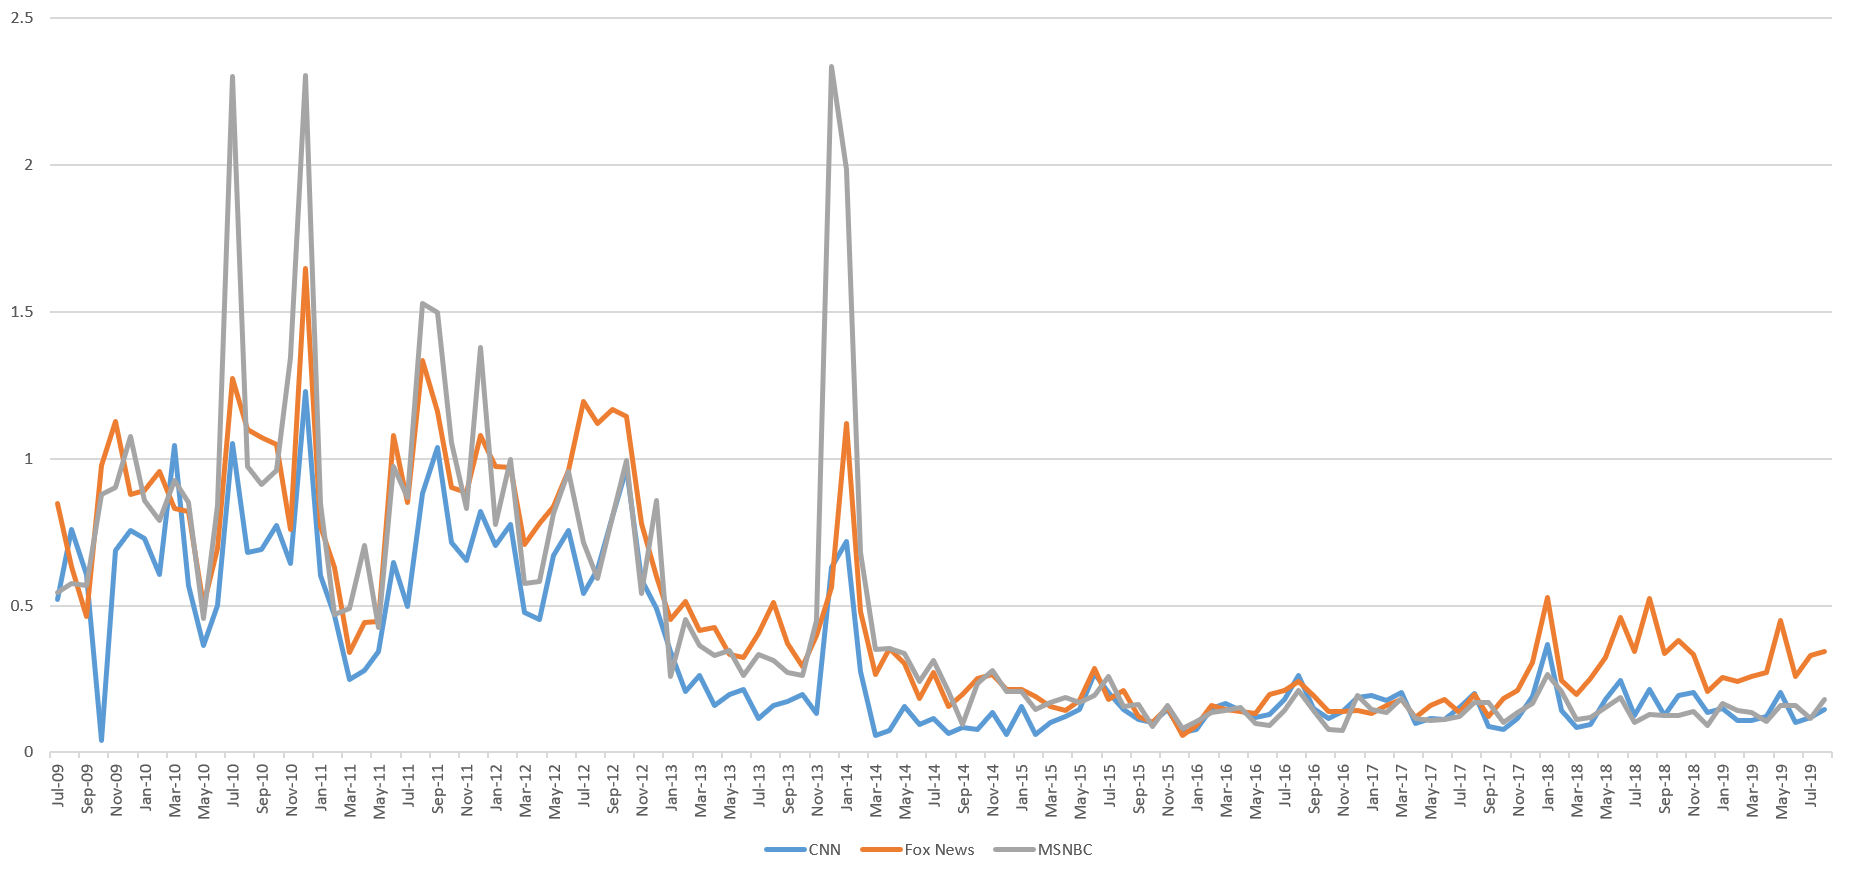
How does media data stack up? Plotting mentions of the words "unemployed," "unemployment," "employed" and "employment" across CNN, MSNBC and Fox News from July 2009 (the start of the data) to August 2019, the timeline below (live version) shows that from 2009 through 2013 discussion of unemployment decreased and then leveled off after a brief burst at the start of 2014. Interestingly, Fox News began to pull away from CNN and MSNBC in its elevated attention to the topic starting in early 2017, with that trend accelerating in mid-2018. We will return to the significance of that in a moment.
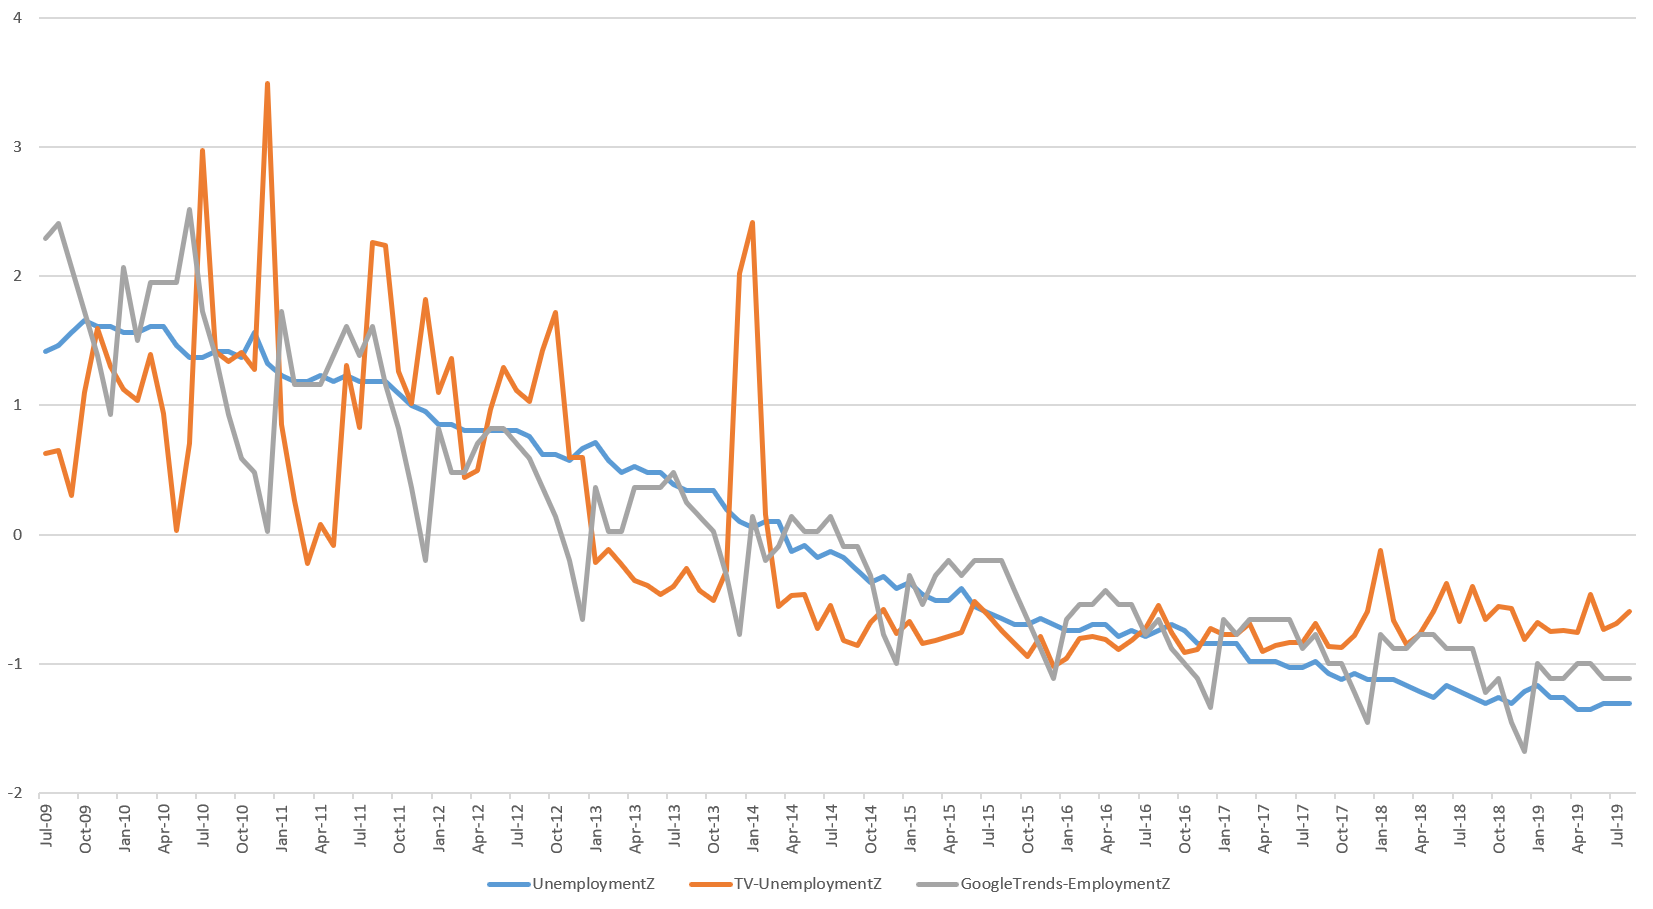
Collapsing the three stations into a single timeline and comparing against Google Trends and actual unemployment data, the timeline below plots the Z-scored versions of the three timelines together. Here it is clear that all three are closely linked, though media is spikier in the earlier half due to being highly reactive to major news, while Google Trends has more seasonal variation.
Returning to the elevated Fox News coverage beginning in early 2017, the timeline below shows the raw official unemployment rate over the July 2009 – August 2019 period of the television coverage.
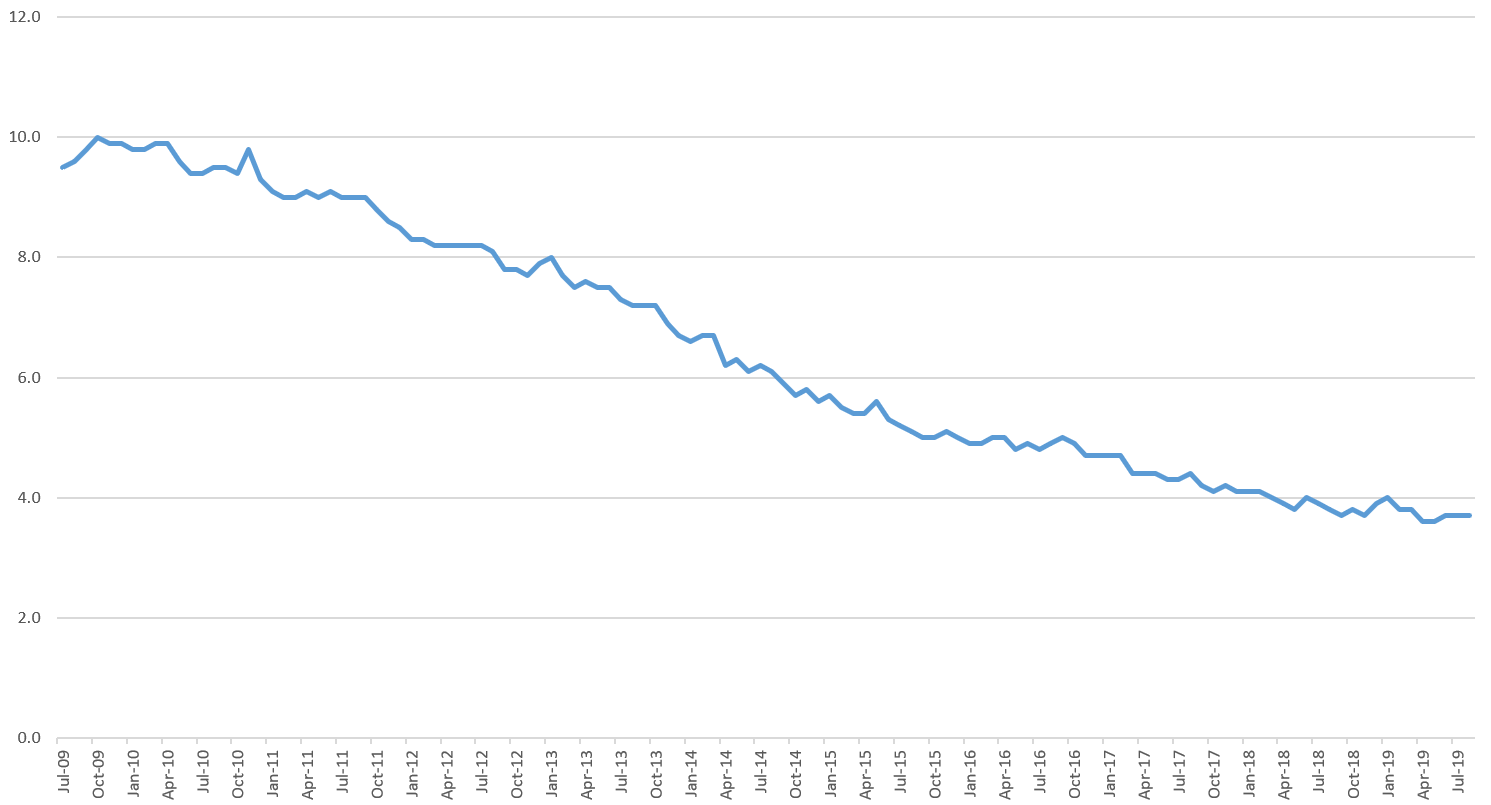
Notice the subtle break in early 2017 as the sharp decrease in the unemployment rate slows and especially how that slowdown levels off in mid-2018 just as Fox News pulls away from CNN and MSNBC in its accelerating coverage of unemployment. This slowdown is reflected to a small degree in the Google Trends data, but not nearly as strongly. In short, as as economic recovery in terms of unemployment stalls, Fox begins paying elevated attention, long before this trend becomes readily apparent in the data.
Putting this all together, it is important to remember that the Google Trends and television graphs reflect attention to a single word "unemployment" (television includes a few additional variants). In reality, by the time the press and public begin thinking in terms of the word "unemployment" they are already recognizing economic health concerns and are seeing them through the specific lens of jobs. This is likely the reason that these trends proxy rather than predict the actual unemployment rate. In reality, leading indicators that would predict the official unemployment rate likely revolve around more subtle indicators like mentions of corporate cutbacks and various latent emotional indicators, all of which present fascinating opportunities for future investigation.
In the end, the graphs above remind us just how powerful these latent non-traditional economic indicators can be.