How can the Web News NGrams 3.0 dataset be used to extract and track trends in numeric quantities? For example, could ngrams be used to examine the density of mentions of infections, death and vaccination counts over the course of the Covid-19 pandemic?
It turns out that extracting such numeric quantities from the ngrams dataset is trivial using BigQuery. The query below examines all English-language ngram entries from January 1, 2020 through present. The initial select statement filters the ngrams down to those that contain either a digit or a spelled-out number in the ngram field. This is a trivial filter to extract all numeric entries from the dataset and can be easily adapted to any target language. This filtered set of ngrams are then searched for mentions of "deaths/dead/died/dying", "infect*" or "vaccin*" in the 14 words following the number using the post field. This is then combined into a final daily timeline.
NOTE that this query consumes 19TB of query quota. Despite processing 300 billion rows and running them through Unicode-aware lowercasing and multiple regular expressions, it took just 3m8s to complete given BigQuery's massive scalability!
with data AS (SELECT DATE(date) day, post FROM `gdelt-bq.gdeltv2.webngrams` WHERE DATE(date) >= "2020-01-01" and lang='en' and
(
REGEXP_CONTAINS(ngram, r'\p{Nd}') OR
REGEXP_CONTAINS(LOWER(ngram), r'\b(zero|one|two|three|four|five|six|seven|eight|nine|ten|eleven|twelve|thirteen|fourteen|fifteen|sixteen|seventeen|eighteen|nineteen|twenty|thirty|forty|fifty|sixty|seventy|eighty|ninety|hundred|hundreds|hundredth|thousand|thousands|thousandth|million|millions|millionth|billion|billions|billionth|trillion|trillions|trillionth|quadrillion|quadrillions|quadrillionth)\b')
))
select day, sum(death) death, sum(infection) infection, sum(vaccination) vaccination from (
  select day, 1 death, 0 infection, 0 vaccination from data where REGEXP_CONTAINS(LOWER(post), r'(deaths|dead|died|dying)')
  UNION ALL
  select day, 0 death, 1 infection, 0 vaccination from data where REGEXP_CONTAINS(LOWER(post), r'(infect)')
  UNION ALL
  select day, 0 death, 0 infection, 1 vaccination from data where REGEXP_CONTAINS(LOWER(post), r'(vaccin)')
) group by day order by day asc
You can download the final results in CSV format:
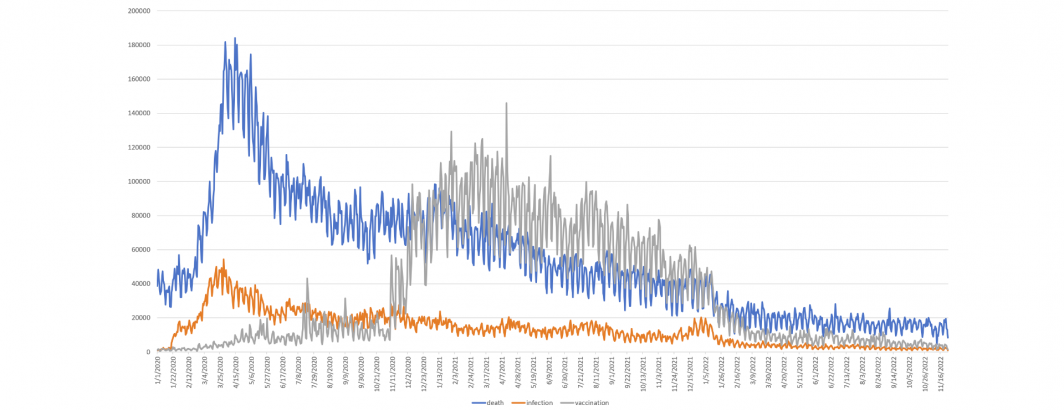
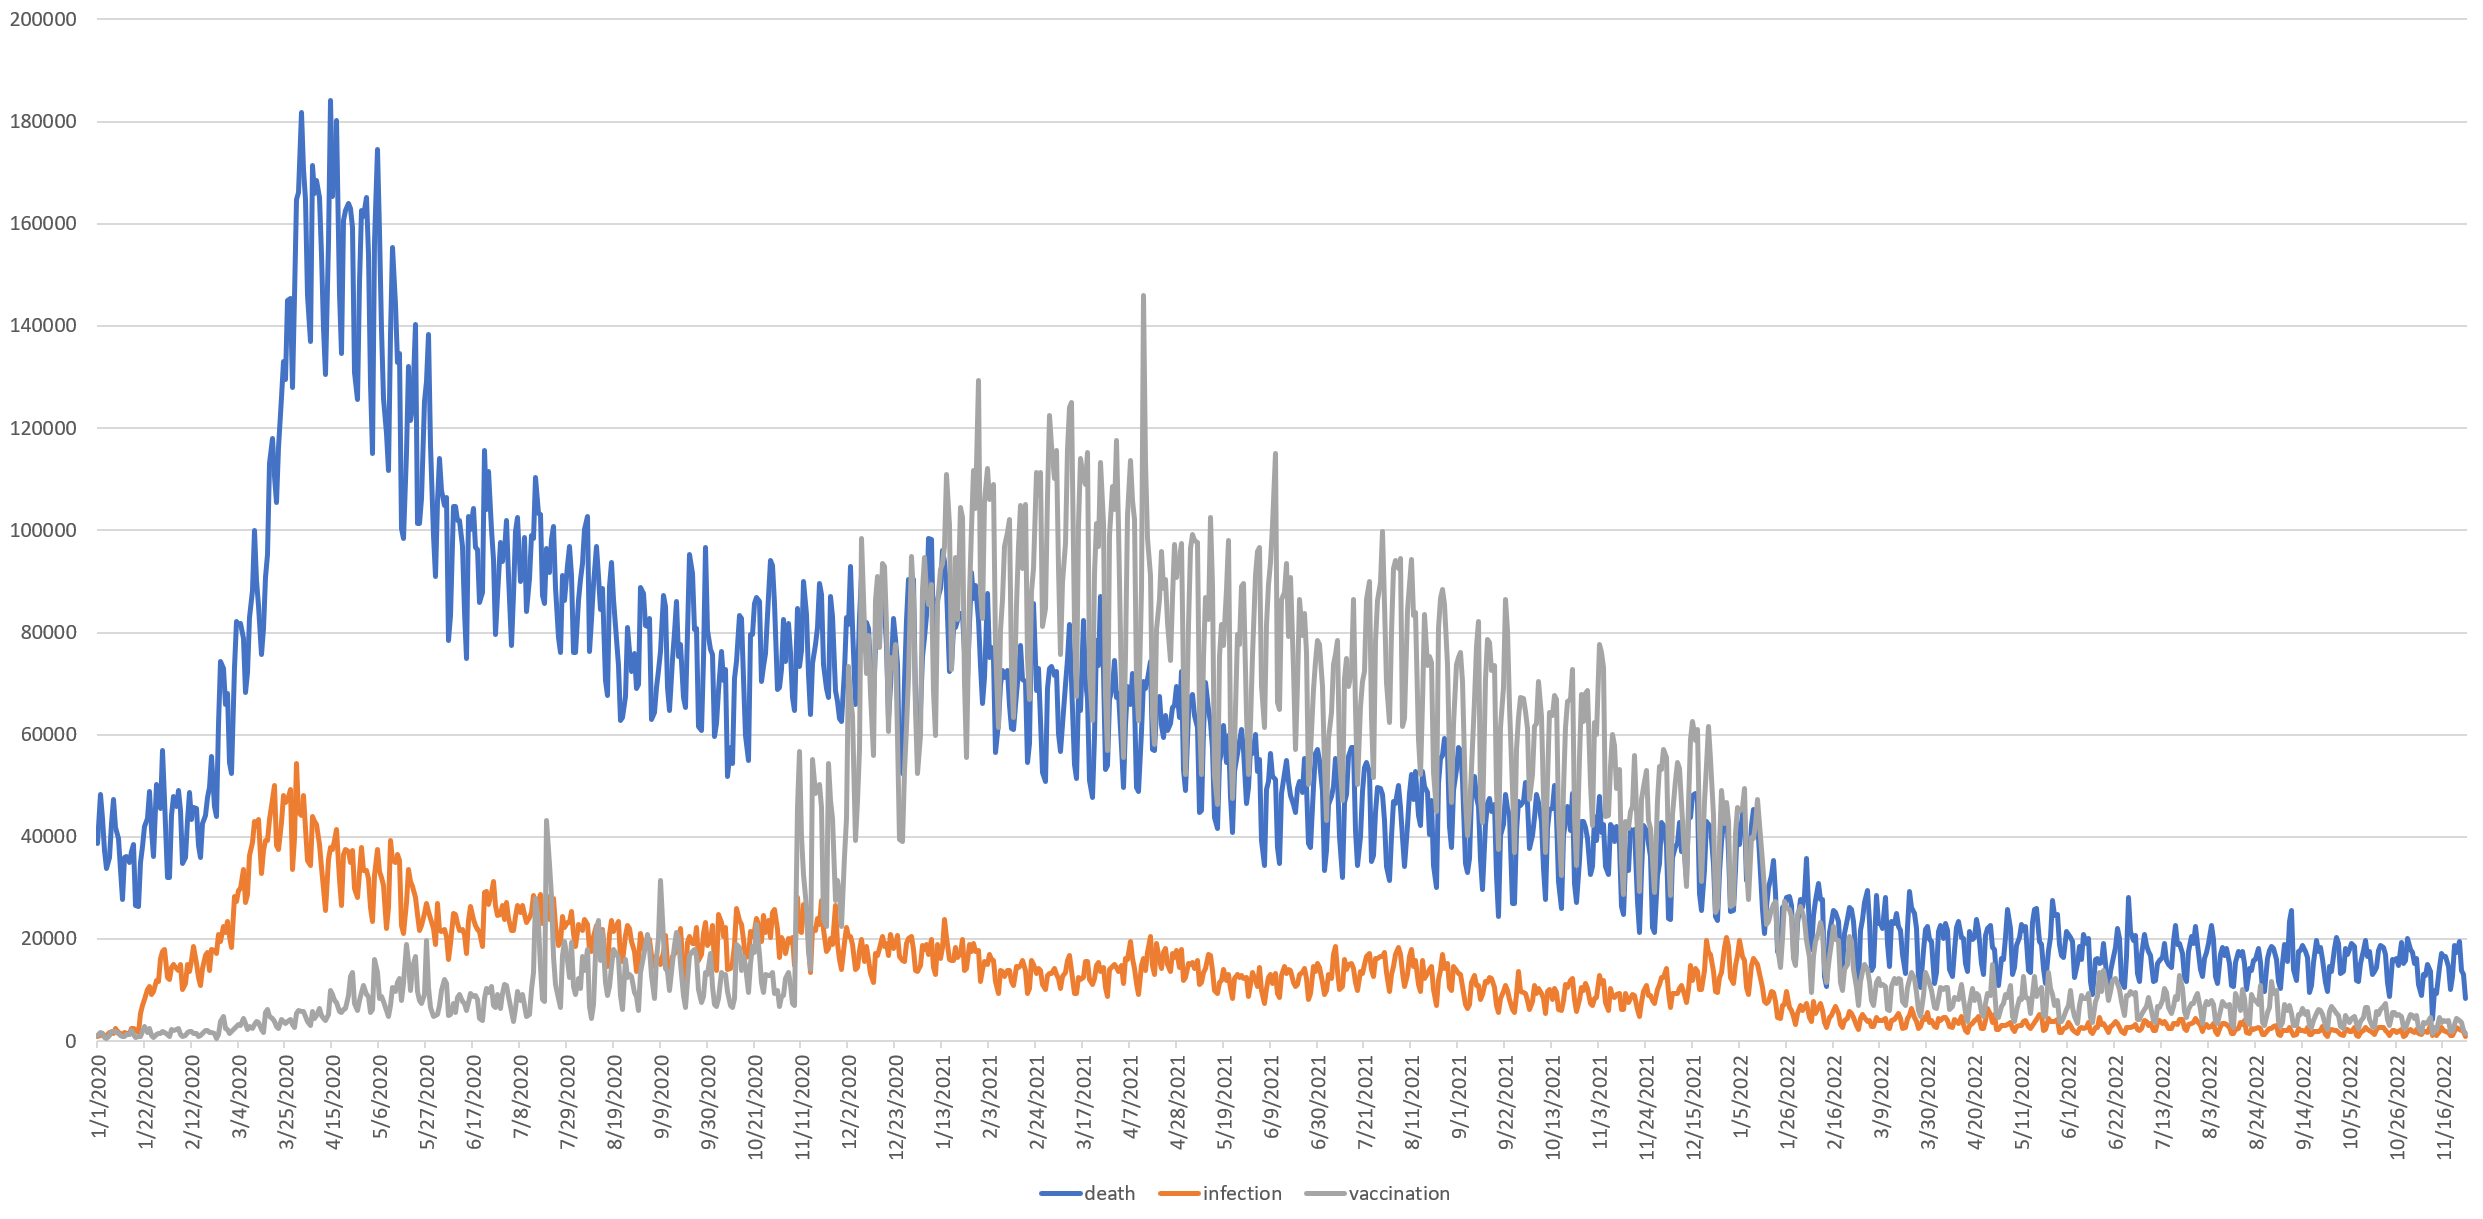
You can see the timeline below, showing deaths surging in late March and remaining elevated through early May, then falling steadily through the course of the pandemic, before crashing in early 2022. Infections followed a similar course, but dropped more sharply and remained more stable through the course of the pandemic. Vaccinations surged in November 2020 and similarly collapsed in January 2022.
Note that this graph does not chart the actual number of deaths, infections and vaccinations, but merely the number of daily appearances of those terms in context with a number in English language news coverage.
Instead of simply plotting the number of numeric references over time, you could trivially modify the above pipeline to process the matching counts in realtime through a neural NLP model to perform relevancy detection and structured parsing.