Two months ago we unveiled in Google BigQuery access to the entire quarter-billion-record GDELT Event Database, which monitors the world’s broadcast, print, and web news media from across the world in over 100 languages and uses sophisticated computer algorithms to codify what’s happening throughout the globe. In essence, GDELT constructs a continually-updated computable catalog of human society day by day, compiled from the world’s news media.
One of the most exciting aspects of having GDELT in BigQuery is that it in addition to realtime querying and summarizing of a quarter-billion records, BigQuery’s correlation support offers the tantalizing possibility of using GDELT to search for the basic underlying patterns of global human society. Put simply, could you forecast what will happen next in Egypt by searching all of world history for periods of time similar to Egypt’s last few months and averaging what happened after each of those previous periods as an estimate for what may happen this time? In essence, looking to similar periods in the past to estimate the future?
Imagine it is January 27, 2011, Egypt is wracked with anti-government protests, and you’re trying to figure out what might happen next. The algorithm would start by creating a timeline of the intensity of unrest in Egypt by day over the previous two months (November 28, 2010 through January 27, 2011). It would then search the complete history 1979-present of every country in the world in a rolling 60-day window and compare it to Egypt’s last two months using a Pearson correlation. Beginning with Afghanistan, it would make a timeline of Afghanistan’s unrest January 1, 1979 to March 2, 1979 and compare against Egypt’s November 28, 2010 to January 27, 2011 period. Then, it would compare Afghanistan January 2, 1979 to March 3, 1979 against Egypt again, and so on, in a rolling window over the last 35 years of Afghanistan’s history captured by GDELT, then repeating the process for every other country in turn, identifying past periods in the history of the world that are most similar to Egypt’s last two months. Finally, it would take the top several most similar historical periods and average what happened in the two months following each of them in the past, and offer this as a possible forecast for what might happen today in Egypt over the coming two months.
Of course, such an approach assumes that world history repeats itself in a finite set of measurable temporal patterns. GDELT’s incredible scale (300 categories of events from every country spanning the last 35 years) offers for the first time the ability to test such a hypothesis, but the sheer number of correlations that must be calculated (around 2.5 million) make this enormously expensive computationally. Yet, this is precisely the kind of problem BigQuery was designed for and with just two lines of SQL, we will scan world history to find those periods most similar to Egypt on day two of its 2011 revolution.
Start off by opening up the BigQuery screen for GDELT. (If it's your first time, you'll have to sign-up to create a Google project, but no credit card or commitment is needed). Next we create a “view” onto the full database that summarizes the total volume of news coverage of “Material Conflict” activities in each country by day and name it “country_date_matconf_numarts” (for this example instead of using the code below, you can just use the table we’ve already created). While we’re at it, we convert their 2-digit country codes into human-readable names and drop out a set of smaller countries that have too few events to consider for this analysis. You can easily modify this query to use a different time scale (aggregating by week or month instead of by day) or different event type (such as limiting to only certain types of conflict, or looking at non-conflict activities). Instead of using the number of events per day, we’re actually going to look at the total volume of news articles per day covering conflict events in each country, which gives us an extremely coarse proxy for the “importance” of conflict activities by country/day, since a single protest that is covered by thousands of news reports is likely more important than one that is mentioned in only a single news outlet worldwide.
select b.HumanName country, a.date date, a.c c from
(SELECT ActionGeo_CountryCode country, PARSE_UTC_USEC(STRING(SQLDATE)) date, sum(NumArticles) c FROM [gdelt-bq:full.events] WHERE ActionGeo_CountryCode IS NOT null and QuadClass=4 and ActionGeo_CountryCode not in ('AC', 'BQ', 'GL', 'BB', 'PG', 'AT', 'JE', 'CQ', 'JN', 'JU', 'CV', 'VC', 'AY', 'SH', 'NM', 'NH', 'MT', 'SV', 'GJ', 'DQ', 'MP', 'PC', 'MQ', 'WS', 'VQ', 'GO', 'CW', 'RQ', 'ST', 'TK', 'BP', 'TN', 'CK', 'PJ', 'CJ', 'KR', 'AA', 'IC', 'LQ', 'BF', 'NT', 'KT', 'PP', 'VT', 'AQ', 'SC', 'TE', 'CR', 'HQ', 'UU', 'IO', 'NR', 'OS', 'TB', 'NE', 'WQ', 'EU', 'FQ', 'SE', 'MH', 'MB', 'BS', 'JQ', 'AX', 'IP', 'US', 'FM', 'FJ', 'FS', 'OC', 'DX', 'PF', 'KQ', 'UF', 'AV', 'RM', 'FK', 'RN', 'MV', 'GQ', 'BV', 'GI', 'WF', 'GP', 'VI', 'FO', 'MC', 'NF', 'TD', 'SB', 'DO', 'PS', 'BD', 'HM', 'SX') GROUP BY 1, 2) a
JOIN (select FIPSCC, HumanName from [gdelt-bq:full.crosswalk_geocountrycodetohuman]) b
on a.country=b.FIPSCC
Now comes the magic. In just a single SQL query we’re going to ask BigQuery to look at the volume of news coverage by day of conflict events in Egypt in the two months preceding January 27, 2011, and use a rolling window of 60 days and Pearson correlation to compare it against every 60-day period over the last 35 years of every country in the world, and then return all of the periods in world history that are statistically similar to those two fateful months in Egypt. Simply by changing “Egypt” and “2011-01-27” in the query below, you can repeat this to find the most similar periods to any period of any country over the last 35 years. Changing the number “60” allows you to change the size of the rolling window used for comparison up to a maximum of 255 days (though the larger you set this, the longer your query will take). If you change the 60 day window, make sure to change the “abs(corr) > 0.254” filter at the end of the query to be the appropriate Pearson critical value to ensure the query only returns statistically significant correlations (a value of 0.254 with a window of 60 days offers a 95% confidence level).
SELECT
STRFTIME_UTC_USEC(a.ending_at, "%Y-%m-%d") ending_at1,
STRFTIME_UTC_USEC(b.ending_at-60*86400000000, "%Y-%m-%d") starting_at2,
STRFTIME_UTC_USEC(b.ending_at, "%Y-%m-%d") ending_at2,
a.country, b.country, CORR(a.c, b.c) corr, COUNT(*) c
FROM
(SELECT country, date+i*86400000000 ending_at, c, i
FROM [gdelt-bq:sample_views.country_date_matconf_numarts] a
CROSS JOIN (SELECT i FROM [fh-bigquery:public_dump.numbers_255] WHERE i < 60) b
) b
JOIN
(SELECT country, date+i*86400000000 ending_at, c, i
FROM [gdelt-bq:sample_views.country_date_matconf_numarts] a
CROSS JOIN (SELECT i FROM [fh-bigquery:public_dump.numbers_255] WHERE i < 60) b
WHERE country='Egypt'
AND date+i*86400000000 = PARSE_UTC_USEC('2011-01-27')) a
ON a.i=b.i
WHERE a.ending_at != b.ending_at
GROUP EACH BY ending_at1, ending_at2, starting_at2, a.country, b.country
HAVING (c = 60 AND abs(corr) > 0.254)
ORDER BY corr DESC
Congratulations! After about 2.5 minutes you should see a list of all the periods from the history of the world over the last 35 years, as monitored by GDELT, that are most similar to Egypt’s two months preceding the core of its revolution. That works out to about 1 million correlations per minute! In all, BigQuery found 23,461 periods from world history that have either a positive or negative statistically significant correlation with Egypt.
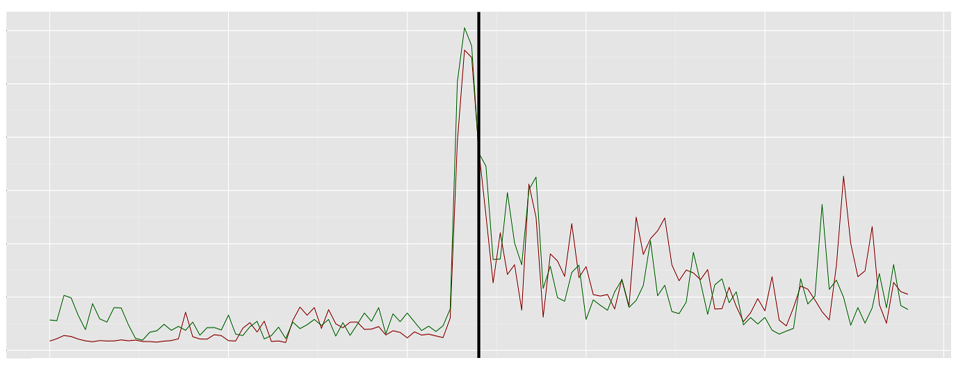
Let’s take a closer look at the results. The two most highly correlated periods are Germany 7/8/2009 – 9/6/2009 (r=0.86) and Sweden 10/4/2010 – 12/3/2010 (r=0.82). The two are shown below graphed in green against Egypt in red, with the X axis being the number of days from the start of the period (thus position 0 corresponds with 11/28/2010 for Egypt, 7/8/2009 for Germany, and 10/4/2010 for Sweden). To make it easier to compare each pair of countries, raw volume counts are replaced with “Z scores” (standard deviations from the mean).
To test the hypothesis of whether looking to the past could offer predictions about the future today, the graph is divided into two halves by a thick black line. To the left of the line is the 60-day time period that was actually used for the correlation (this is the only part that BigQuery looked at). To the right is what happened in the 60 days following that period for Germany and for Sweden, compared with what happened in Egypt this time. Immediately it is clear that in both cases, the post-period timelines for Germany and Sweden (which were not examined as part of the correlation comparison) are remarkably similar to Egypt (r=0.32 for Germany and r=0.36 for Sweden).
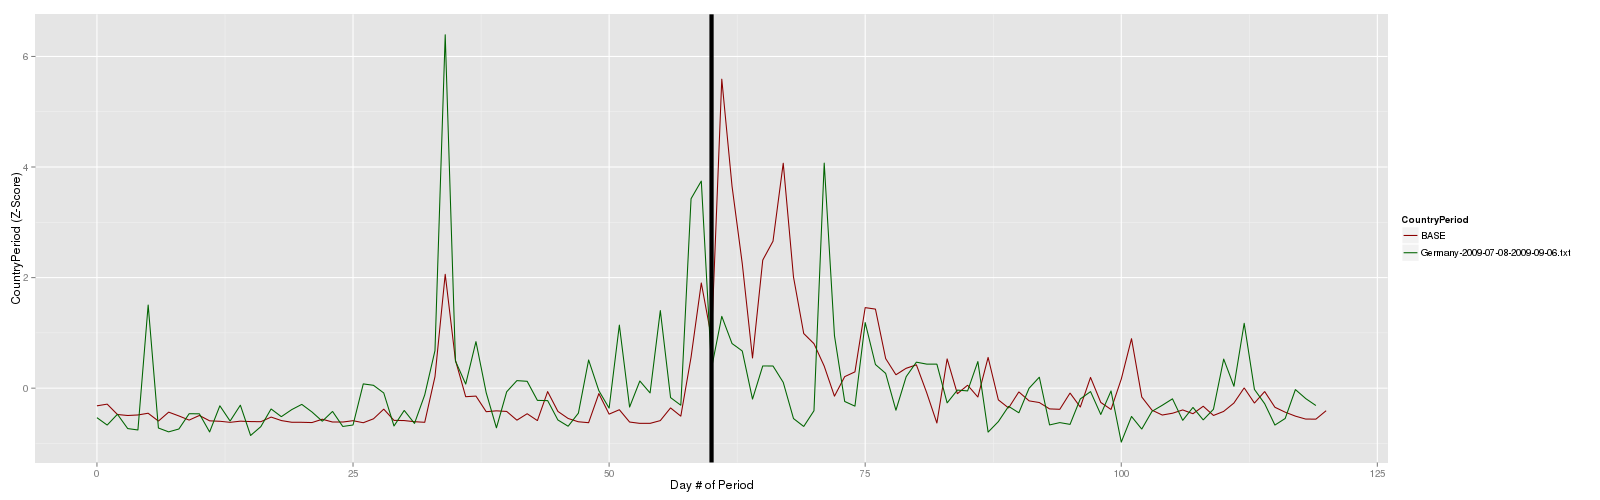
Figure 1 – Germany 7/8/2009 – 9/6/2009 (green left of black line) and 9/6/2009 – 11/5/2009 (green right of black line) compared with Egypt (red)
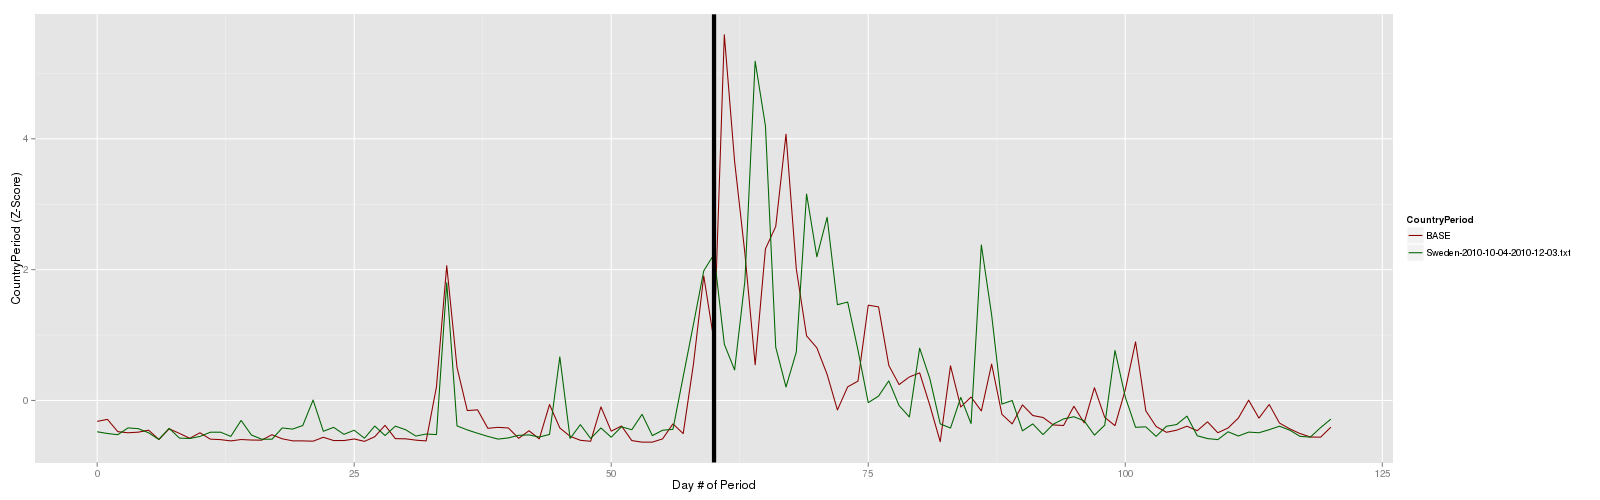
Figure 2 – Sweden 10/4/2010 – 12/3/2010 (green left of black line) and 12/3/2010 – 2/1/2011 (green right of black line) compared with Egypt (red)
Here’s what happens when the post-period 60 day windows for Germany (9/6/2009 – 11/5/2009) and Sweden (12/3/2010 – 2/1/2011) are averaged together and a 2-day smoothing filter used to reduce noise. The graph below compares this result (in green) against what actually happened in Egypt (red). The results are even more similar, this time correlated at r=0.48. Once again, remember that our query searched for 60 day windows most similar to the two months preceding Egypt’s revolution – it did not examine what happened in the two months following each of those historical 60 day windows (in other words, replicating what would happen if you had run this on January 27, 2011). Thus, the fact that we see such strong similarity between what happened after each of those historical 60 day windows and what actually happened in Egypt is quite remarkable. In essence, there was enough similarity to what happened in other countries in the past that this would have given us a measurable forecast of the future.
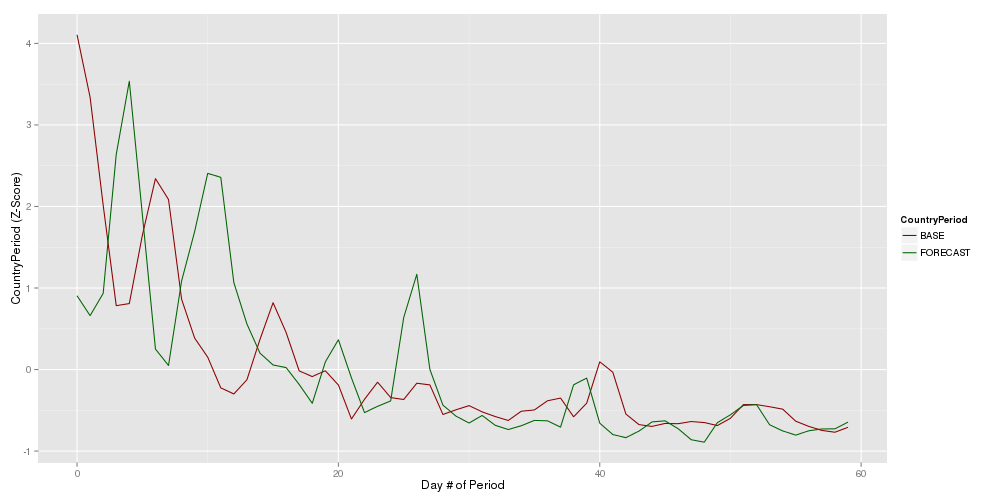
Figure 3 – Egypt (red) compared with average of Germany and Sweden (green) in the following 60 days after the correlated time periods
Yet, one could argue that showing an exponential decrease in media coverage after a major conflict is likely merely a simple pattern that any country would exhibit (so-called “media fatigue”). Let’s look at a second example to test this. Ukrainian President Viktor Yanukovych fled his country on February 22, 2014 as unrest reached a breaking point. Looking at the two month period prior to his departure (12/23/2013 – 2/21/2014), BigQuery this time found 32,626 periods of world history that had statistically significant correlations with this period of Ukraine’s history. The timeline below shows Turkey 12/21/1998 – 2/19/1999, which has a correlation of r=0.97 with Ukraine, while the following 60 days are correlated with Ukraine’s following 60 days at r=0.41.
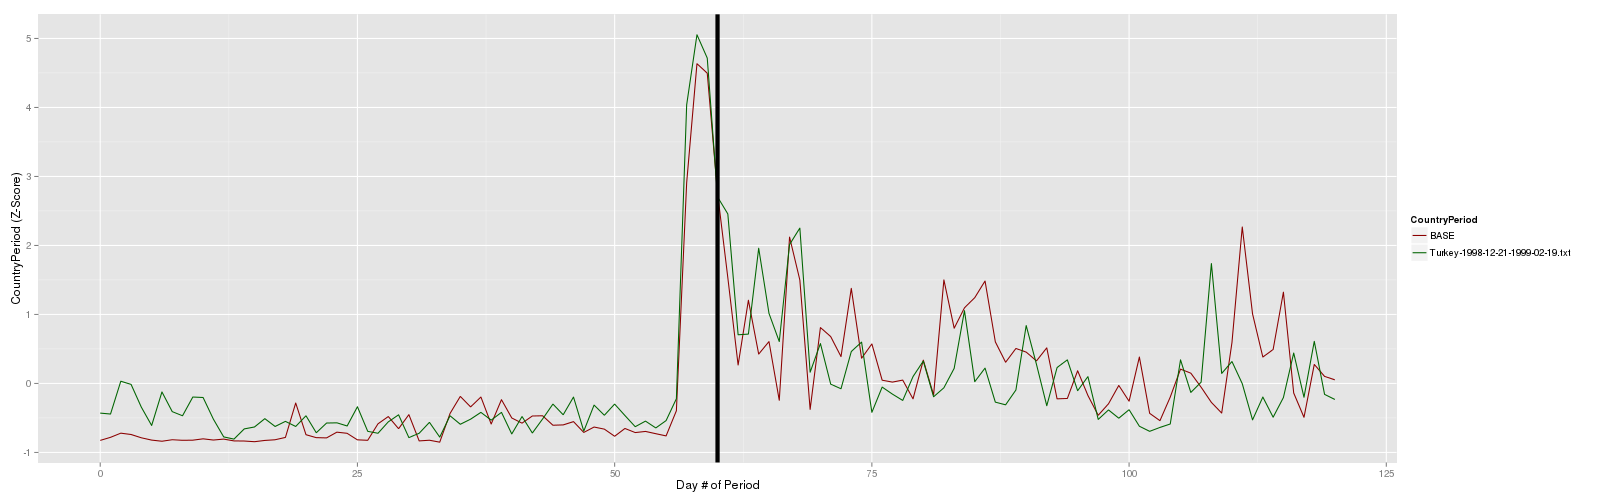
Figure 4 – Turkey 12/21/1998 – 2/19/1999 (green left of black line) and 2/19/1999 – 4/20/1999 (green right of black line) compared with Ukraine (red)
Averaging with the other most correlated period (Lebanon 3/24/2007 – 5/23/2007) and applying a 2-day smoothing filter as before, the results are correlated with what actually happened in Ukraine at r=0.49. This is particularly noteworthy in that, unlike Egypt, the post-period here exhibits far more complex behavior with multiple increase/decrease cycles, and yet is still extremely correlated. In other words, by searching for periods of history similar to what is happening now in a country, one can look at what happened after each of those periods in the past as a measurable forecast of what will happen in the target country in the future.
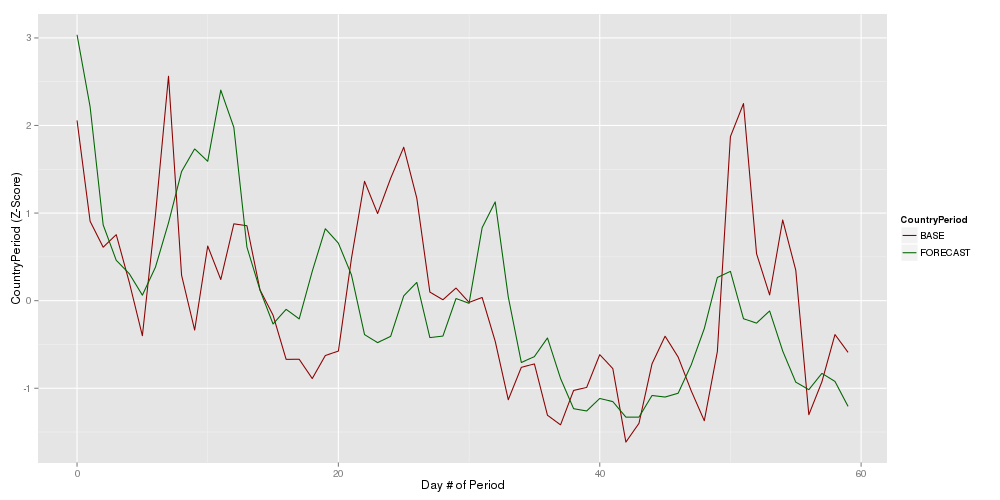
Figure 5 – Ukraine (red) compared with average of Turkey and Lebanon (green) in the following 60 days after the correlated time periods
What’s even more amazing is that this analysis is not the result of a massive custom-built parallel application built by a team of specialized HPC programmers and requiring a dedicated cluster to run on: in stark contrast, it is the result of a single line of SQL code (plus a second line to create the initial “view”). All of the complex parallelism, data management, and IO optimization is handled transparently by Google BigQuery. Imagine that – a single line of SQL performing 2.5 million correlations in just 2.5 minutes to uncover the underlying patterns of global society. BigQuery’s unprecedented speed and simplicity (just load your data and start asking questions of it) makes it possible to explore even the universe’s most complex and fundamental questions in realtime.
Of course, in reality the resulting forecasts above are heavily influenced by the way in which the news media covers global events, from media fatigue to helicopter journalism. Yet, the news media fundamentally shapes how we understand global events around us, and the remarkably strong correlations, even in the case of Ukraine’s complex cyclic post-period, offer a fascinating view into the historical cycles of global society as seen through the lens of the world’s news.
While it is unlikely that one would build a true political risk forecasting system on an approach this simple, it does suggest that world history, at least the view of it we see through the news media, is highly cyclic and predictable, and that there is much yet to be discovered. Will these patterns hold for every country and time period and is there a certain rolling window size that works better or worse? Does a different time interval or switching to a different set of event types improve or degrade accuracy? Does it work better just before a conflict or only in its first few days? Let your creativity run wild and let us know what you find!
Whether these patterns capture the actual psychohistorical equations governing all of human life or, perhaps far more likely, a more precise mathematical definition of how journalism shapes our understanding of global events, they demonstrate the unprecedented power of the new generation of “big data” tools like Google BigQuery to uncover the unexpected. Have we arrived at Isaac Asimov’s Psychohistory yet? Not quite, but these results offer a glimpse into the future of how big data will redefine the way we understand ourselves.