GDELT's unique global reach across more than 150 languages spanning nearly every corner of the globe makes it possible to perform planetary-scale surveys of global society, seeing the world through the eyes of others and capturing the heartbeat of the planet we call home. With the debut of Web NGrams 3.0 last year, conducting such analyses is now merely a single SQL statement away. To showcase this power, we are going to chart global anxiety over the course of the COVID-19 pandemic.
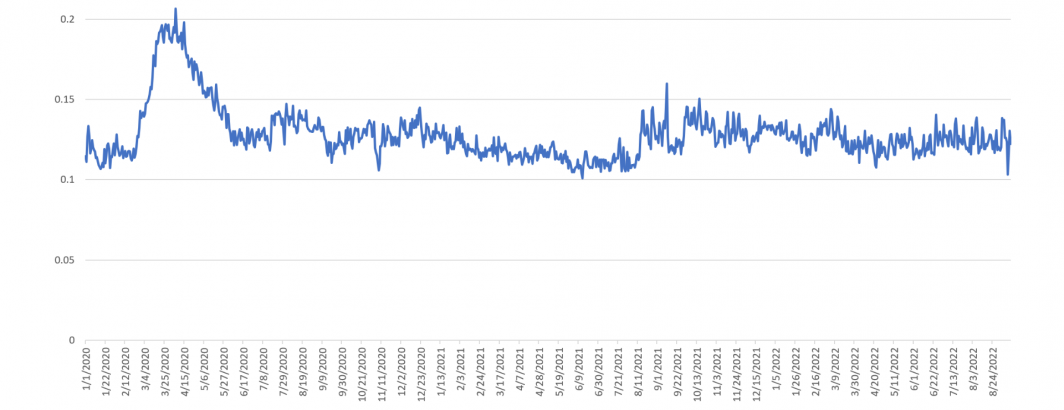
Sentiment mining is typically thought of as restricted to the polar dimensions of "positive" and "negative" but such metrics are highly limiting and can mislead in highly polarized societies where stories can exert nearly equal positive and negative emotion. More sophisticated measures like "anxiety" capture the overall unease of societies as they attempt to process unsettling news. Over the years we have found Colin Martindale's Regressive Imagery Dictionary to be particularly responsive to such unease in news content and have used it here to chart the average anxiety of worldwide English-language online news coverage monitored by GDELT by day since the start of 2020.
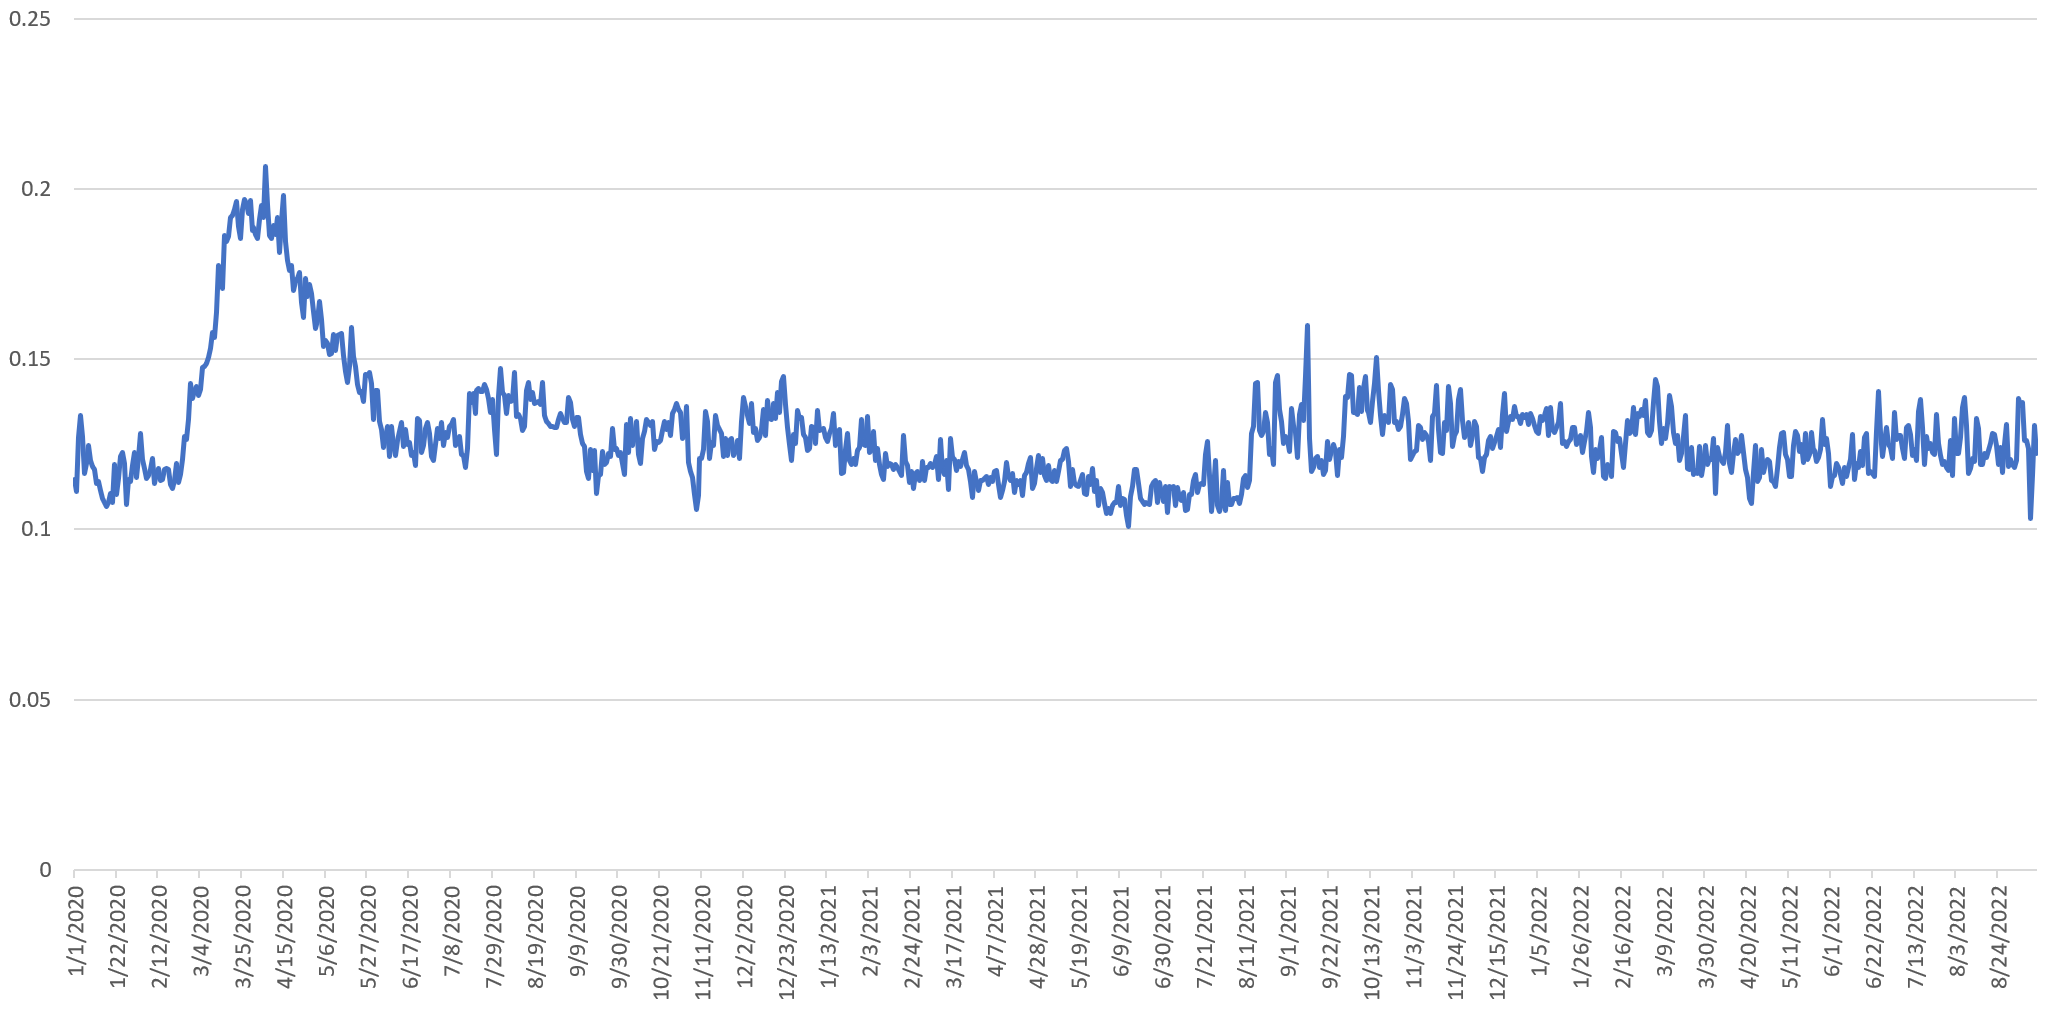
As lockdowns spread across the world and the pandemic's likely disruption to society became ever-clearer, anxiety surges beginning on February 24th, 2020, peaking on March 21st. Anxiety remained at this elevated level through April 15th, before sharply falling through June 4th, 2020. A second surge occurred beginning on August 9, 2021 as the fall of Kabul came into focus and peaked on the 16th as the country fell to the Taliban. Anxiety has remained elevated in the months since as inflation and other stories have taken over.
Importantly, for public health messaging, primary anxiety around the pandemic quickly faded as attention shifted to other topics, societies around the world digested and processed their concerns and disruptive events became normalized.
Constructing this timeline was as simple as:
SELECT date, SUM(TOTMENTIONS) TOTWORDS, SUM(TONECOUNT) TOTTONEWORDS, SUM(TONECOUNT) / SUM(TOTMENTIONS) * 100 perc_anxiety from (
  SELECT FORMAT_TIMESTAMP("%m/%d/%Y", date) date, 0 TOTMENTIONS, COUNT(1) TONECOUNT FROM `gdelt-bq.gdeltv2.webngrams` where lang='en' and LOWER(ngram) in (SELECT LOWER(WORD) FROM `[YOURTONETABLE]`) and DATE(date) >= "2020-01-01" group by date, ngram
UNION ALL
  SELECT FORMAT_TIMESTAMP("%m/%d/%Y", date) date, COUNT(1) TOTMENTIONS, 0 TONECOUNT FROM `gdelt-bq.gdeltv2.webngrams` where lang='en' and DATE(date) >= "2020-01-01" group by date, ngram
) group by DATE order by DATE asc
We hope this inspires you to think about the kinds of planetary-scale sentiment analyses are possible using GDELT's ngrams datasets!